| Param | Original file | Final file |
|---|---|---|
| Filename | modeM0/AS1A09_121T01_9000005136_35773cztM0_level2.evt | modeM0/AS1A09_121T01_9000005136_35773cztM0_level2_quad_clean.evt |
| Size (bytes) | 303,566,400 | 45,792,000 |
| Size | 289.5 MB | 43.7 MB |
| Events in quadrant A | 1,938,171 | 283,380 |
| Events in quadrant B | 2,772,951 | 285,304 |
| Events in quadrant C | 2,055,349 | 279,176 |
| Events in quadrant D | 2,166,822 | 268,924 |
| Mode M9 | |||
|---|---|---|---|
| Quadrant | BADHDUFLAG | Total packets | Discarded packets |
| A | 0 | 14 | 0 |
| B | 0 | 14 | 0 |
| C | 0 | 14 | 0 |
| D | 0 | 14 | 0 |
| Mode M0 | |||
|---|---|---|---|
| Quadrant | BADHDUFLAG | Total packets | Discarded packets |
| A | 0 | 8039 | 2 |
| B | 0 | 10740 | 1 |
| C | 0 | 8292 | 1 |
| D | 0 | 8946 | 1 |
| Mode SS | |||
|---|---|---|---|
| Quadrant | BADHDUFLAG | Total packets | Discarded packets |
| A | 0 | 78 | 0 |
| B | 0 | 78 | 0 |
| C | 0 | 78 | 0 |
| D | 0 | 78 | 0 |
| Quadrant | Total seconds | Saturated seconds | Saturation percentage |
|---|---|---|---|
| A | 3813 | 24 | 0.629426% |
| B | 3813 | 279 | 7.317073% |
| C | 3813 | 45 | 1.180173% |
| D | 3813 | 52 | 1.363756% |
Noise dominated data is calculated using 1-second bins in cleaned event files. If a bin has >2000 counts, and if more than 50% of those come from <1% of pixels, then it is considered to be noise-dominated and hence unusable.
| Quadrant | # 1 sec bins | Bins with >0 counts | Bins with >2000 counts | High rate bins dominated by noise | Noise dominated (total time) | Noise dominated (detector-on time) | Marked lightcurve |
|---|---|---|---|---|---|---|---|
| A | 5216 | 3814 | 19 | 19 | 0.36% | 0.50% | 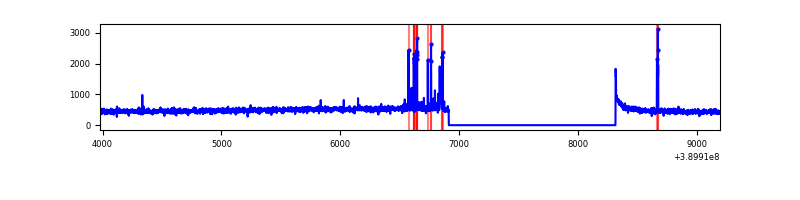 |
| B | 5216 | 3814 | 209 | 209 | 4.01% | 5.48% | 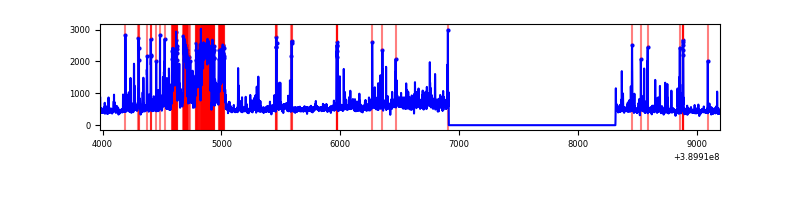 |
| C | 5216 | 3814 | 41 | 41 | 0.79% | 1.07% | 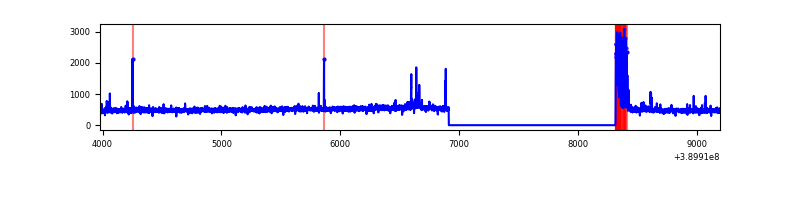 |
| D | 5216 | 3814 | 47 | 47 | 0.90% | 1.23% | 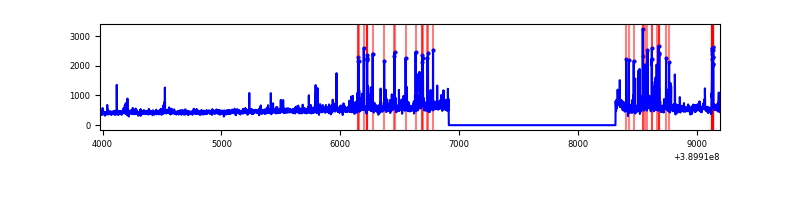 |
Top three noisy pixels from each quadrant. If the there are fewer than three noisy pixels in the level2.evt file, extra rows are filled as -1
| Pixel properties | Quadrant properties | ||||||
|---|---|---|---|---|---|---|---|
| Quadrant | DetID | PixID | Counts | Sigma | Mean | Median | Sigma |
| A | 10 | 83 | 97448 | 1046.38 | 453 | 443 | 92.7 |
| A | 15 | 237 | 67398 | 722.23 | 453 | 443 | 92.7 |
| A | 10 | 248 | 14660 | 153.36 | 453 | 443 | 92.7 |
| B | 5 | 172 | 675387 | 7775.17 | 440 | 430 | 86.8 |
| B | 0 | 213 | 91077 | 1044.21 | 440 | 430 | 86.8 |
| B | 5 | 255 | 84186 | 964.83 | 440 | 430 | 86.8 |
| C | 15 | 214 | 160126 | 1538.82 | 439 | 442 | 103.8 |
| C | 0 | 10 | 136845 | 1314.46 | 439 | 442 | 103.8 |
| C | 9 | 187 | 25134 | 237.95 | 439 | 442 | 103.8 |
| D | 13 | 249 | 110130 | 1007.5 | 441 | 429 | 108.9 |
| D | 8 | 195 | 85484 | 781.15 | 441 | 429 | 108.9 |
| D | 13 | 13 | 65776 | 600.15 | 441 | 429 | 108.9 |
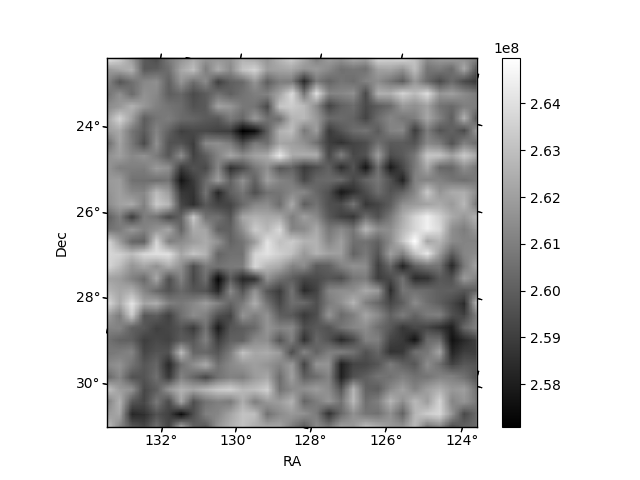
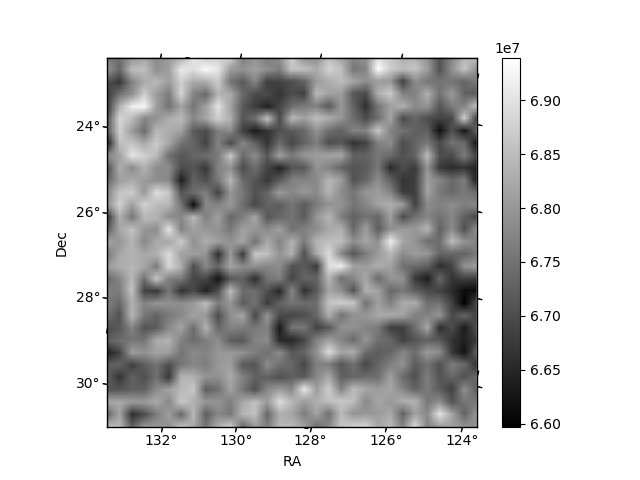
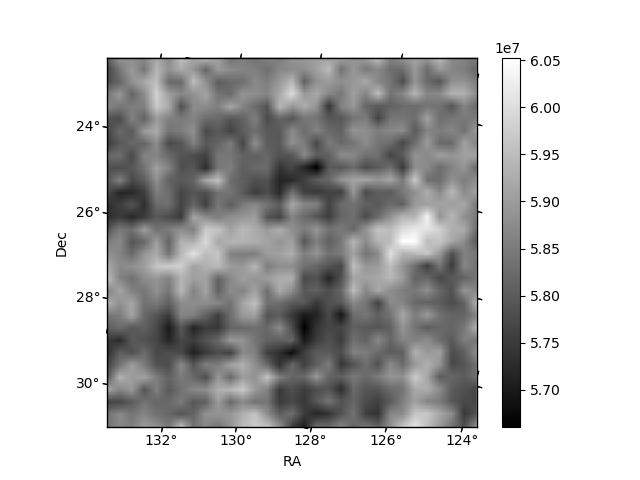
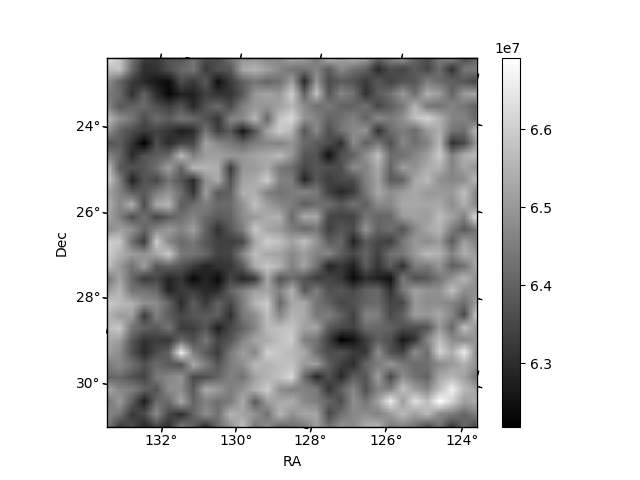
Histogram calculated using DETX and DETY for each event in the final _common_clean file
| Quadrant A | 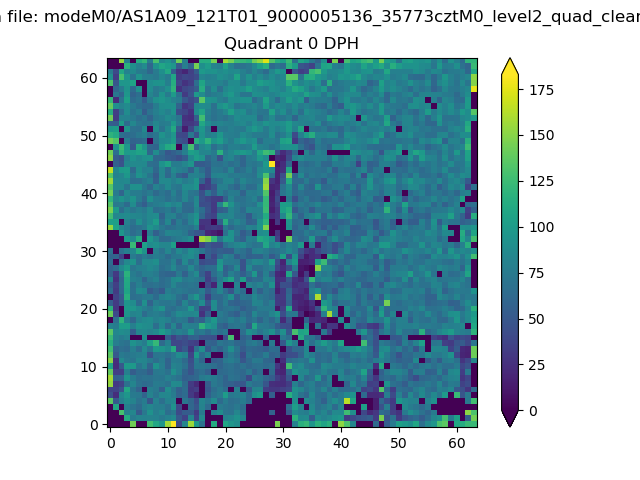 |
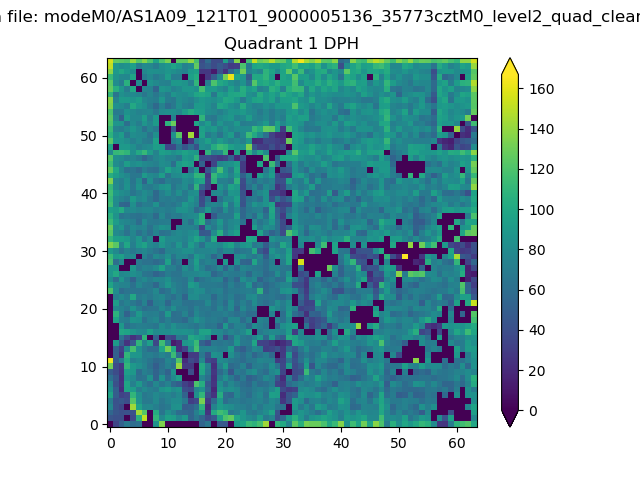 |
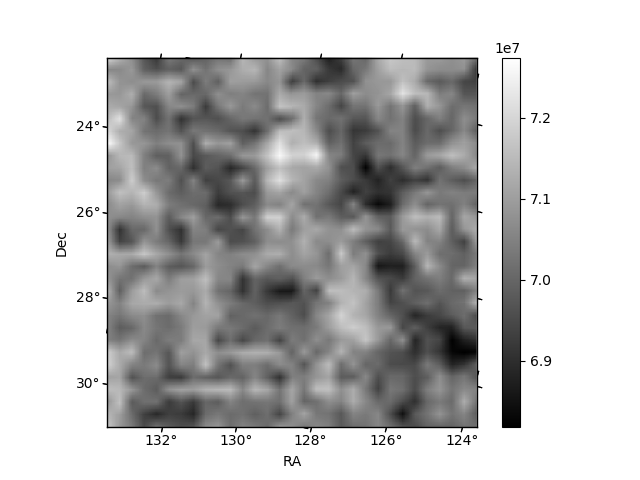
Quadrant B |
|---|---|---|---|
| Quadrant D | 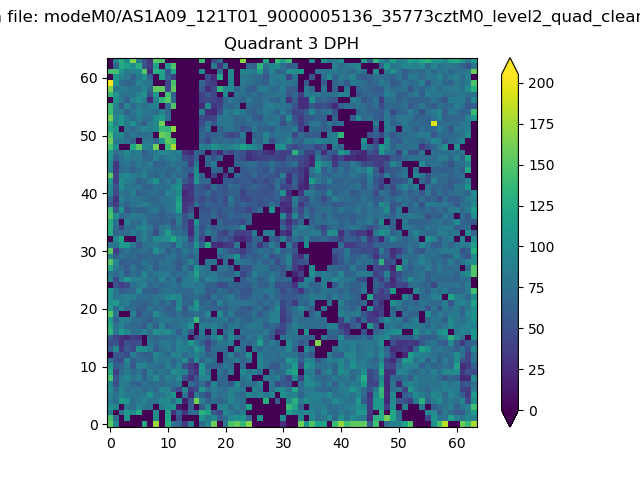 |
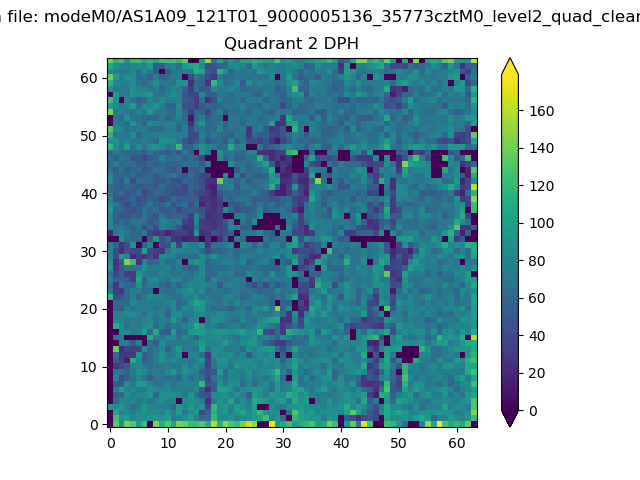 |
Quadrant C |
| Plot type | Count rate plots | Images |
|---|---|---|
| Comparison with Poisson distribution Blue bars denote a histogram of data divided into 1 sec bins. Red curve is a Poisson curve with rate = median count rate of data. |
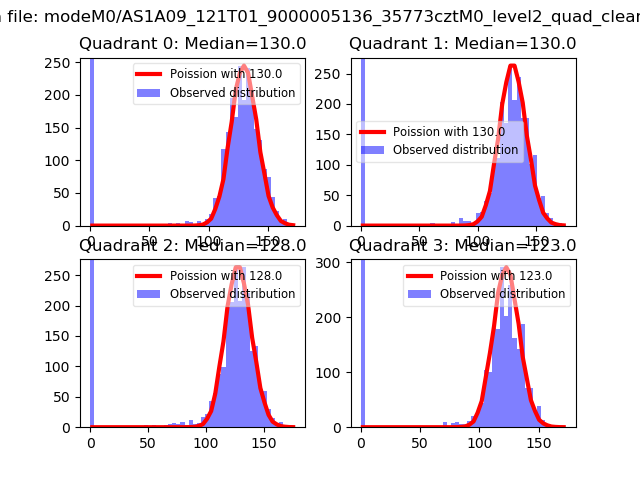 |
 |
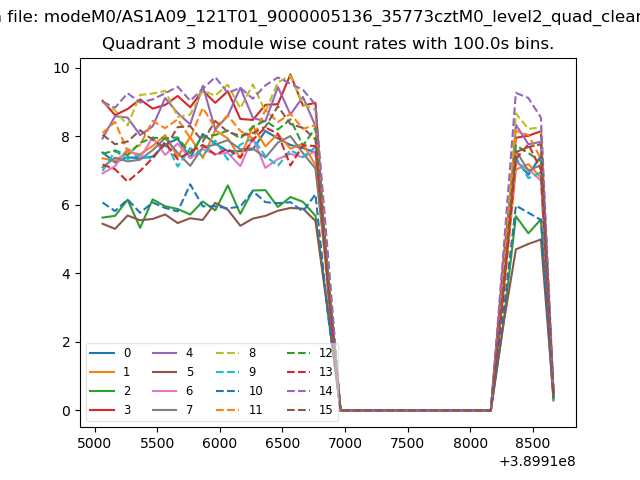
| Quadrant-wise count rates Data is divided into 100 sec bins |
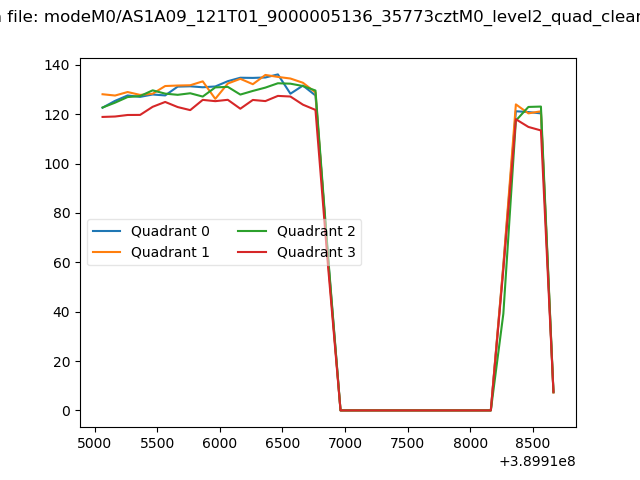 |
|
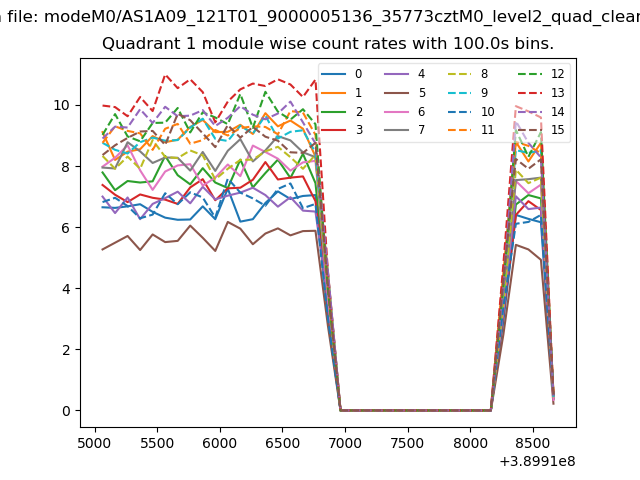
| Module-wise count rates for Quadrant A Data is divided into 100 sec bins |
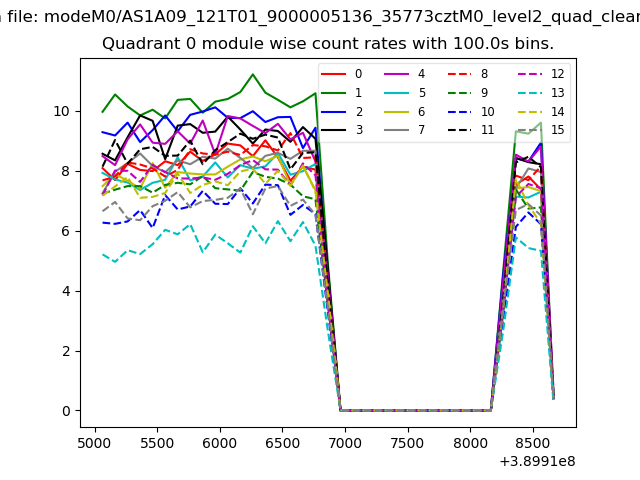 |
 |
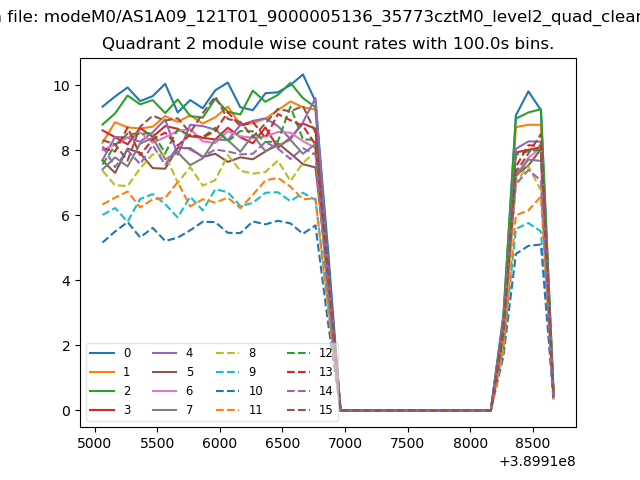
| Module-wise count rates for Quadrant B Data is divided into 100 sec bins |
 |
 |
| Module-wise count rates for Quadrant C Data is divided into 100 sec bins |
 |
 |
| Module-wise count rates for Quadrant D Data is divided into 100 sec bins |
 |
 |
| Parameter | Plot |
|---|---|
| CZT HV Monitor |  |
| D_VDD |  |
| Temperature 1 | 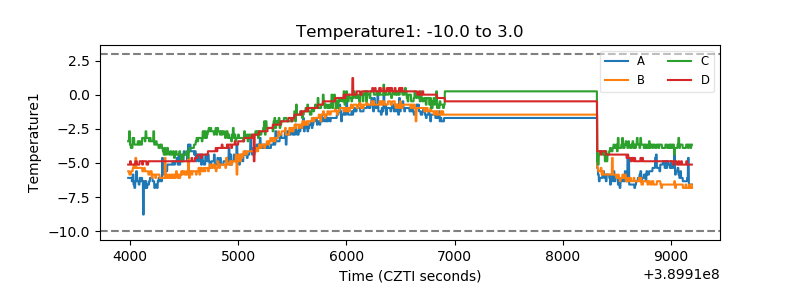 |
| Veto HV Monitor | 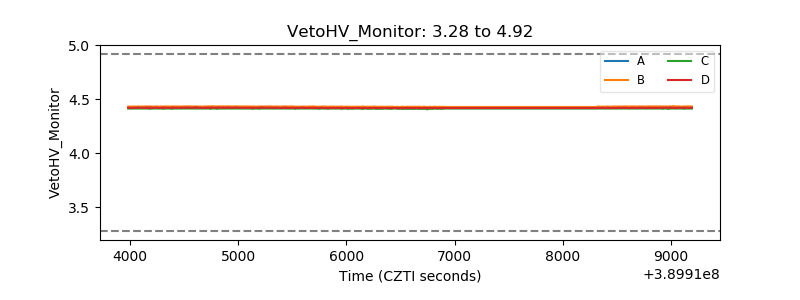 |
| Veto LLD | 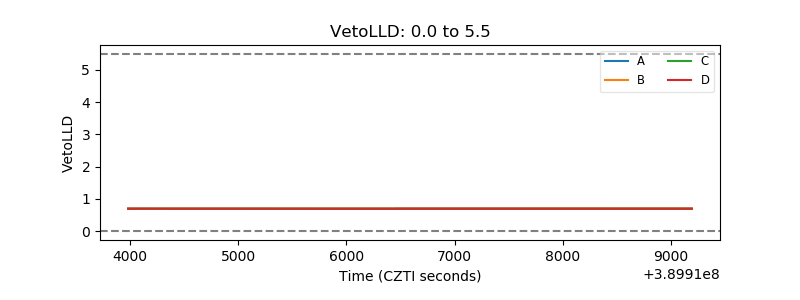 |
| Alpha Counter | 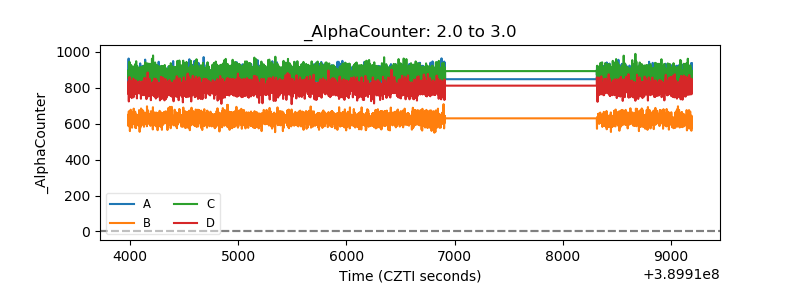 |
| _CPM_Rate | 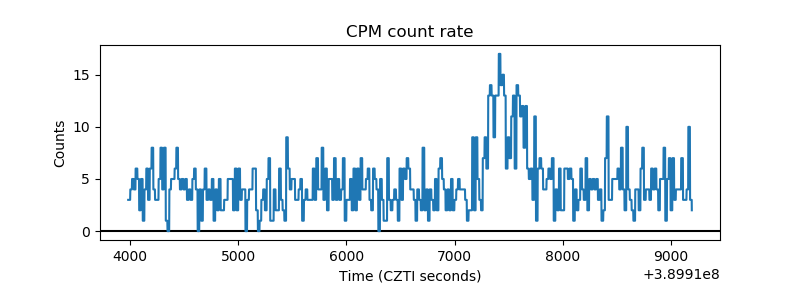 |
| CZT Counter | 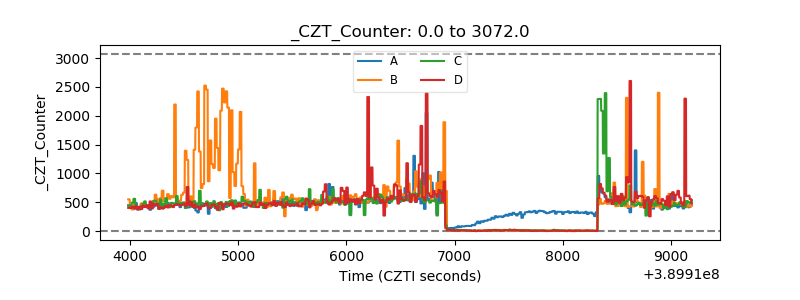 |
| +2.5 Volts monitor | 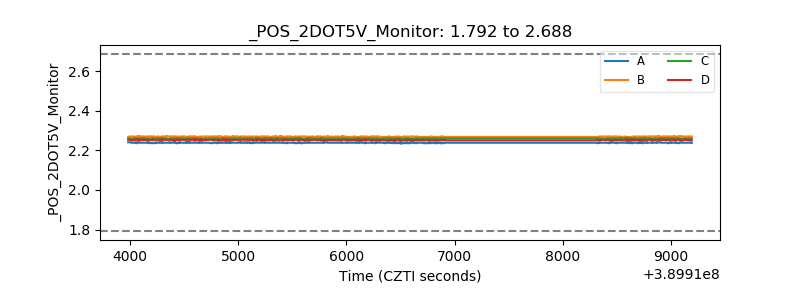 |
| +5 Volts monitor | 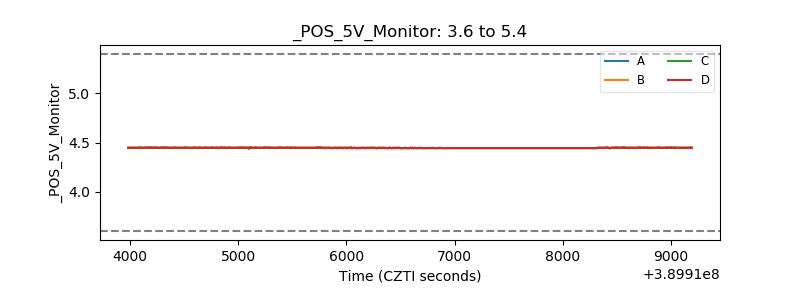 |
| _ROLL_ROT | 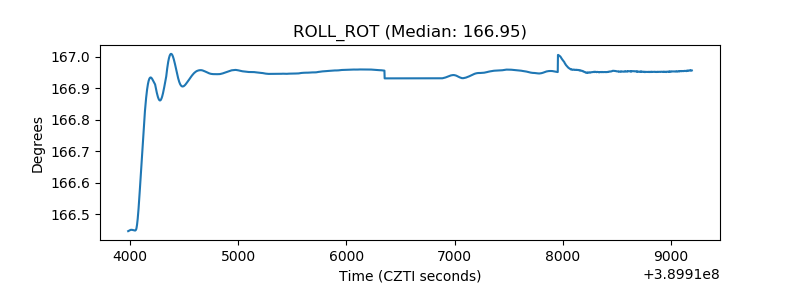 |
| _Roll_DEC | 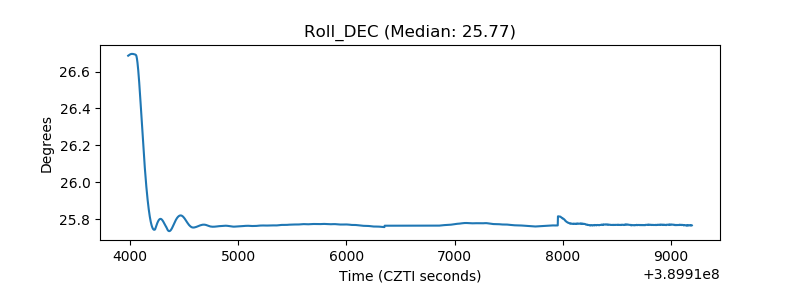 |
| _Roll_RA | 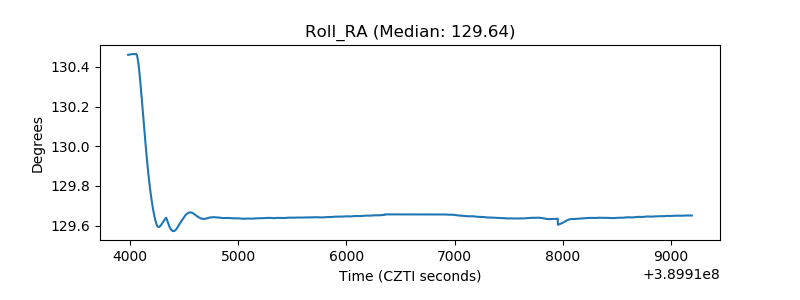 |
| Veto Counter | 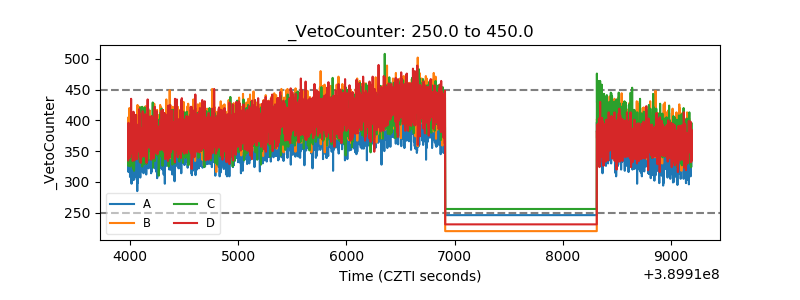 |