| Param | Original file | Final file |
|---|---|---|
| Filename | modeM0/AS1A10_058T14_9000005134_35773cztM0_level2.evt | modeM0/AS1A10_058T14_9000005134_35773cztM0_level2_quad_clean.evt |
| Size (bytes) | 74,059,200 | 18,771,840 |
| Size | 70.6 MB | 17.9 MB |
| Events in quadrant A | 499,792 | 126,770 |
| Events in quadrant B | 497,360 | 126,265 |
| Events in quadrant C | 552,886 | 119,444 |
| Events in quadrant D | 621,898 | 118,665 |
| Mode SS | |||
|---|---|---|---|
| Quadrant | BADHDUFLAG | Total packets | Discarded packets |
| A | 0 | 20 | 0 |
| B | 0 | 20 | 0 |
| C | 0 | 20 | 0 |
| D | 0 | 20 | 0 |
| Mode M9 | |||
|---|---|---|---|
| Quadrant | BADHDUFLAG | Total packets | Discarded packets |
| A | 0 | 8 | 0 |
| B | 0 | 8 | 0 |
| C | 0 | 8 | 0 |
| D | 0 | 9 | 0 |
| Mode M0 | |||
|---|---|---|---|
| Quadrant | BADHDUFLAG | Total packets | Discarded packets |
| A | 0 | 2132 | 1 |
| B | 0 | 2092 | 1 |
| C | 0 | 2290 | 1 |
| D | 0 | 2518 | 1 |
| Quadrant | Total seconds | Saturated seconds | Saturation percentage |
|---|---|---|---|
| A | 997 | 2 | 0.200602% |
| B | 997 | 4 | 0.401204% |
| C | 997 | 29 | 2.908726% |
| D | 997 | 7 | 0.702106% |
Noise dominated data is calculated using 1-second bins in cleaned event files. If a bin has >2000 counts, and if more than 50% of those come from <1% of pixels, then it is considered to be noise-dominated and hence unusable.
| Quadrant | # 1 sec bins | Bins with >0 counts | Bins with >2000 counts | High rate bins dominated by noise | Noise dominated (total time) | Noise dominated (detector-on time) | Marked lightcurve |
|---|---|---|---|---|---|---|---|
| A | 997 | 997 | 1 | 1 | 0.10% | 0.10% | 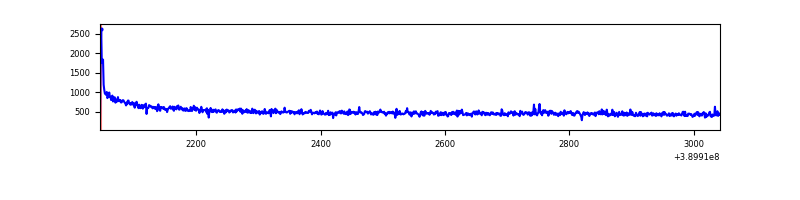 |
| B | 997 | 997 | 1 | 1 | 0.10% | 0.10% | 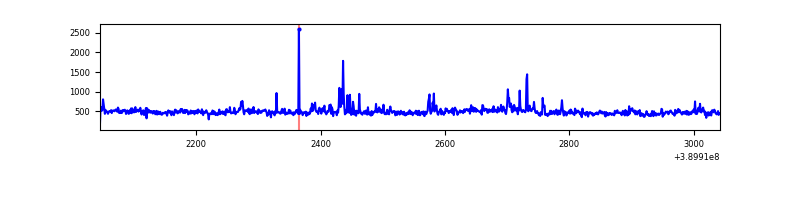 |
| C | 997 | 997 | 28 | 28 | 2.81% | 2.81% | 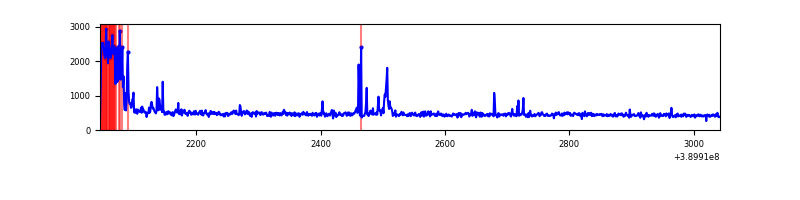 |
| D | 997 | 997 | 9 | 9 | 0.90% | 0.90% | 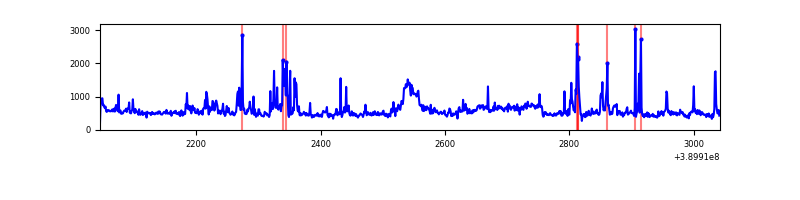 |
Top three noisy pixels from each quadrant. If the there are fewer than three noisy pixels in the level2.evt file, extra rows are filled as -1
| Pixel properties | Quadrant properties | ||||||
|---|---|---|---|---|---|---|---|
| Quadrant | DetID | PixID | Counts | Sigma | Mean | Median | Sigma |
| A | 10 | 83 | 58219 | 2359.61 | 112 | 110 | 24.6 |
| A | 13 | 6 | 2972 | 116.22 | 112 | 110 | 24.6 |
| A | 10 | 67 | 2426 | 94.05 | 112 | 110 | 24.6 |
| B | 5 | 255 | 17412 | 734.82 | 110 | 107 | 23.6 |
| B | 0 | 189 | 10588 | 445.05 | 110 | 107 | 23.6 |
| B | 0 | 213 | 9493 | 398.55 | 110 | 107 | 23.6 |
| C | 0 | 10 | 83409 | 3203.39 | 103 | 103 | 26.0 |
| C | 15 | 214 | 45110 | 1730.66 | 103 | 103 | 26.0 |
| C | 9 | 187 | 20258 | 775.03 | 103 | 103 | 26.0 |
| D | 7 | 223 | 74043 | 2635.69 | 106 | 102 | 28.1 |
| D | 13 | 249 | 52586 | 1870.83 | 106 | 102 | 28.1 |
| D | 8 | 195 | 32867 | 1167.94 | 106 | 102 | 28.1 |
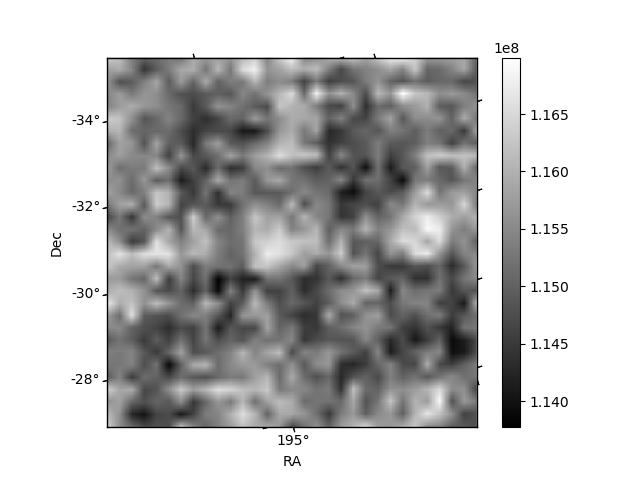
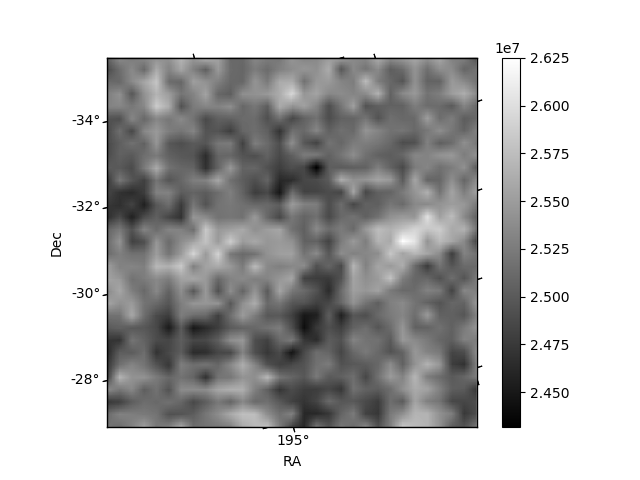
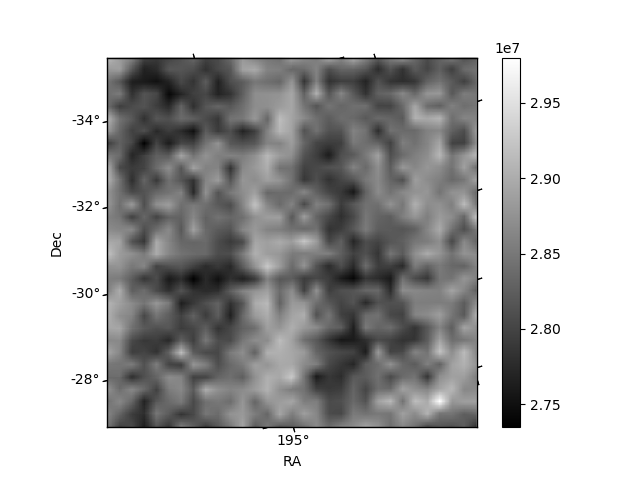
Histogram calculated using DETX and DETY for each event in the final _common_clean file
| Quadrant A | 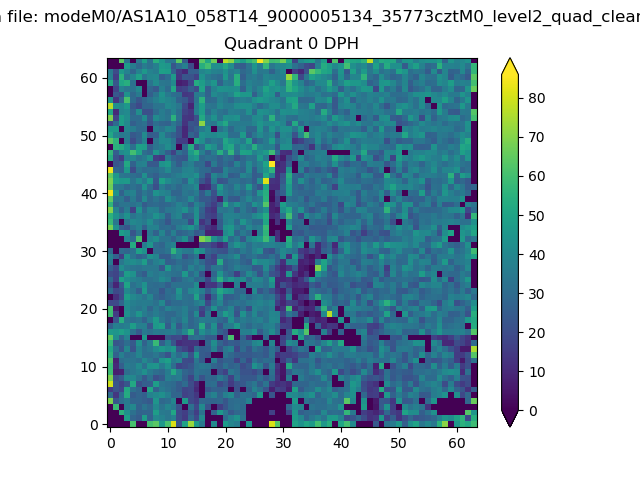 |
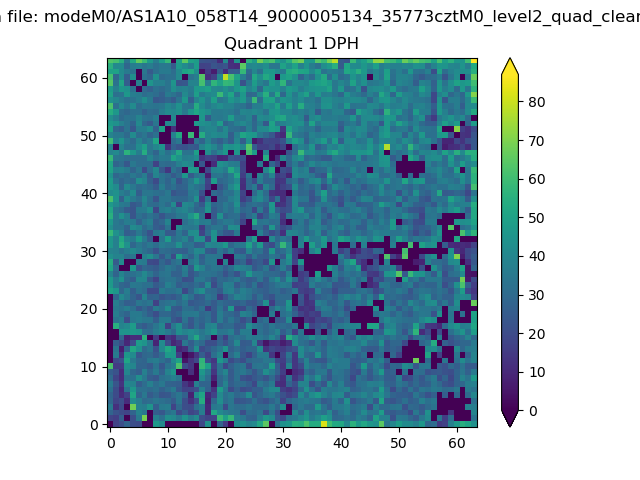 |
Quadrant B |
|---|---|---|---|
| Quadrant D | 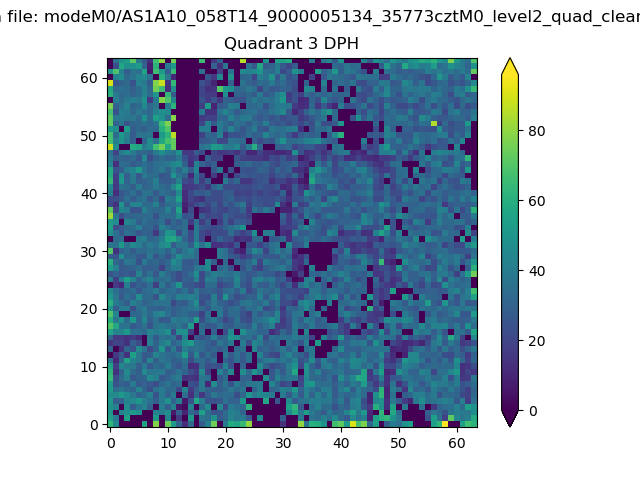 |
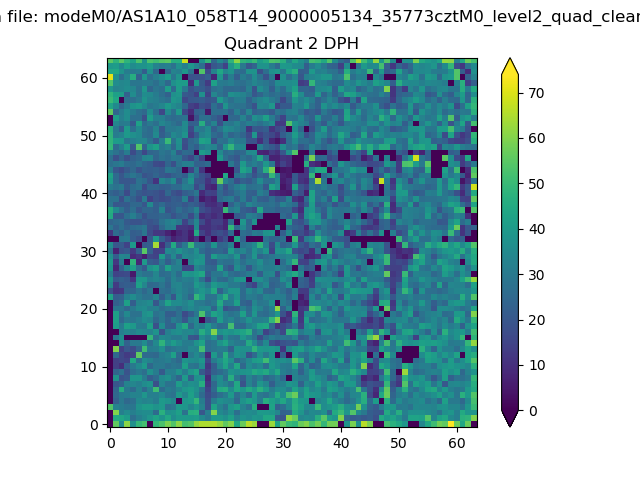 |
Quadrant C |
| Plot type | Count rate plots | Images |
|---|---|---|
| Comparison with Poisson distribution Blue bars denote a histogram of data divided into 1 sec bins. Red curve is a Poisson curve with rate = median count rate of data. |
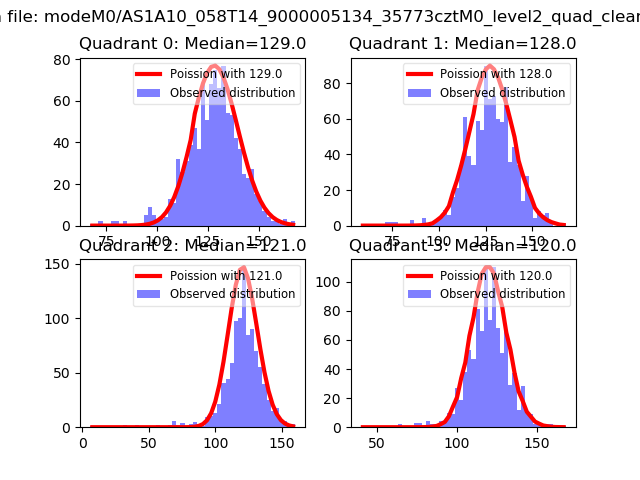 |
 |
| Quadrant-wise count rates Data is divided into 100 sec bins |
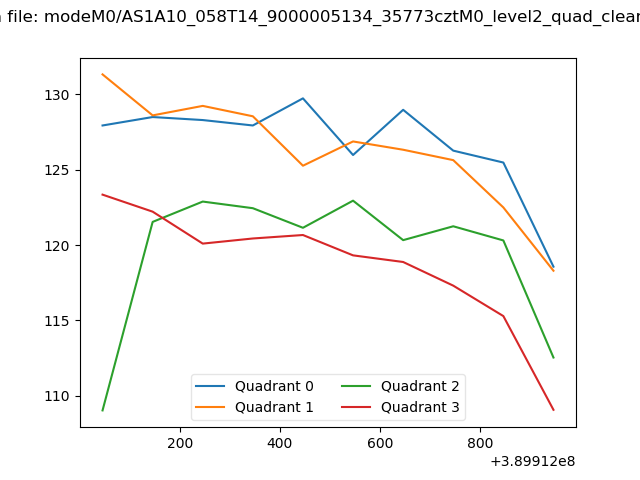 |
|
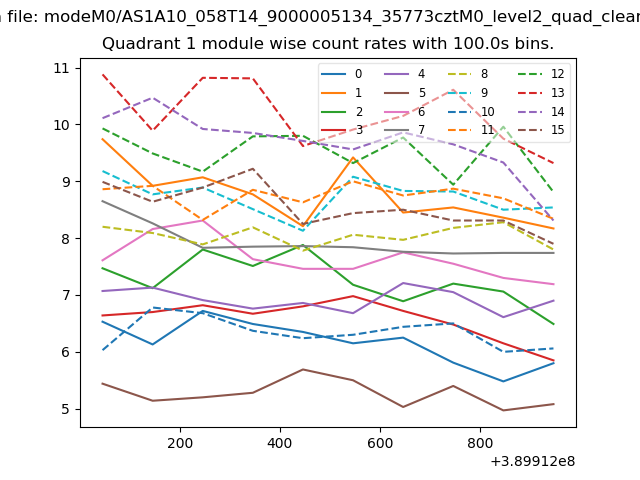
| Module-wise count rates for Quadrant A Data is divided into 100 sec bins |
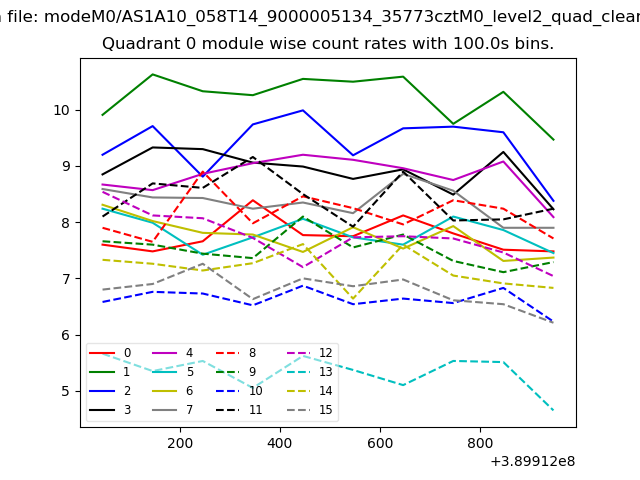 |
 |
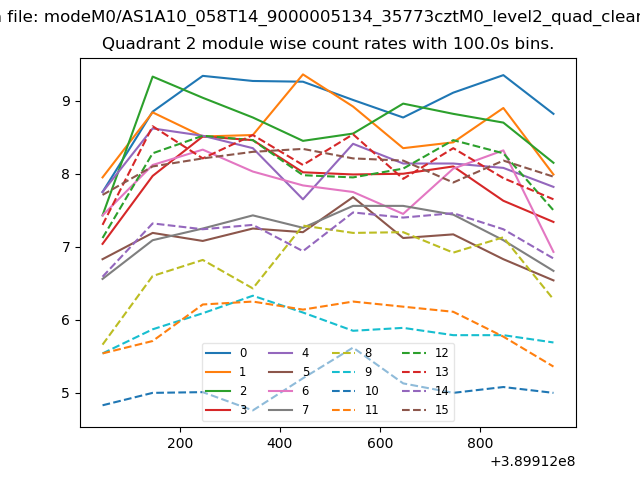
| Module-wise count rates for Quadrant B Data is divided into 100 sec bins |
 |
 |
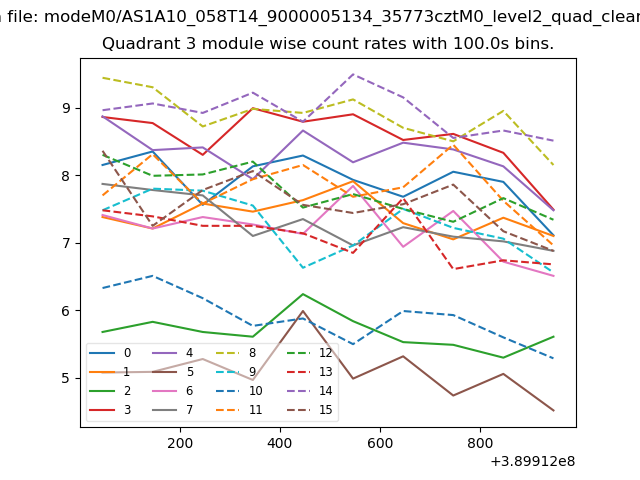
| Module-wise count rates for Quadrant C Data is divided into 100 sec bins |
 |
 |
| Module-wise count rates for Quadrant D Data is divided into 100 sec bins |
 |
 |
| Parameter | Plot |
|---|---|
| CZT HV Monitor | 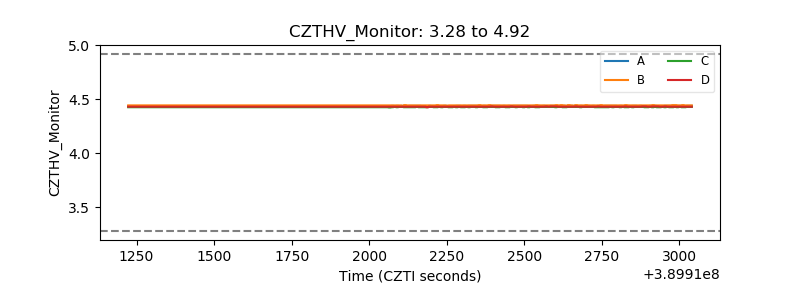 |
| D_VDD | 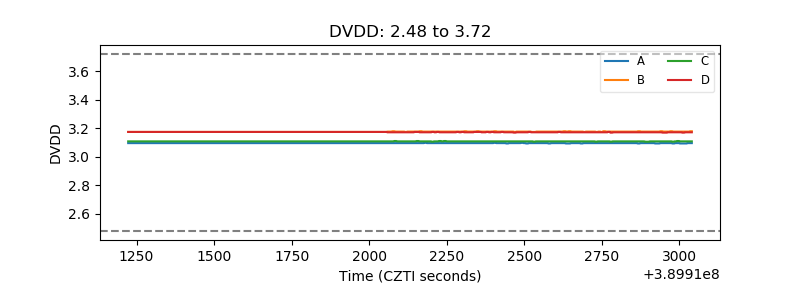 |
| Temperature 1 | 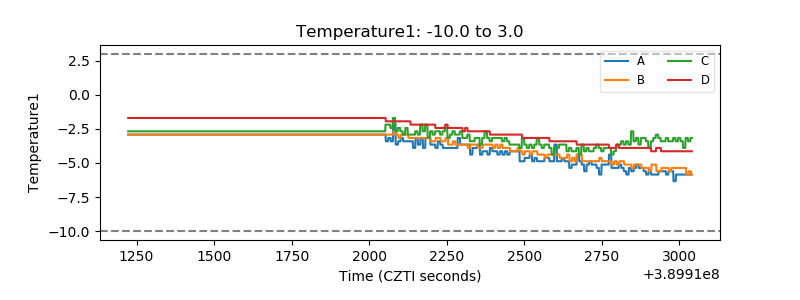 |
| Veto HV Monitor |  |
| Veto LLD | 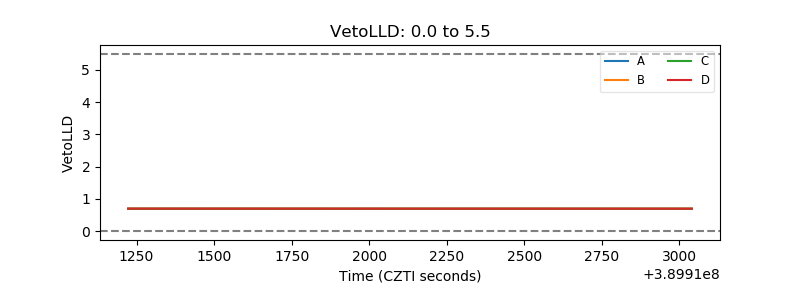 |
| Alpha Counter | 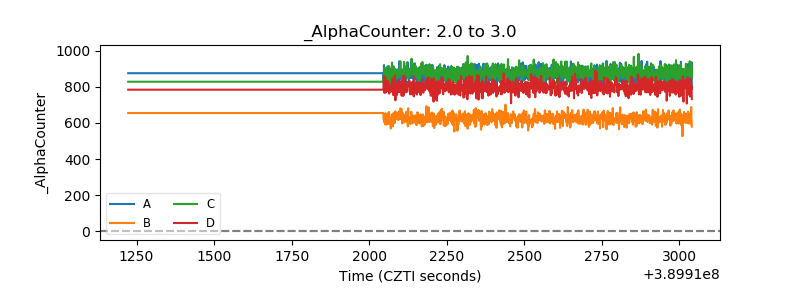 |
| _CPM_Rate | 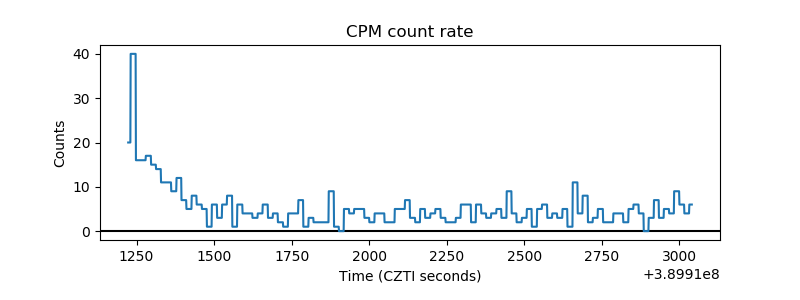 |
| CZT Counter | 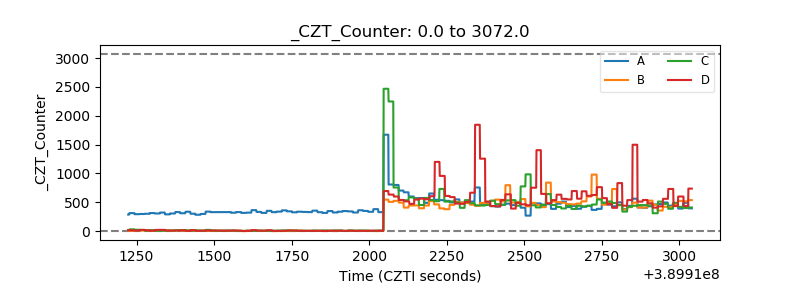 |
| +2.5 Volts monitor | 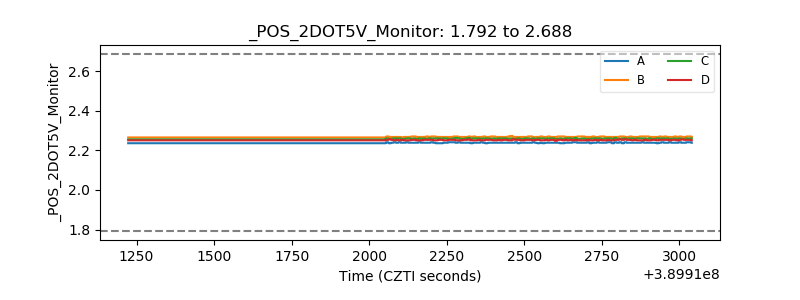 |
| +5 Volts monitor | 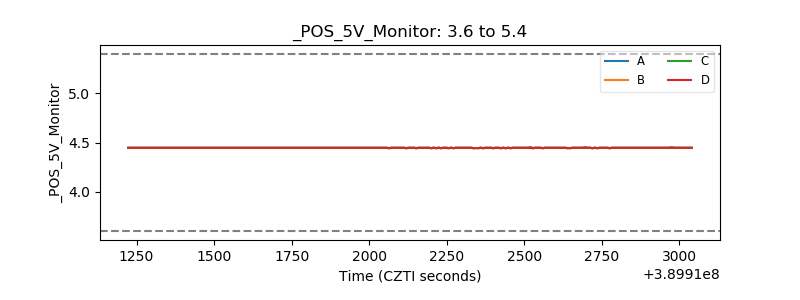 |
| _ROLL_ROT | 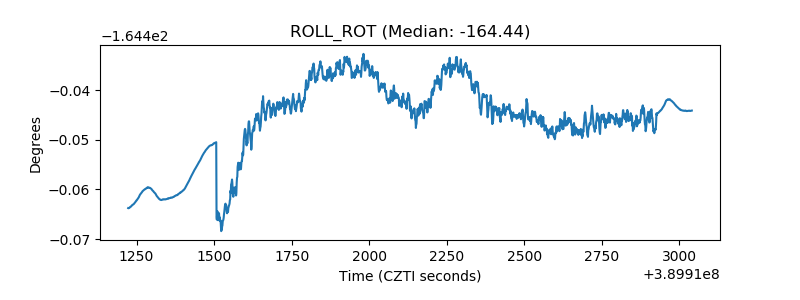 |
| _Roll_DEC | 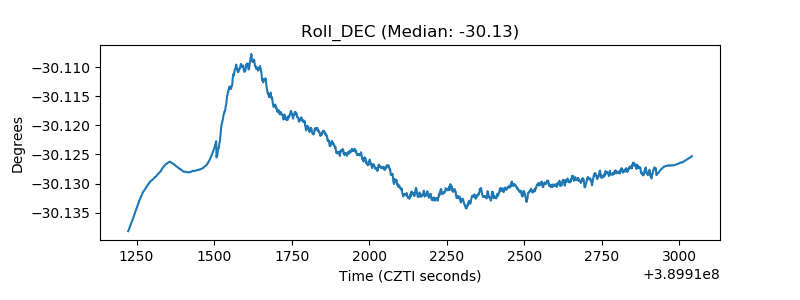 |
| _Roll_RA | 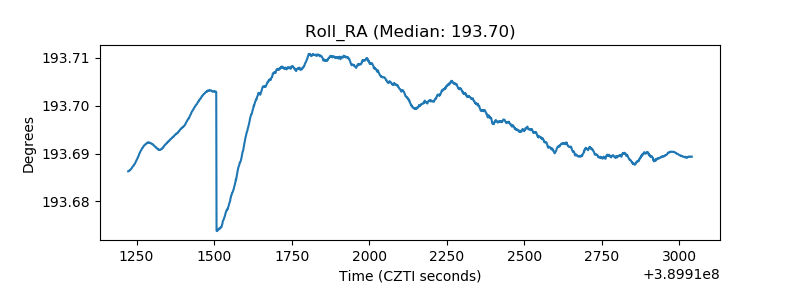 |
| Veto Counter |  |