| Param | Original file | Final file |
|---|---|---|
| Filename | modeM0/AS1A10_058T14_9000005134_35771cztM0_level2.evt | modeM0/AS1A10_058T14_9000005134_35771cztM0_level2_quad_clean.evt |
| Size (bytes) | 385,649,280 | 74,364,480 |
| Size | 367.8 MB | 70.9 MB |
| Events in quadrant A | 2,530,392 | 488,880 |
| Events in quadrant B | 2,796,584 | 486,224 |
| Events in quadrant C | 2,783,830 | 459,771 |
| Events in quadrant D | 3,214,584 | 452,434 |
| Mode SS | |||
|---|---|---|---|
| Quadrant | BADHDUFLAG | Total packets | Discarded packets |
| A | 0 | 106 | 0 |
| B | 0 | 106 | 0 |
| C | 0 | 106 | 0 |
| D | 0 | 106 | 0 |
| Mode M9 | |||
|---|---|---|---|
| Quadrant | BADHDUFLAG | Total packets | Discarded packets |
| A | 0 | 23 | 0 |
| B | 0 | 23 | 0 |
| C | 0 | 23 | 0 |
| D | 0 | 24 | 0 |
| Mode M0 | |||
|---|---|---|---|
| Quadrant | BADHDUFLAG | Total packets | Discarded packets |
| A | 0 | 10794 | 3 |
| B | 0 | 11642 | 2 |
| C | 0 | 11461 | 2 |
| D | 0 | 12937 | 2 |
| Quadrant | Total seconds | Saturated seconds | Saturation percentage |
|---|---|---|---|
| A | 5202 | 6 | 0.115340% |
| B | 5202 | 65 | 1.249519% |
| C | 5202 | 110 | 2.114571% |
| D | 5202 | 140 | 2.691273% |
Noise dominated data is calculated using 1-second bins in cleaned event files. If a bin has >2000 counts, and if more than 50% of those come from <1% of pixels, then it is considered to be noise-dominated and hence unusable.
| Quadrant | # 1 sec bins | Bins with >0 counts | Bins with >2000 counts | High rate bins dominated by noise | Noise dominated (total time) | Noise dominated (detector-on time) | Marked lightcurve |
|---|---|---|---|---|---|---|---|
| A | 7205 | 5203 | 0 | 0 | 0.00% | 0.00% | 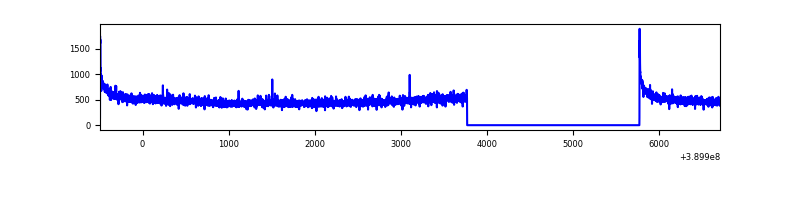 |
| B | 7205 | 5203 | 43 | 43 | 0.60% | 0.83% | 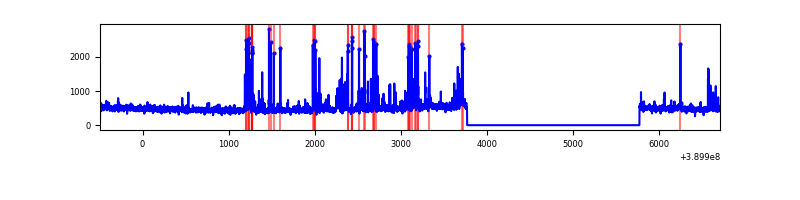 |
| C | 7205 | 5203 | 100 | 100 | 1.39% | 1.92% | 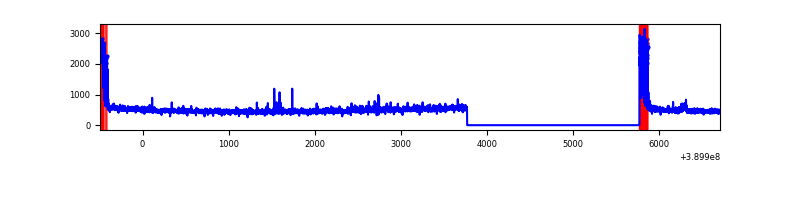 |
| D | 7205 | 5203 | 122 | 122 | 1.69% | 2.34% | 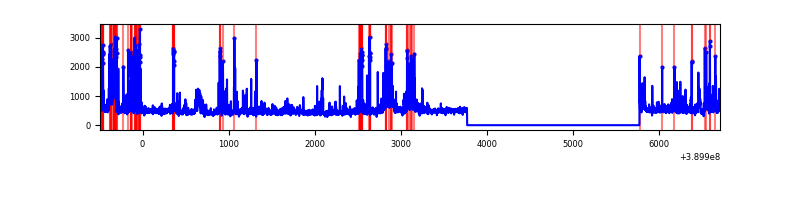 |
Top three noisy pixels from each quadrant. If the there are fewer than three noisy pixels in the level2.evt file, extra rows are filled as -1
| Pixel properties | Quadrant properties | ||||||
|---|---|---|---|---|---|---|---|
| Quadrant | DetID | PixID | Counts | Sigma | Mean | Median | Sigma |
| A | 10 | 83 | 159377 | 1298.39 | 608 | 599 | 122.3 |
| A | 13 | 6 | 15007 | 117.82 | 608 | 599 | 122.3 |
| A | 13 | 254 | 6278 | 46.44 | 608 | 599 | 122.3 |
| B | 5 | 172 | 153818 | 1335.94 | 600 | 587 | 114.7 |
| B | 5 | 255 | 91232 | 790.28 | 600 | 587 | 114.7 |
| B | 4 | 81 | 79017 | 683.79 | 600 | 587 | 114.7 |
| C | 0 | 10 | 286630 | 2153.78 | 571 | 577 | 132.8 |
| C | 15 | 214 | 217093 | 1630.22 | 571 | 577 | 132.8 |
| C | 9 | 187 | 38875 | 288.36 | 571 | 577 | 132.8 |
| D | 13 | 249 | 267366 | 1883.69 | 577 | 561 | 141.6 |
| D | 10 | 118 | 222646 | 1567.96 | 577 | 561 | 141.6 |
| D | 7 | 223 | 104021 | 730.45 | 577 | 561 | 141.6 |
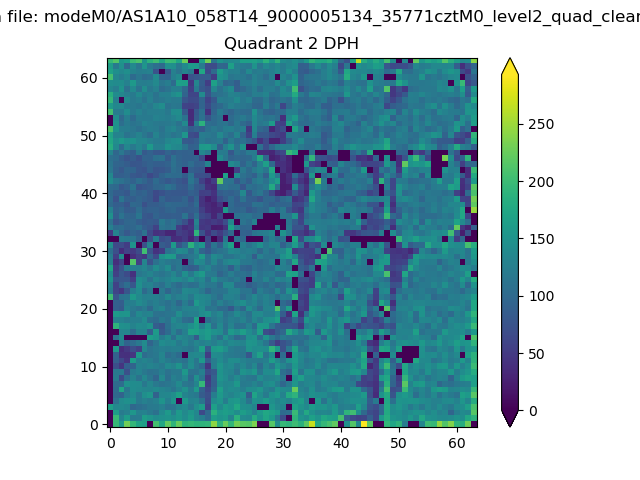
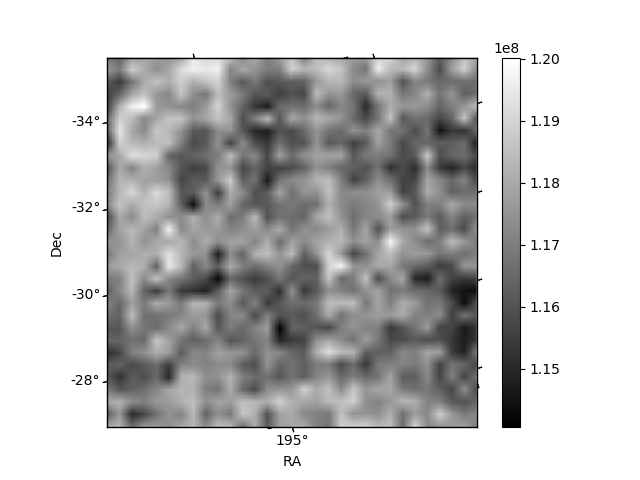
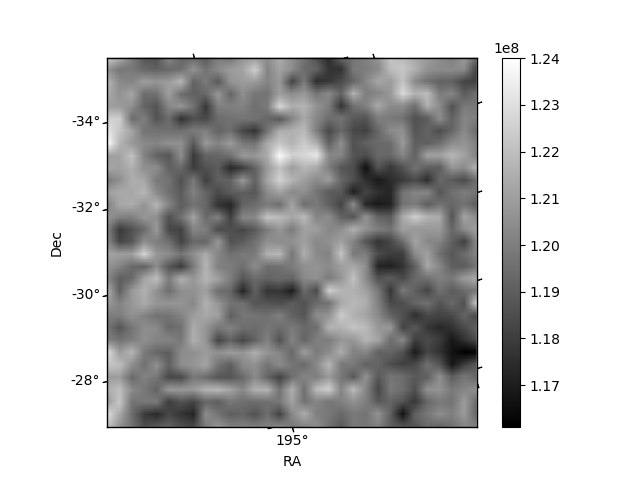
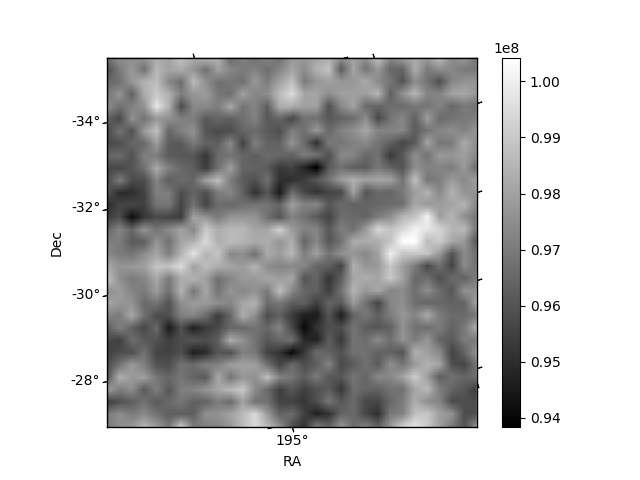
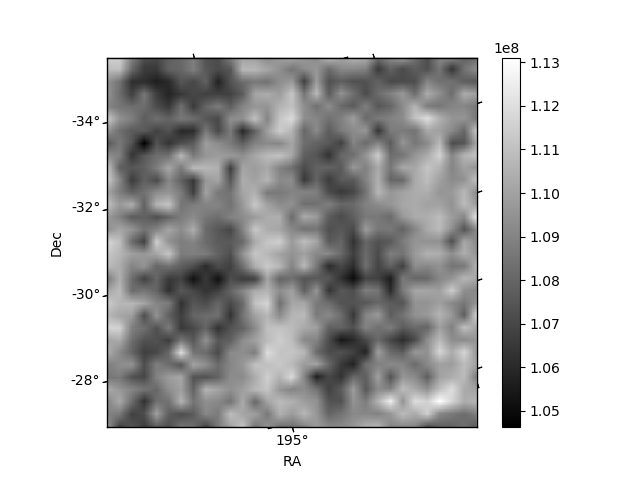
Histogram calculated using DETX and DETY for each event in the final _common_clean file
| Quadrant A | 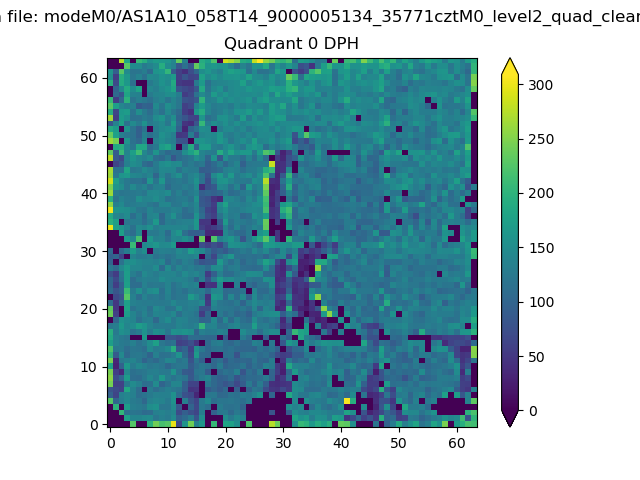 |
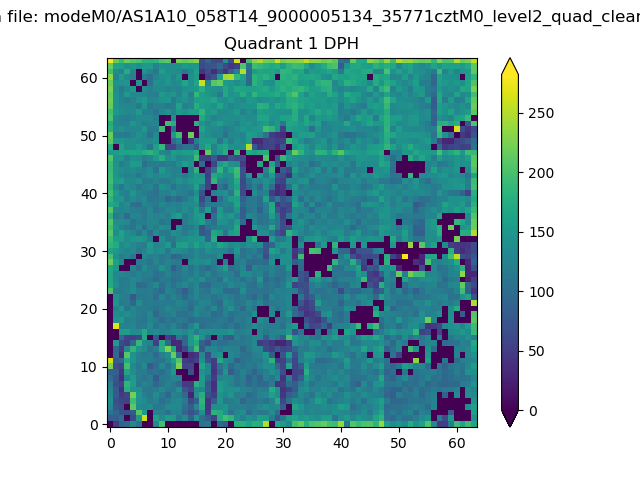 |
Quadrant B |
|---|---|---|---|
| Quadrant D | 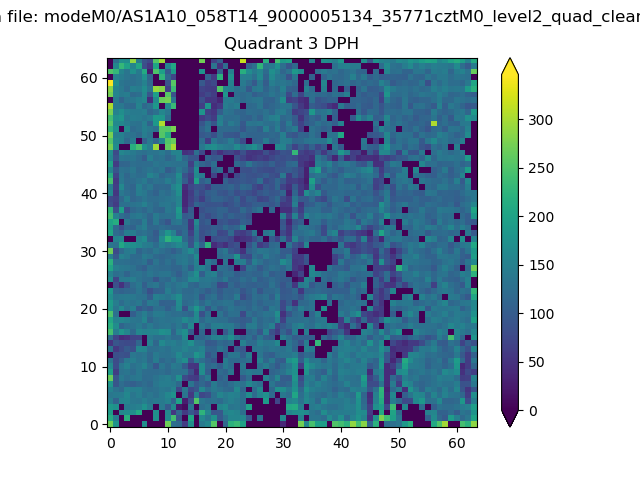 |
 |
Quadrant C |
| Plot type | Count rate plots | Images |
|---|---|---|
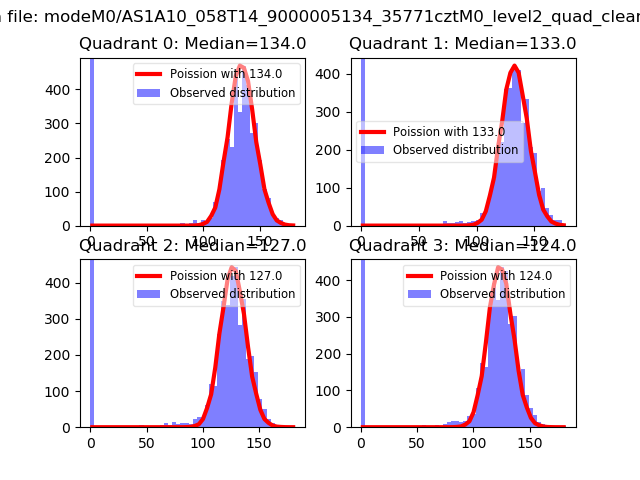
| Comparison with Poisson distribution Blue bars denote a histogram of data divided into 1 sec bins. Red curve is a Poisson curve with rate = median count rate of data. |
 |
 |
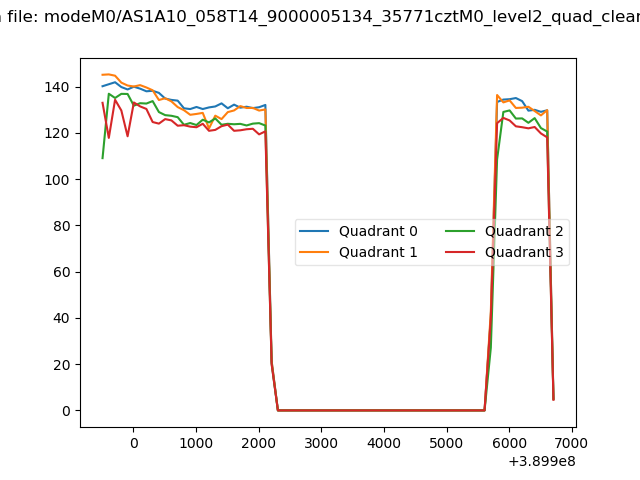
| Quadrant-wise count rates Data is divided into 100 sec bins |
 |
|
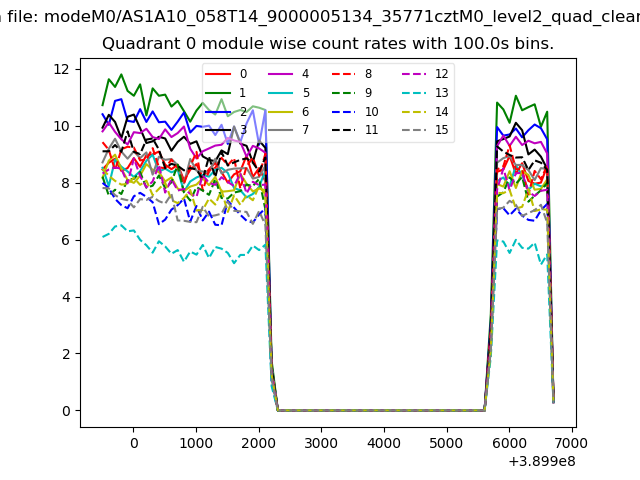
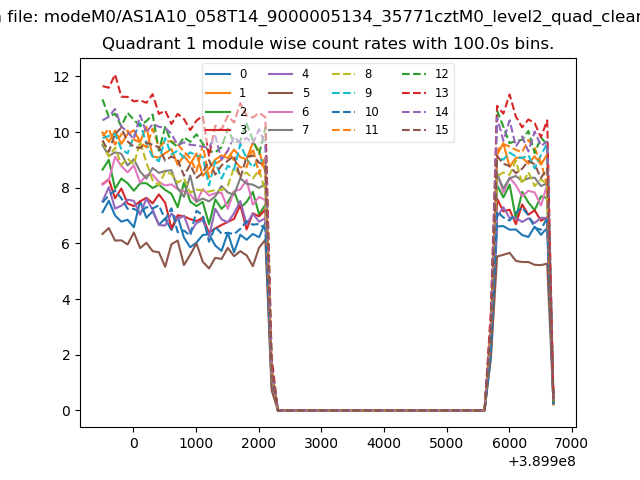
| Module-wise count rates for Quadrant A Data is divided into 100 sec bins |
 |
 |
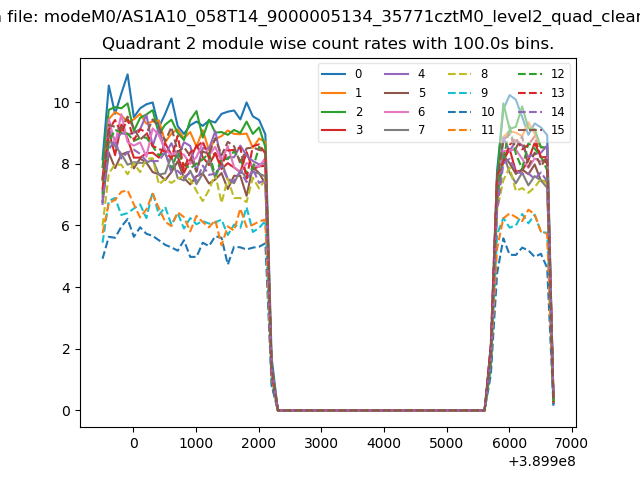
| Module-wise count rates for Quadrant B Data is divided into 100 sec bins |
 |
 |
| Module-wise count rates for Quadrant C Data is divided into 100 sec bins |
 |
 |
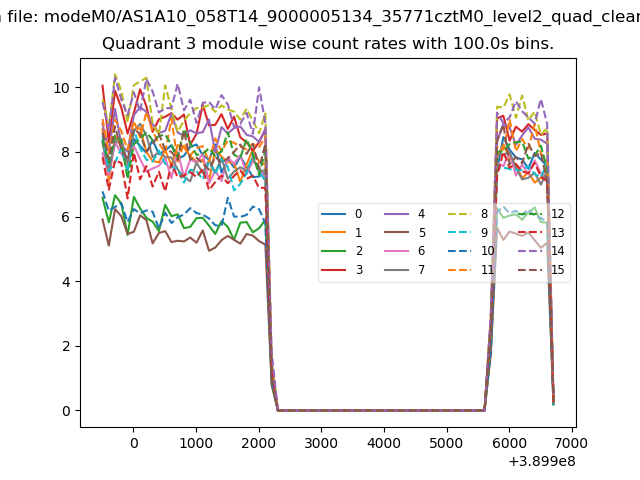
| Module-wise count rates for Quadrant D Data is divided into 100 sec bins |
 |
 |
| Parameter | Plot |
|---|---|
| CZT HV Monitor | 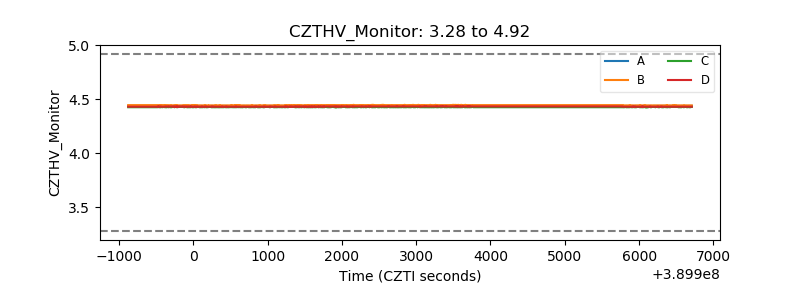 |
| D_VDD | 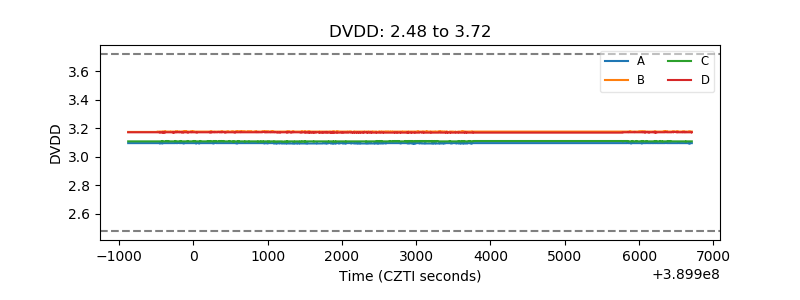 |
| Temperature 1 | 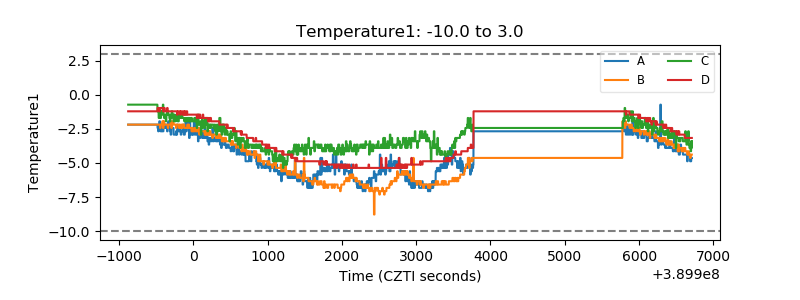 |
| Veto HV Monitor | 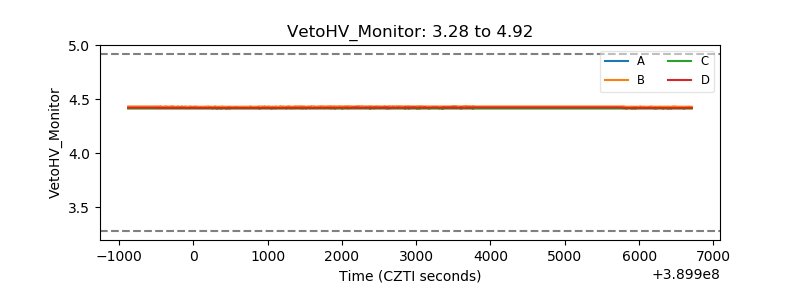 |
| Veto LLD | 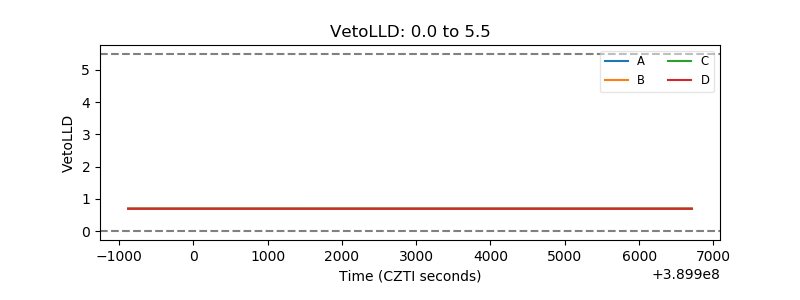 |
| Alpha Counter | 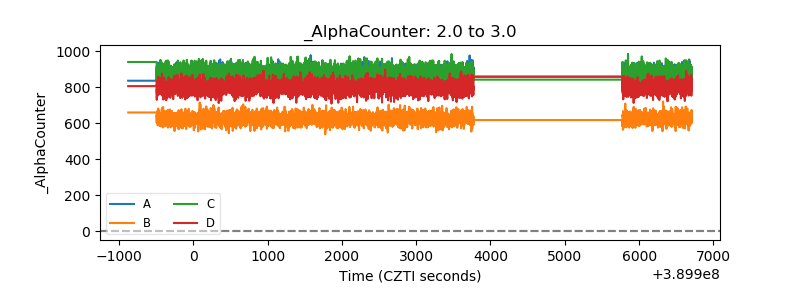 |
| _CPM_Rate | 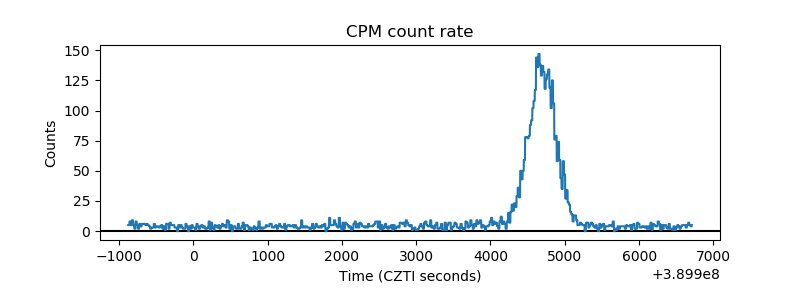 |
| CZT Counter | 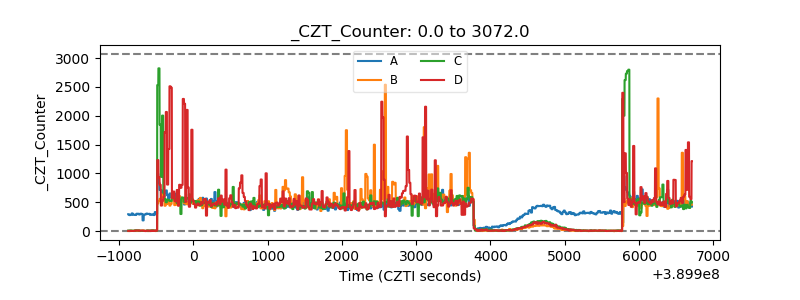 |
| +2.5 Volts monitor | 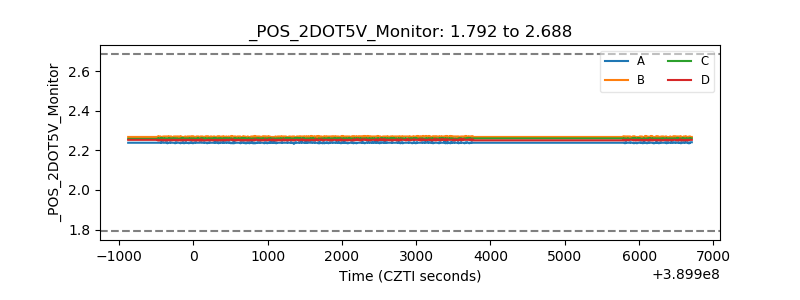 |
| +5 Volts monitor | 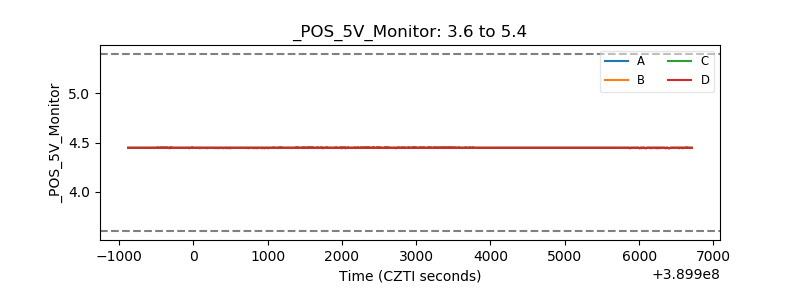 |
| _ROLL_ROT | 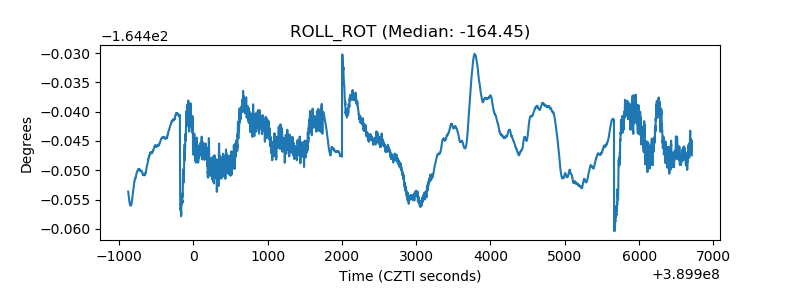 |
| _Roll_DEC | 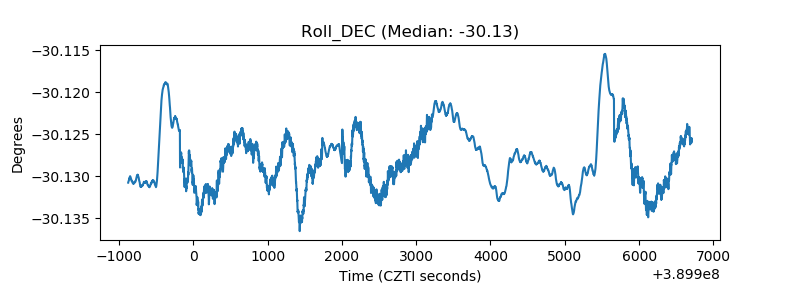 |
| _Roll_RA | 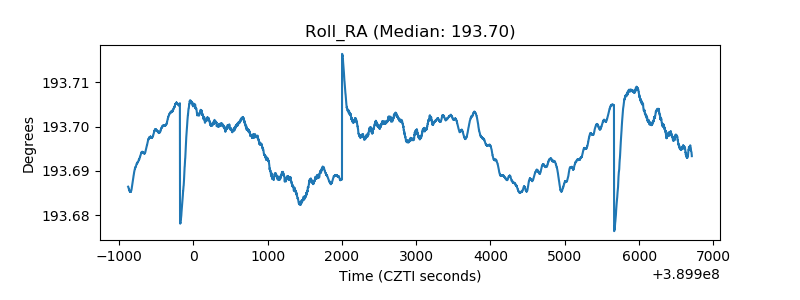 |
| Veto Counter | 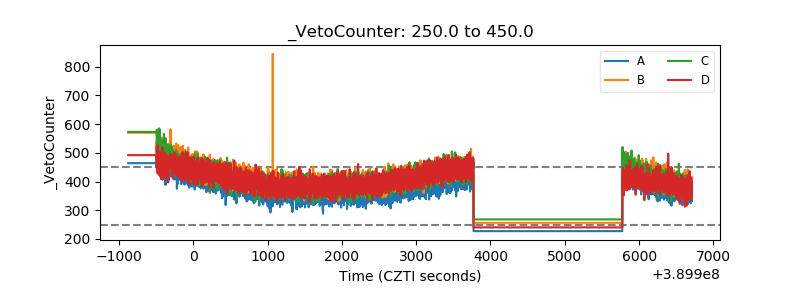 |