| Param | Original file | Final file |
|---|---|---|
| Filename | modeM0/AS1A10_058T14_9000005134_35769cztM0_level2.evt | modeM0/AS1A10_058T14_9000005134_35769cztM0_level2_quad_clean.evt |
| Size (bytes) | 413,801,280 | 96,621,120 |
| Size | 394.6 MB | 92.1 MB |
| Events in quadrant A | 2,668,965 | 668,284 |
| Events in quadrant B | 3,016,364 | 664,497 |
| Events in quadrant C | 2,799,964 | 636,130 |
| Events in quadrant D | 3,710,611 | 610,094 |
| Mode SS | |||
|---|---|---|---|
| Quadrant | BADHDUFLAG | Total packets | Discarded packets |
| A | 0 | 100 | 0 |
| B | 0 | 100 | 0 |
| C | 0 | 100 | 0 |
| D | 0 | 100 | 0 |
| Mode M9 | |||
|---|---|---|---|
| Quadrant | BADHDUFLAG | Total packets | Discarded packets |
| A | 0 | 22 | 0 |
| B | 0 | 22 | 0 |
| C | 0 | 22 | 0 |
| D | 0 | 22 | 0 |
| Mode M0 | |||
|---|---|---|---|
| Quadrant | BADHDUFLAG | Total packets | Discarded packets |
| A | 0 | 10924 | 3 |
| B | 0 | 11971 | 2 |
| C | 0 | 11240 | 2 |
| D | 0 | 14239 | 2 |
| Quadrant | Total seconds | Saturated seconds | Saturation percentage |
|---|---|---|---|
| A | 4954 | 7 | 0.141300% |
| B | 4954 | 84 | 1.695600% |
| C | 4954 | 48 | 0.968914% |
| D | 4955 | 156 | 3.148335% |
Noise dominated data is calculated using 1-second bins in cleaned event files. If a bin has >2000 counts, and if more than 50% of those come from <1% of pixels, then it is considered to be noise-dominated and hence unusable.
| Quadrant | # 1 sec bins | Bins with >0 counts | Bins with >2000 counts | High rate bins dominated by noise | Noise dominated (total time) | Noise dominated (detector-on time) | Marked lightcurve |
|---|---|---|---|---|---|---|---|
| A | 7077 | 4955 | 0 | 0 | 0.00% | 0.00% | 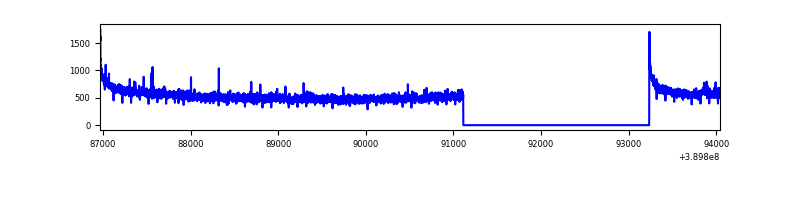 |
| B | 7077 | 4955 | 56 | 56 | 0.79% | 1.13% | 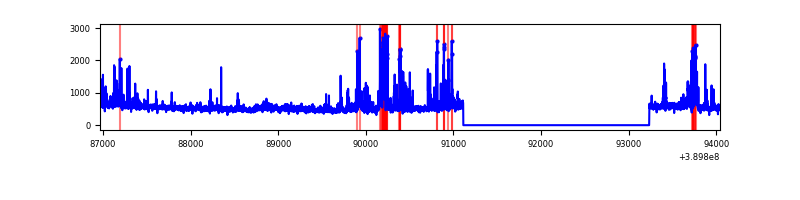 |
| C | 7077 | 4955 | 42 | 42 | 0.59% | 0.85% | 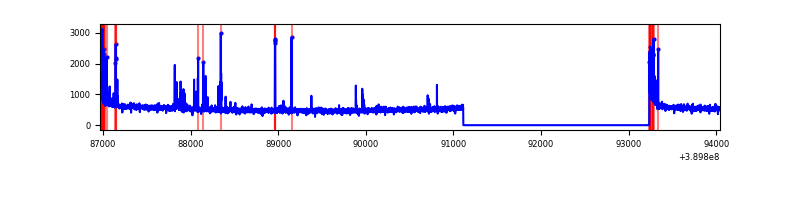 |
| D | 7078 | 4956 | 199 | 199 | 2.81% | 4.02% | 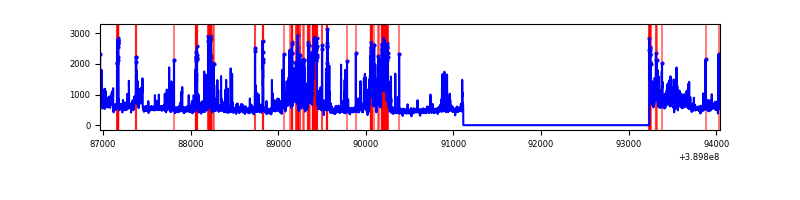 |
Top three noisy pixels from each quadrant. If the there are fewer than three noisy pixels in the level2.evt file, extra rows are filled as -1
| Pixel properties | Quadrant properties | ||||||
|---|---|---|---|---|---|---|---|
| Quadrant | DetID | PixID | Counts | Sigma | Mean | Median | Sigma |
| A | 10 | 83 | 151867 | 1173.73 | 641 | 632 | 128.8 |
| A | 15 | 169 | 28147 | 213.54 | 641 | 632 | 128.8 |
| A | 13 | 6 | 7679 | 54.69 | 641 | 632 | 128.8 |
| B | 5 | 172 | 234304 | 1997.13 | 624 | 613 | 117.0 |
| B | 5 | 255 | 190716 | 1624.63 | 624 | 613 | 117.0 |
| B | 4 | 232 | 27691 | 231.41 | 624 | 613 | 117.0 |
| C | 15 | 214 | 209450 | 1513.07 | 599 | 605 | 138.0 |
| C | 0 | 10 | 136265 | 982.85 | 599 | 605 | 138.0 |
| C | 9 | 187 | 59615 | 427.52 | 599 | 605 | 138.0 |
| D | 1 | 52 | 865586 | 5869.17 | 607 | 592 | 147.4 |
| D | 13 | 249 | 146899 | 992.73 | 607 | 592 | 147.4 |
| D | 8 | 195 | 90863 | 612.51 | 607 | 592 | 147.4 |
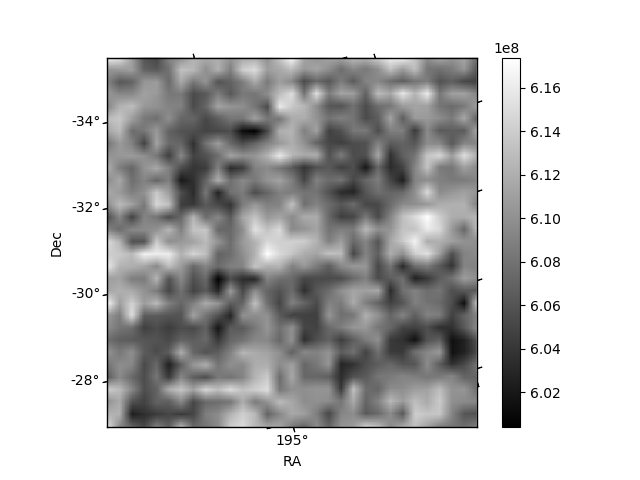
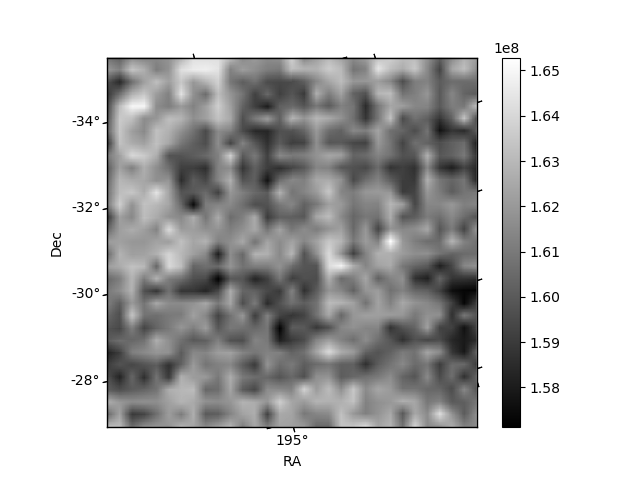
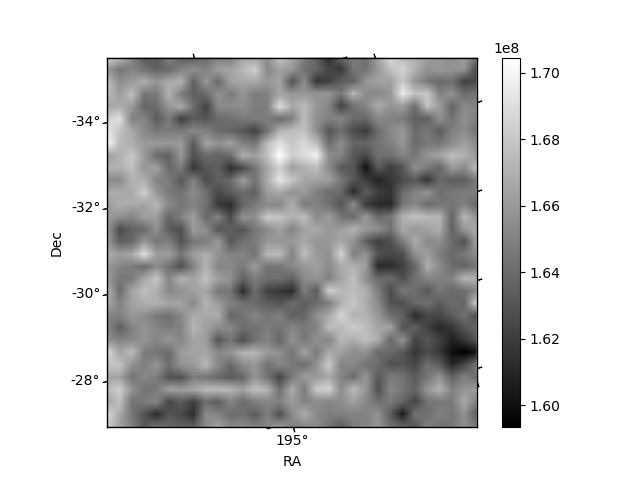
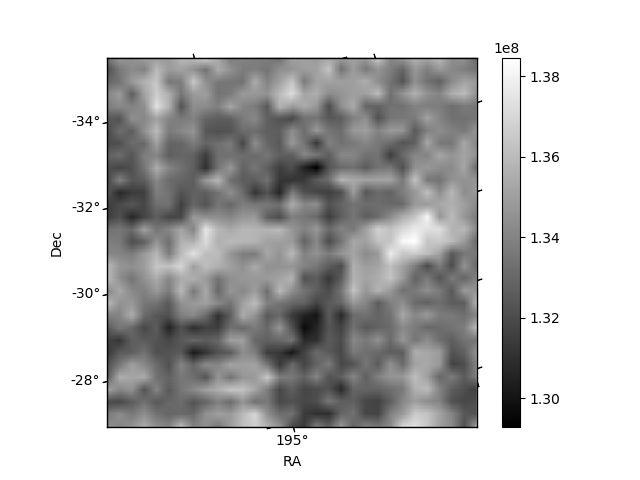
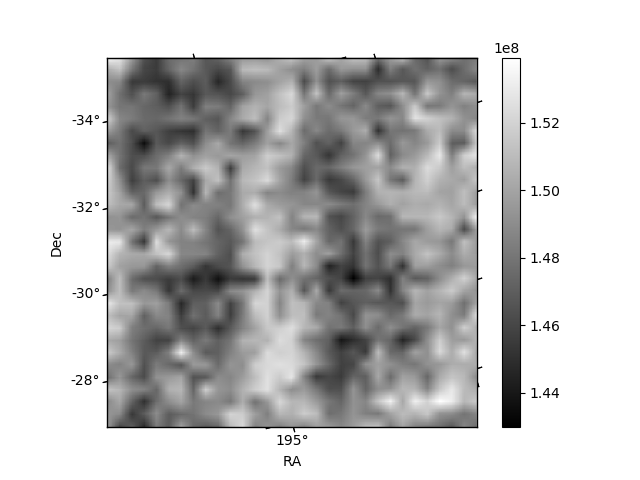
Histogram calculated using DETX and DETY for each event in the final _common_clean file
| Quadrant A | 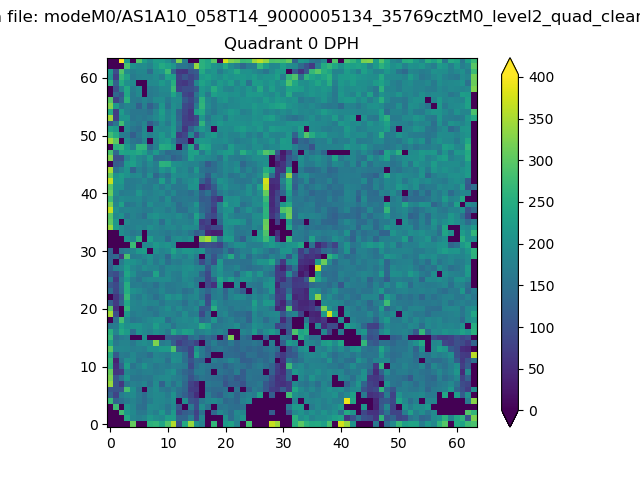 |
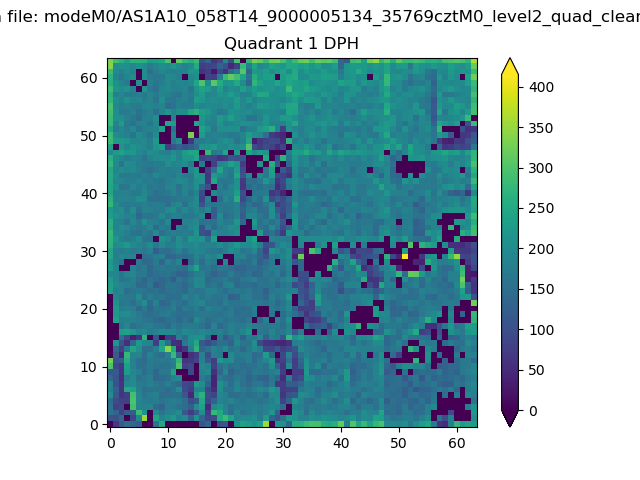 |
Quadrant B |
|---|---|---|---|
| Quadrant D | 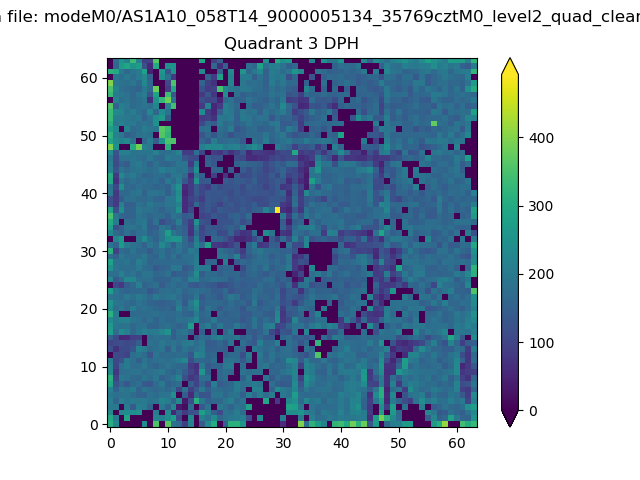 |
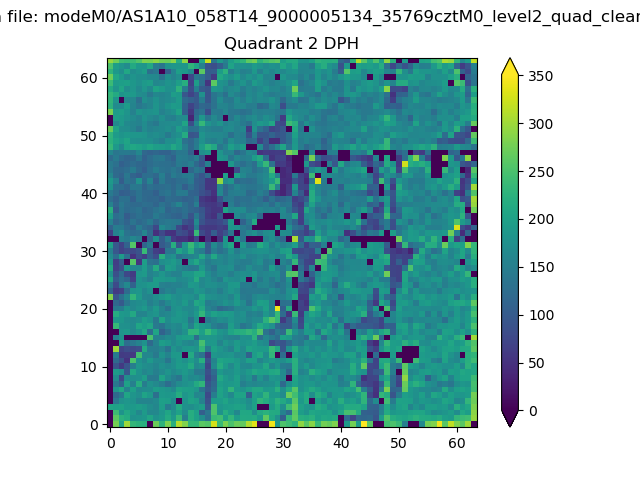 |
Quadrant C |
| Plot type | Count rate plots | Images |
|---|---|---|
| Comparison with Poisson distribution Blue bars denote a histogram of data divided into 1 sec bins. Red curve is a Poisson curve with rate = median count rate of data. |
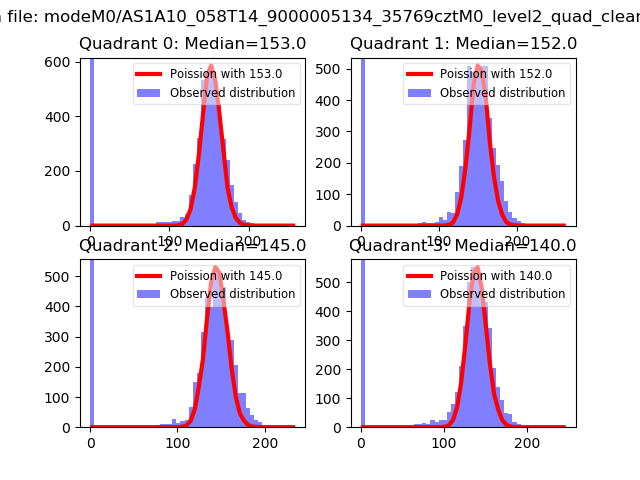 |
 |
| Quadrant-wise count rates Data is divided into 100 sec bins |
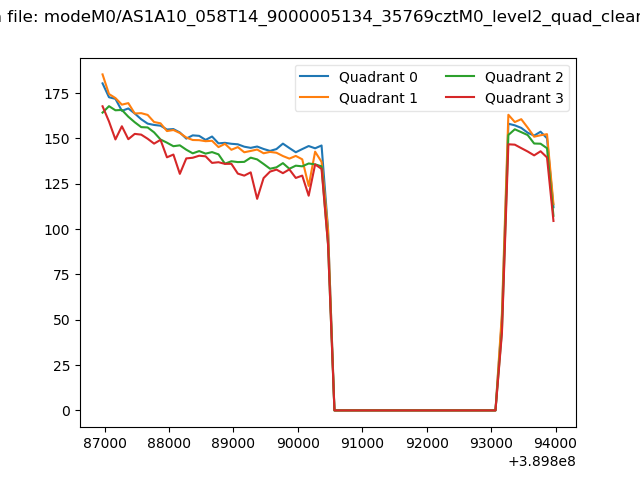 |
|
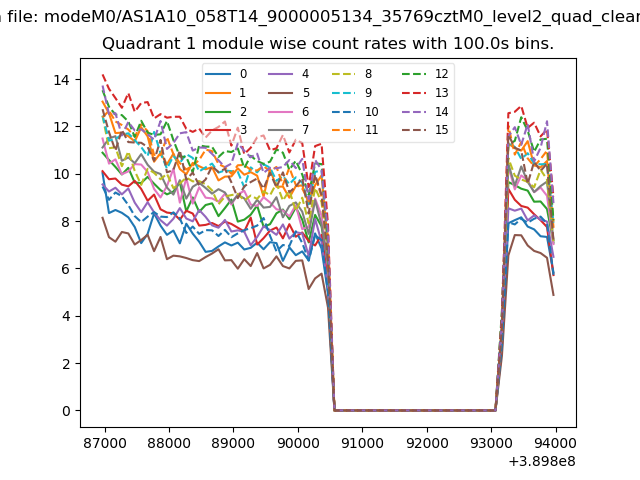
| Module-wise count rates for Quadrant A Data is divided into 100 sec bins |
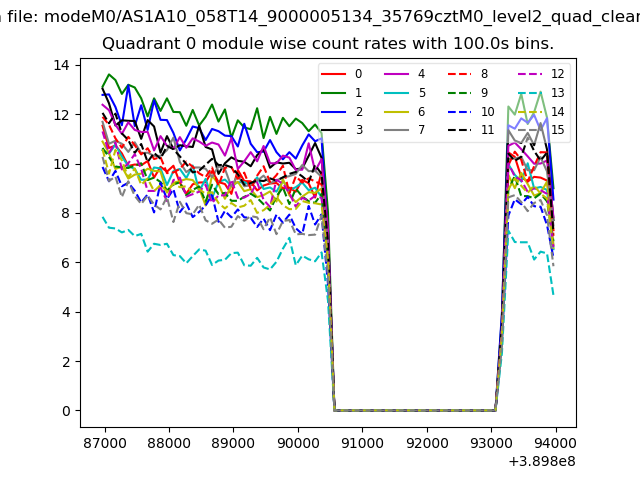 |
 |
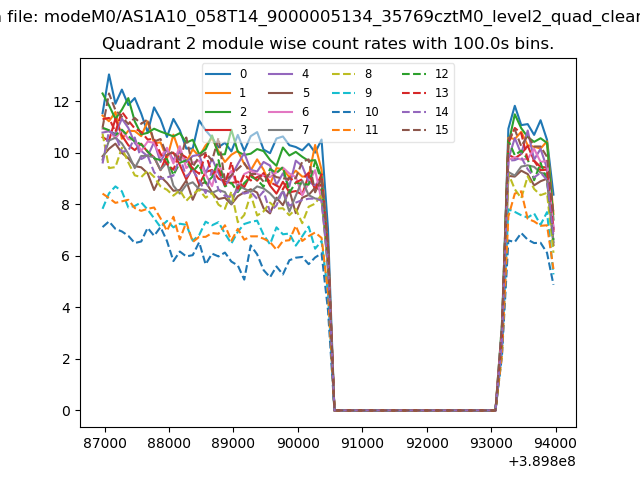
| Module-wise count rates for Quadrant B Data is divided into 100 sec bins |
 |
 |
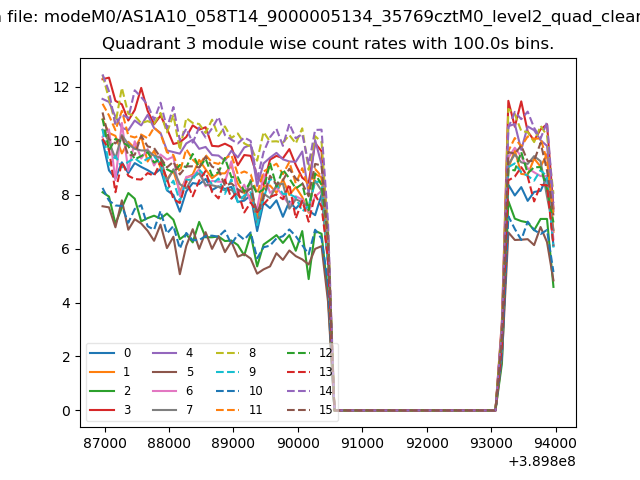
| Module-wise count rates for Quadrant C Data is divided into 100 sec bins |
 |
 |
| Module-wise count rates for Quadrant D Data is divided into 100 sec bins |
 |
 |
| Parameter | Plot |
|---|---|
| CZT HV Monitor | 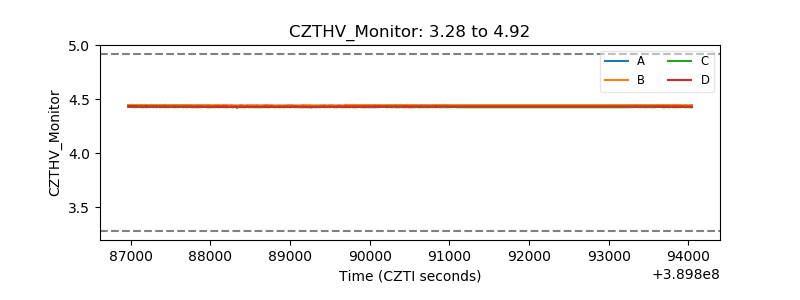 |
| D_VDD | 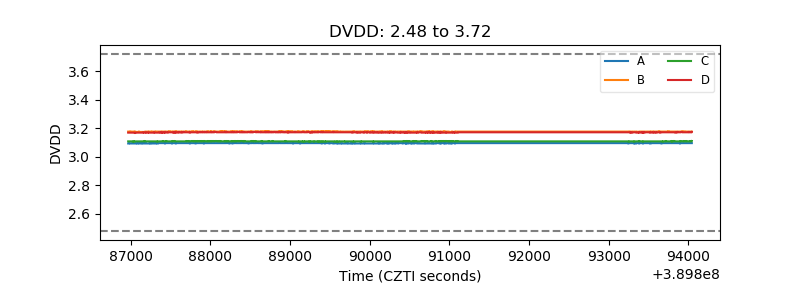 |
| Temperature 1 | 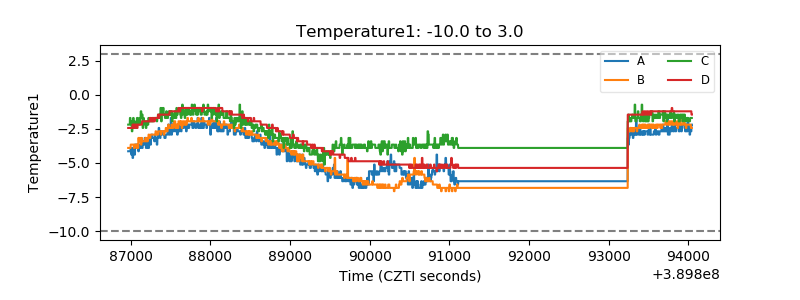 |
| Veto HV Monitor | 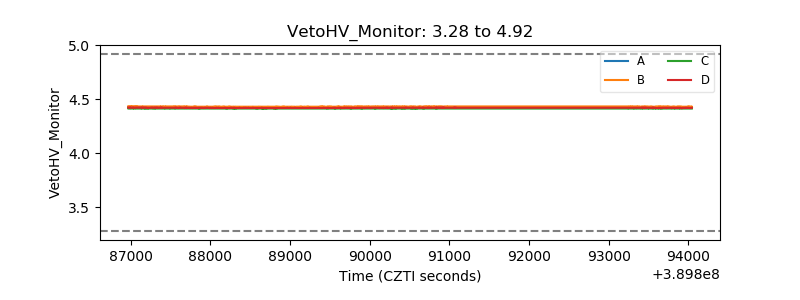 |
| Veto LLD |  |
| Alpha Counter | 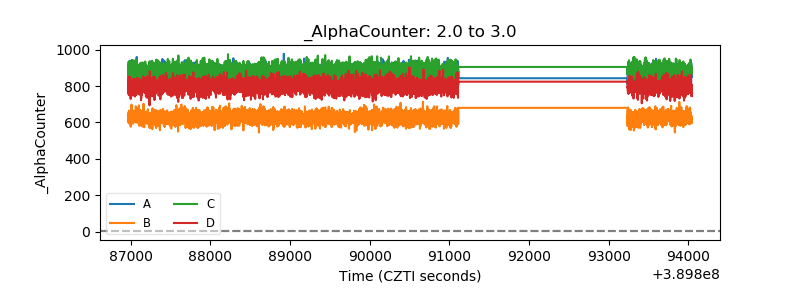 |
| _CPM_Rate | 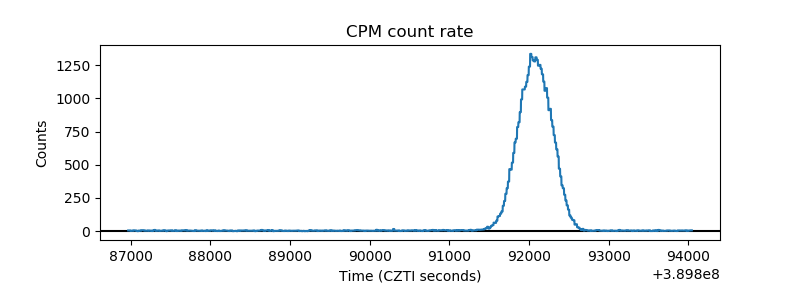 |
| CZT Counter | 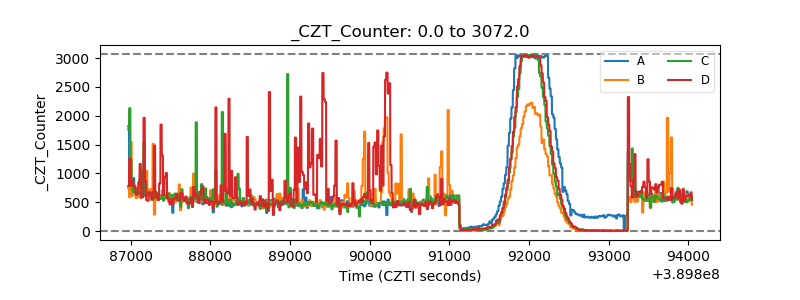 |
| +2.5 Volts monitor | 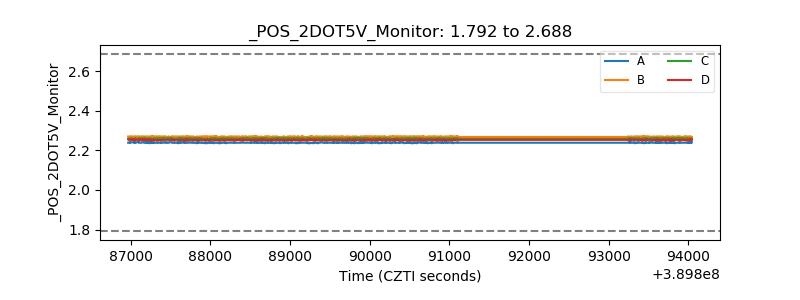 |
| +5 Volts monitor | 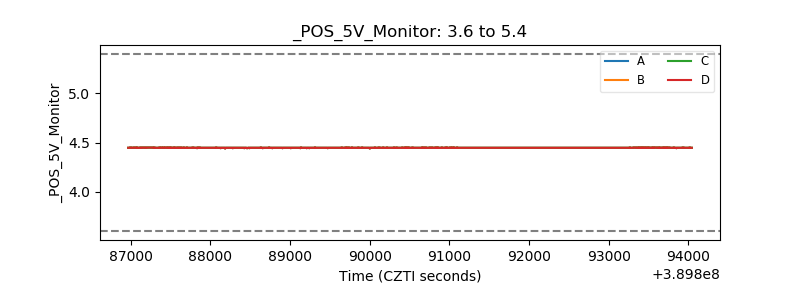 |
| _ROLL_ROT | 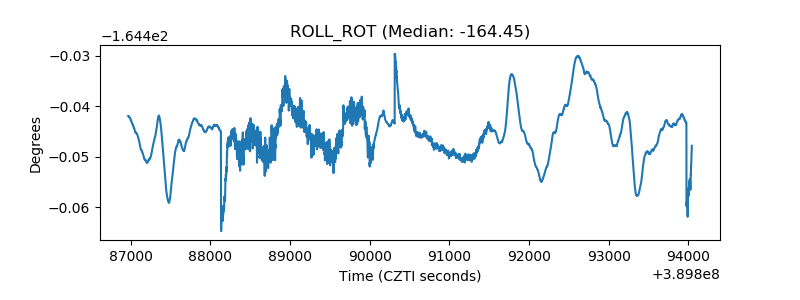 |
| _Roll_DEC | 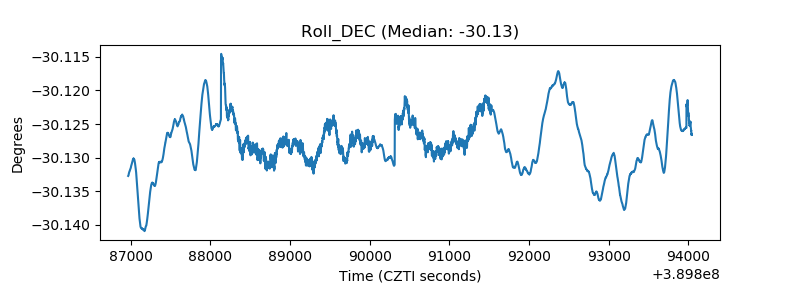 |
| _Roll_RA | 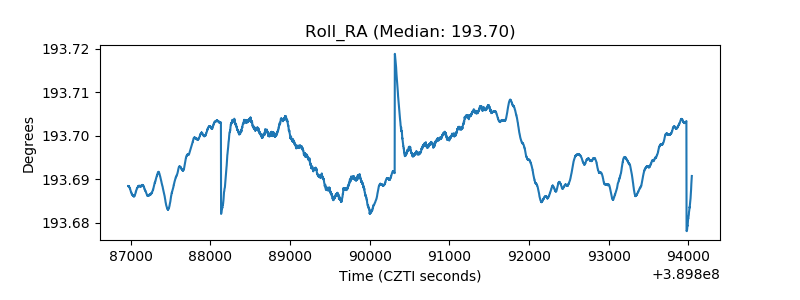 |
| Veto Counter | 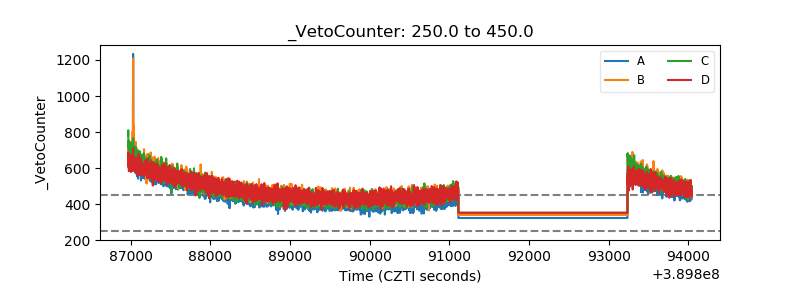 |