| Param | Original file | Final file |
|---|---|---|
| Filename | modeM0/AS1A10_058T14_9000005134_35767cztM0_level2.evt | modeM0/AS1A10_058T14_9000005134_35767cztM0_level2_quad_clean.evt |
| Size (bytes) | 485,176,320 | 89,527,680 |
| Size | 462.7 MB | 85.4 MB |
| Events in quadrant A | 2,764,915 | 607,311 |
| Events in quadrant B | 3,057,069 | 609,780 |
| Events in quadrant C | 3,078,653 | 593,195 |
| Events in quadrant D | 5,442,771 | 538,885 |
| Mode SS | |||
|---|---|---|---|
| Quadrant | BADHDUFLAG | Total packets | Discarded packets |
| A | 0 | 106 | 0 |
| B | 0 | 106 | 0 |
| C | 0 | 106 | 0 |
| D | 0 | 106 | 0 |
| Mode M9 | |||
|---|---|---|---|
| Quadrant | BADHDUFLAG | Total packets | Discarded packets |
| A | 0 | 34 | 0 |
| B | 0 | 34 | 0 |
| C | 0 | 34 | 0 |
| D | 0 | 35 | 0 |
| Mode M0 | |||
|---|---|---|---|
| Quadrant | BADHDUFLAG | Total packets | Discarded packets |
| A | 0 | 11373 | 3 |
| B | 0 | 12364 | 2 |
| C | 0 | 12322 | 2 |
| D | 0 | 19760 | 2 |
| Quadrant | Total seconds | Saturated seconds | Saturation percentage |
|---|---|---|---|
| A | 5163 | 9 | 0.174317% |
| B | 5163 | 86 | 1.665698% |
| C | 5163 | 133 | 2.576022% |
| D | 5163 | 545 | 10.555878% |
Noise dominated data is calculated using 1-second bins in cleaned event files. If a bin has >2000 counts, and if more than 50% of those come from <1% of pixels, then it is considered to be noise-dominated and hence unusable.
| Quadrant | # 1 sec bins | Bins with >0 counts | Bins with >2000 counts | High rate bins dominated by noise | Noise dominated (total time) | Noise dominated (detector-on time) | Marked lightcurve |
|---|---|---|---|---|---|---|---|
| A | 7106 | 5164 | 0 | 0 | 0.00% | 0.00% | 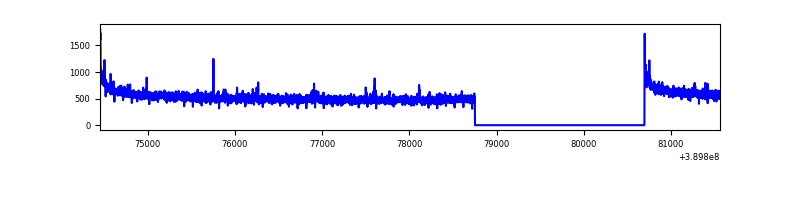 |
| B | 7106 | 5164 | 52 | 52 | 0.73% | 1.01% | 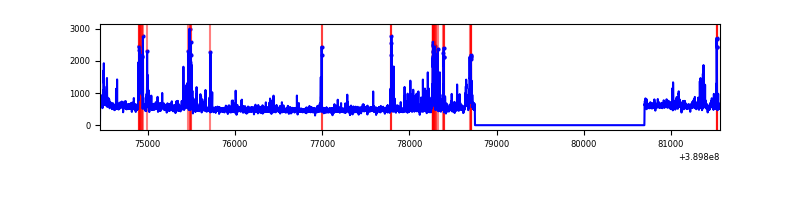 |
| C | 7106 | 5164 | 110 | 110 | 1.55% | 2.13% | 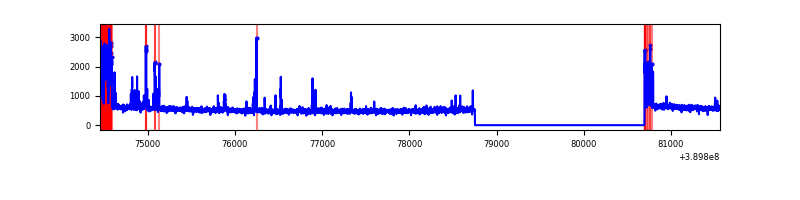 |
| D | 7106 | 5164 | 573 | 573 | 8.06% | 11.10% | 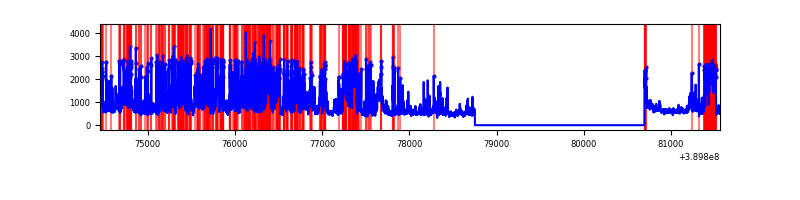 |
Top three noisy pixels from each quadrant. If the there are fewer than three noisy pixels in the level2.evt file, extra rows are filled as -1
| Pixel properties | Quadrant properties | ||||||
|---|---|---|---|---|---|---|---|
| Quadrant | DetID | PixID | Counts | Sigma | Mean | Median | Sigma |
| A | 10 | 83 | 156179 | 1160.17 | 668 | 659 | 134.0 |
| A | 7 | 191 | 11253 | 79.03 | 668 | 659 | 134.0 |
| A | 13 | 6 | 8148 | 55.87 | 668 | 659 | 134.0 |
| B | 5 | 172 | 233431 | 1894.27 | 654 | 640 | 122.9 |
| B | 4 | 232 | 89802 | 725.53 | 654 | 640 | 122.9 |
| B | 5 | 255 | 50192 | 403.22 | 654 | 640 | 122.9 |
| C | 1 | 23 | 267454 | 1856.28 | 628 | 634 | 143.7 |
| C | 15 | 214 | 215337 | 1493.7 | 628 | 634 | 143.7 |
| C | 0 | 10 | 121399 | 840.17 | 628 | 634 | 143.7 |
| D | 1 | 52 | 1399252 | 9321.61 | 622 | 606 | 150.0 |
| D | 14 | 52 | 788126 | 5248.62 | 622 | 606 | 150.0 |
| D | 10 | 118 | 381139 | 2536.15 | 622 | 606 | 150.0 |
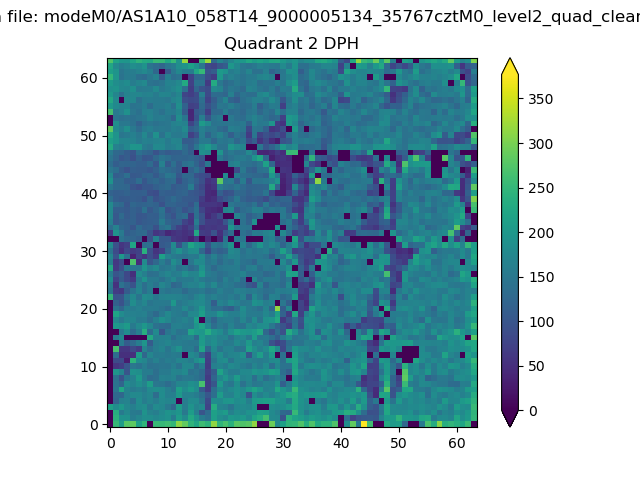
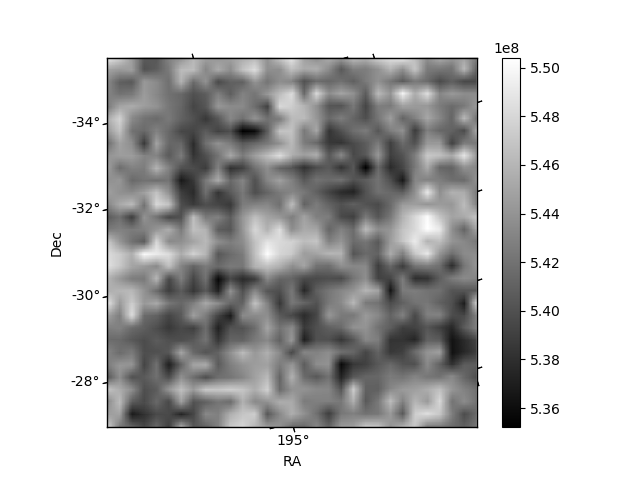
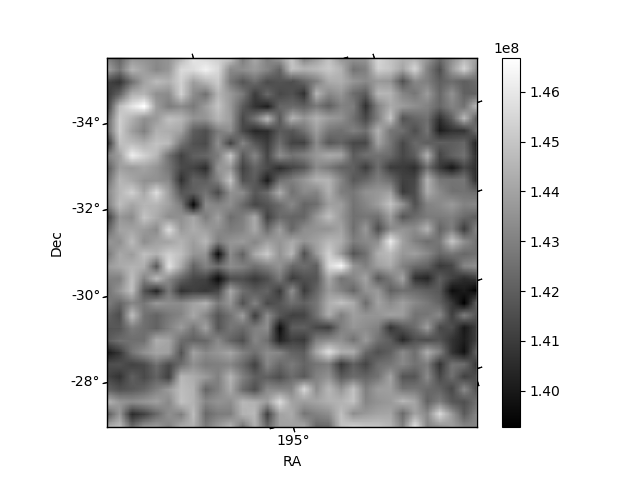
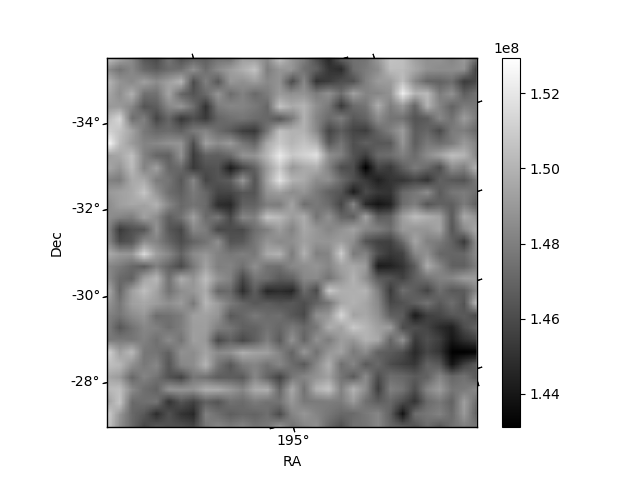
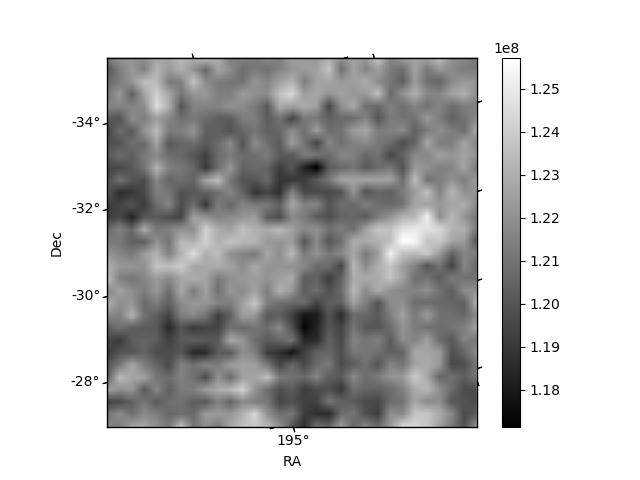
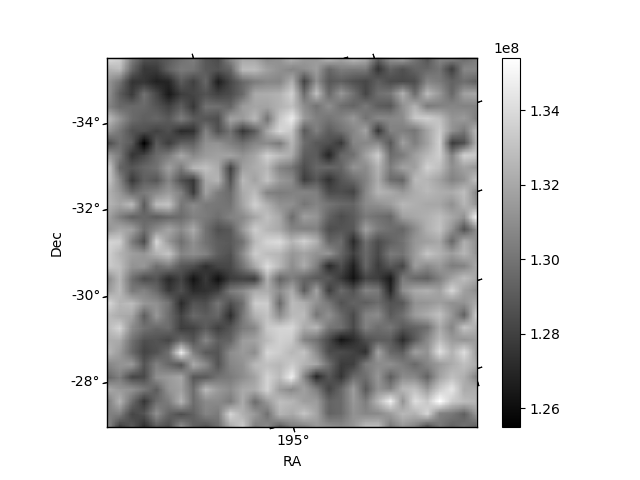
Histogram calculated using DETX and DETY for each event in the final _common_clean file
| Quadrant A | 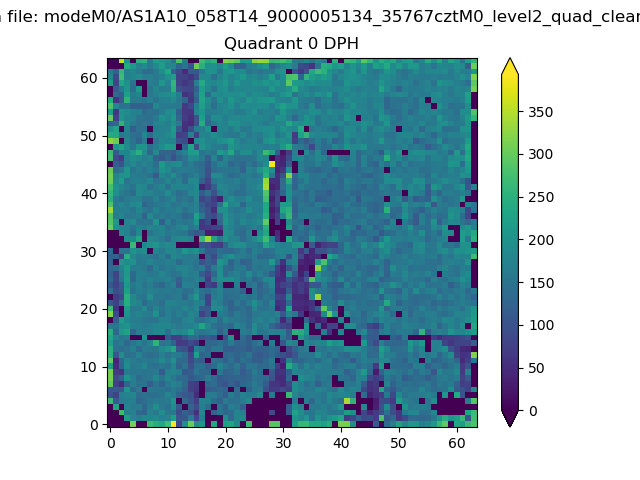 |
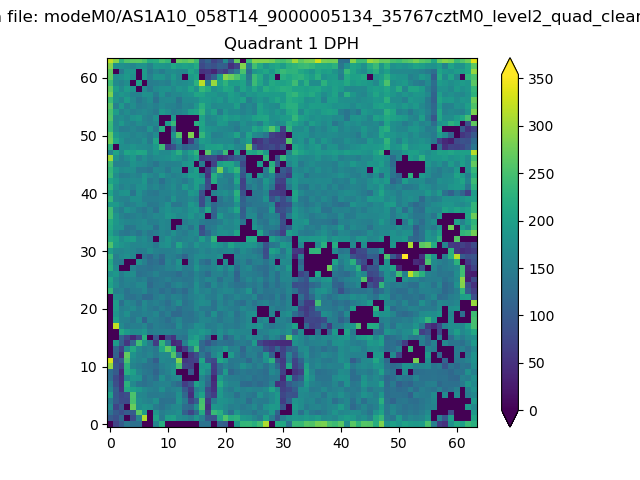 |
Quadrant B |
|---|---|---|---|
| Quadrant D | 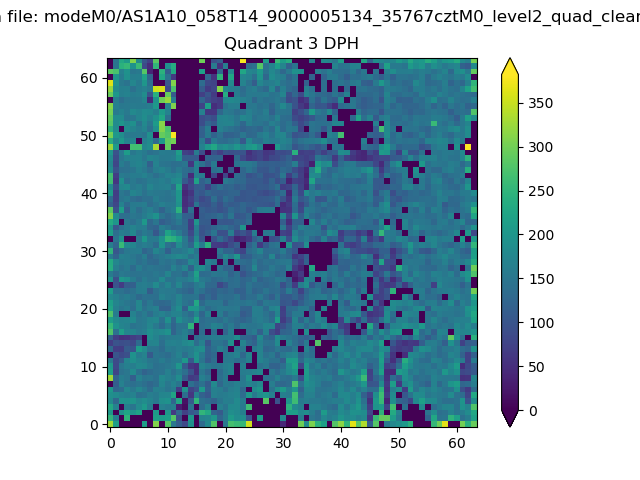 |
 |
Quadrant C |
| Plot type | Count rate plots | Images |
|---|---|---|
| Comparison with Poisson distribution Blue bars denote a histogram of data divided into 1 sec bins. Red curve is a Poisson curve with rate = median count rate of data. |
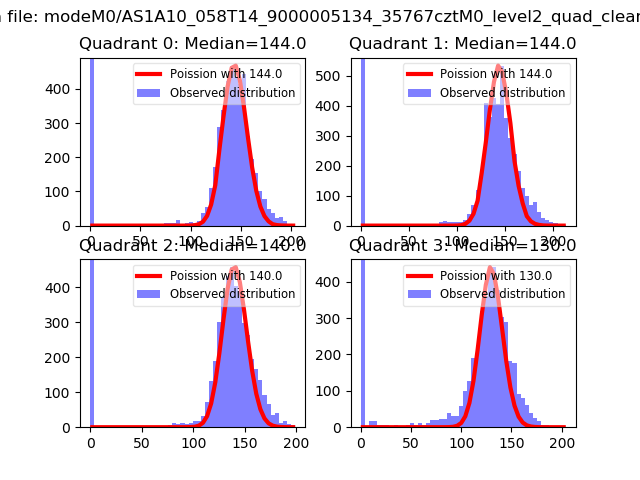 |
 |
| Quadrant-wise count rates Data is divided into 100 sec bins |
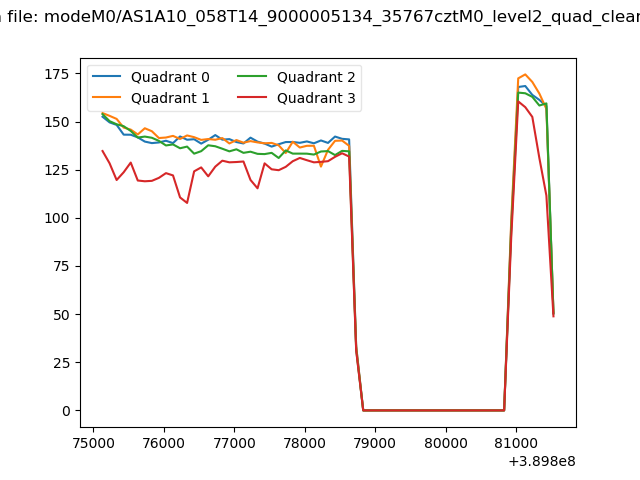 |
|
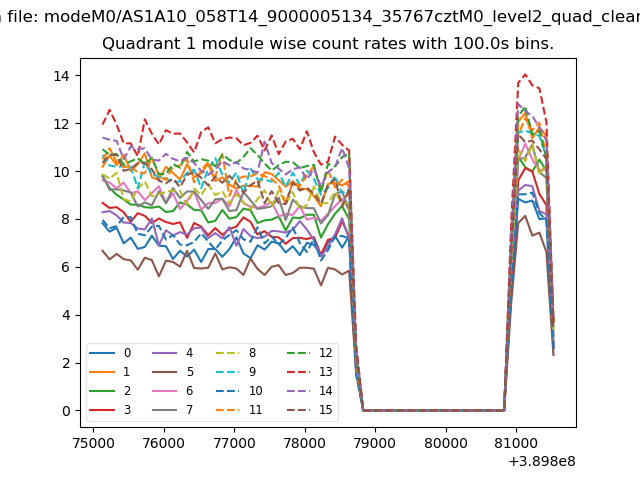
| Module-wise count rates for Quadrant A Data is divided into 100 sec bins |
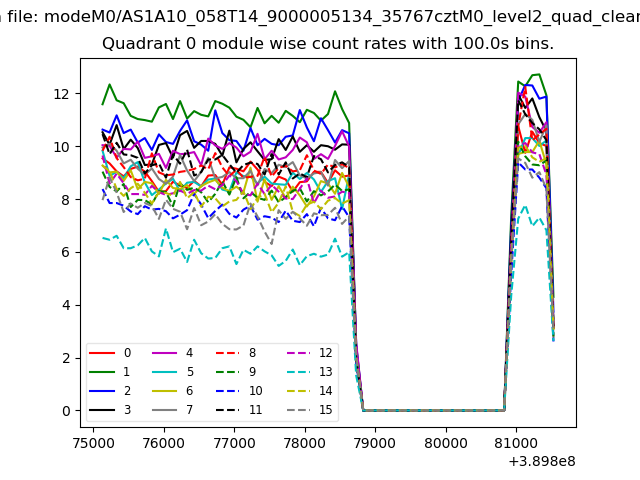 |
 |
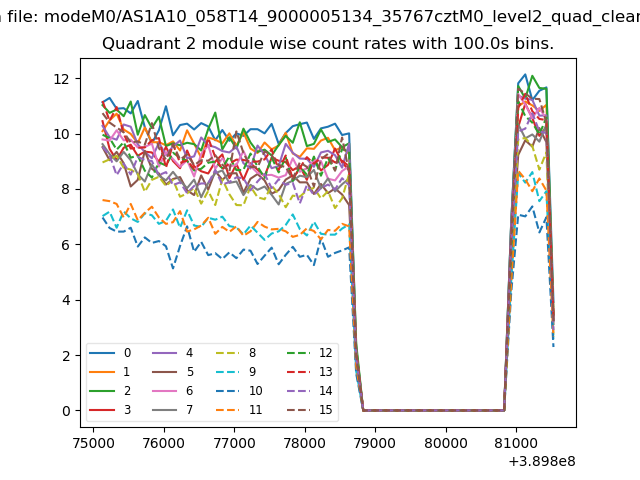
| Module-wise count rates for Quadrant B Data is divided into 100 sec bins |
 |
 |
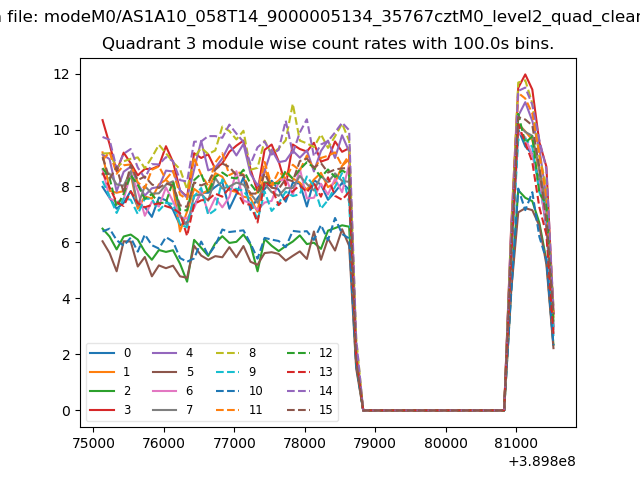
| Module-wise count rates for Quadrant C Data is divided into 100 sec bins |
 |
 |
| Module-wise count rates for Quadrant D Data is divided into 100 sec bins |
 |
 |
| Parameter | Plot |
|---|---|
| CZT HV Monitor | 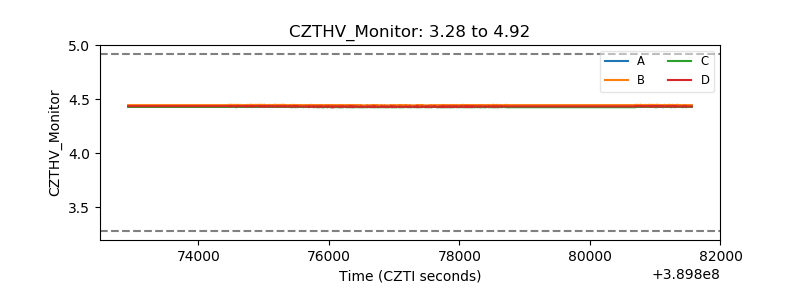 |
| D_VDD | 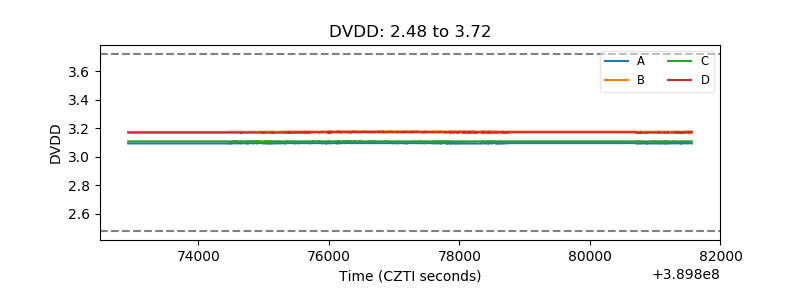 |
| Temperature 1 | 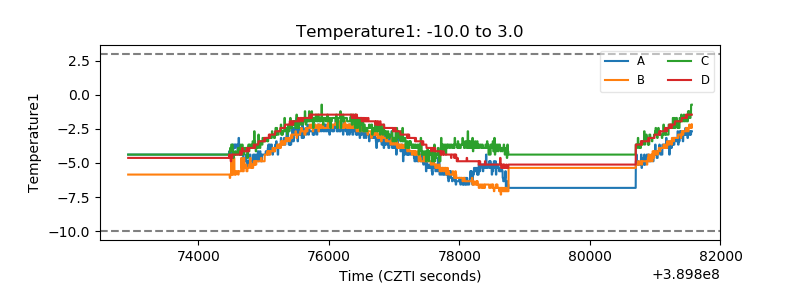 |
| Veto HV Monitor | 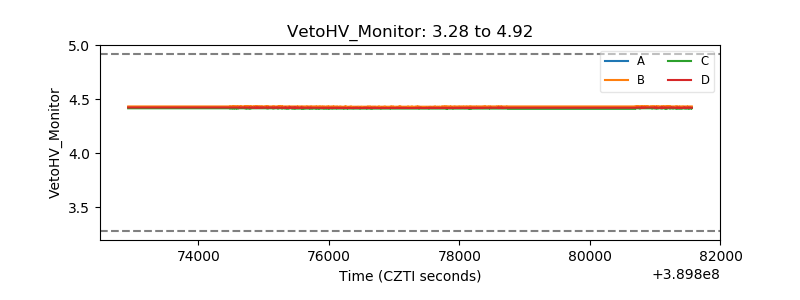 |
| Veto LLD | 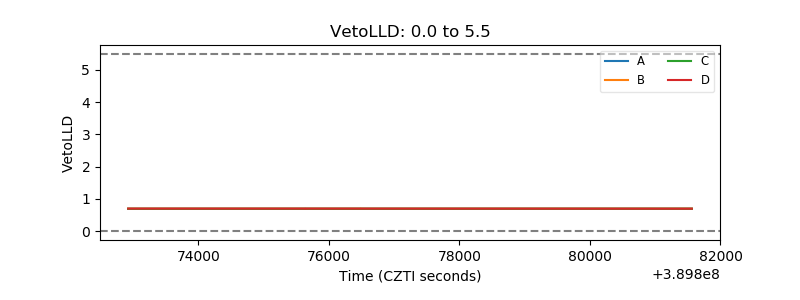 |
| Alpha Counter | 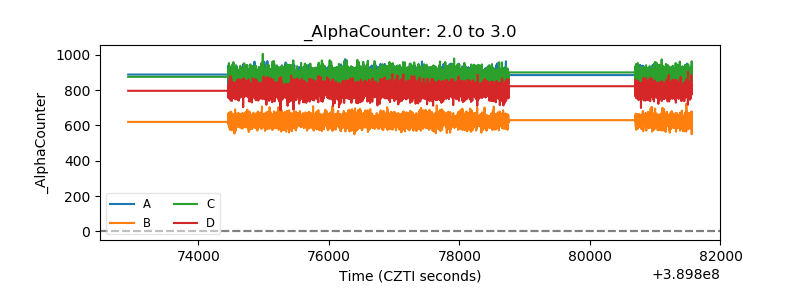 |
| _CPM_Rate | 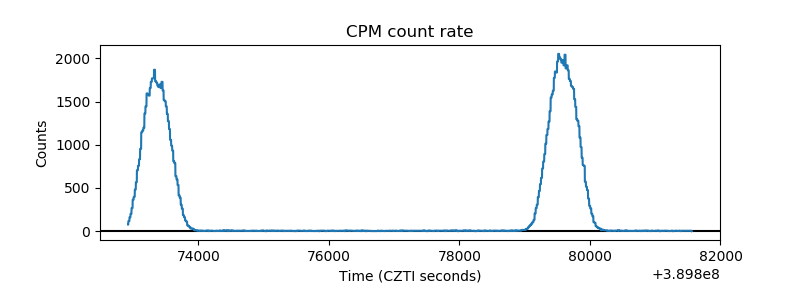 |
| CZT Counter | 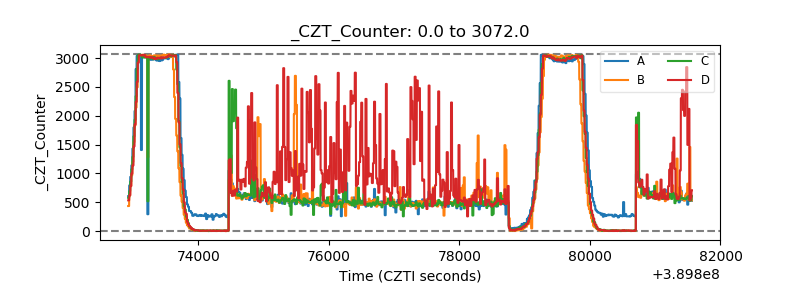 |
| +2.5 Volts monitor | 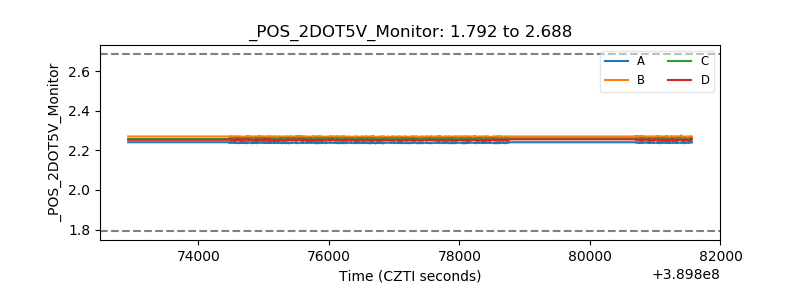 |
| +5 Volts monitor | 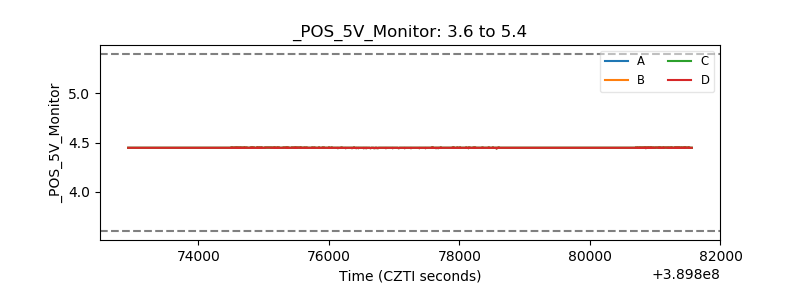 |
| _ROLL_ROT | 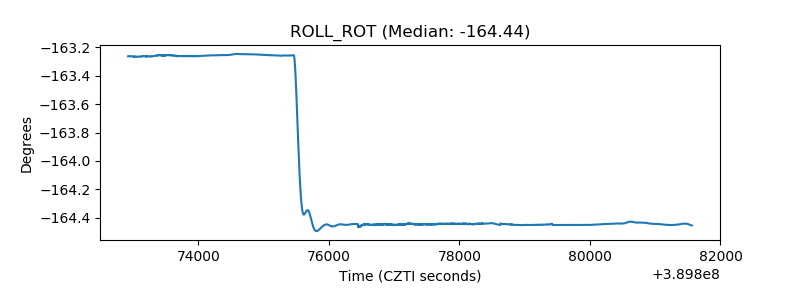 |
| _Roll_DEC | 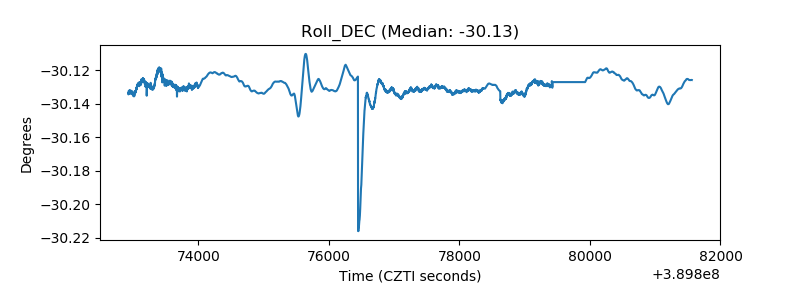 |
| _Roll_RA | 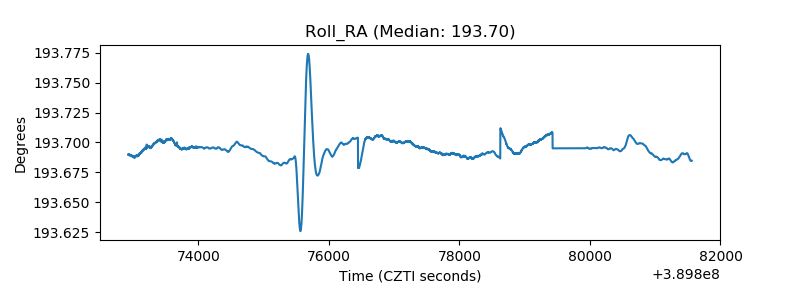 |
| Veto Counter | 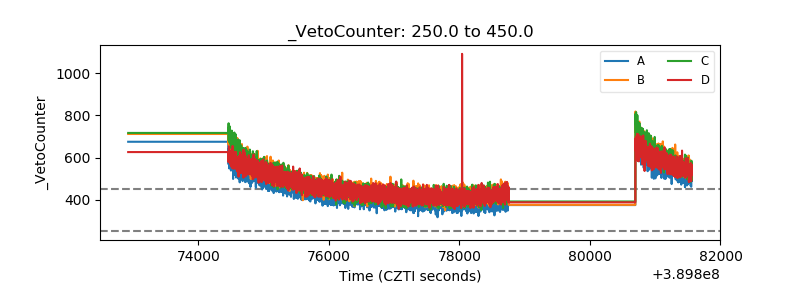 |