| Param | Original file | Final file |
|---|---|---|
| Filename | modeM0/AS1A10_058T14_9000005134_35766cztM0_level2.evt | modeM0/AS1A10_058T14_9000005134_35766cztM0_level2_quad_clean.evt |
| Size (bytes) | 484,081,920 | 76,423,680 |
| Size | 461.7 MB | 72.9 MB |
| Events in quadrant A | 2,849,177 | 496,834 |
| Events in quadrant B | 3,302,460 | 498,149 |
| Events in quadrant C | 3,369,620 | 485,460 |
| Events in quadrant D | 4,763,284 | 445,972 |
| Mode SS | |||
|---|---|---|---|
| Quadrant | BADHDUFLAG | Total packets | Discarded packets |
| A | 0 | 116 | 0 |
| B | 0 | 116 | 0 |
| C | 0 | 116 | 0 |
| D | 0 | 116 | 0 |
| Mode M9 | |||
|---|---|---|---|
| Quadrant | BADHDUFLAG | Total packets | Discarded packets |
| A | 0 | 35 | 0 |
| B | 0 | 35 | 0 |
| C | 0 | 35 | 0 |
| D | 0 | 35 | 0 |
| Mode M0 | |||
|---|---|---|---|
| Quadrant | BADHDUFLAG | Total packets | Discarded packets |
| A | 0 | 11800 | 3 |
| B | 0 | 13333 | 2 |
| C | 0 | 13358 | 2 |
| D | 0 | 17777 | 2 |
| Quadrant | Total seconds | Saturated seconds | Saturation percentage |
|---|---|---|---|
| A | 5536 | 6 | 0.108382% |
| B | 5536 | 162 | 2.926301% |
| C | 5536 | 171 | 3.088873% |
| D | 5536 | 422 | 7.622832% |
Noise dominated data is calculated using 1-second bins in cleaned event files. If a bin has >2000 counts, and if more than 50% of those come from <1% of pixels, then it is considered to be noise-dominated and hence unusable.
| Quadrant | # 1 sec bins | Bins with >0 counts | Bins with >2000 counts | High rate bins dominated by noise | Noise dominated (total time) | Noise dominated (detector-on time) | Marked lightcurve |
|---|---|---|---|---|---|---|---|
| A | 9062 | 5538 | 0 | 0 | 0.00% | 0.00% | 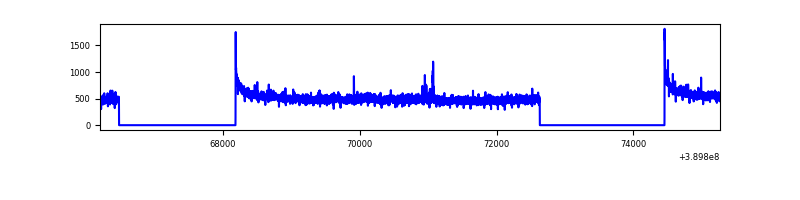 |
| B | 9062 | 5538 | 92 | 92 | 1.02% | 1.66% | 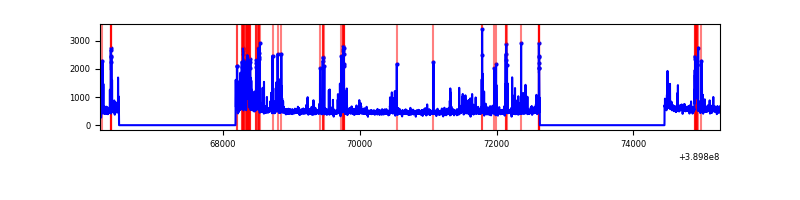 |
| C | 9062 | 5538 | 151 | 151 | 1.67% | 2.73% | 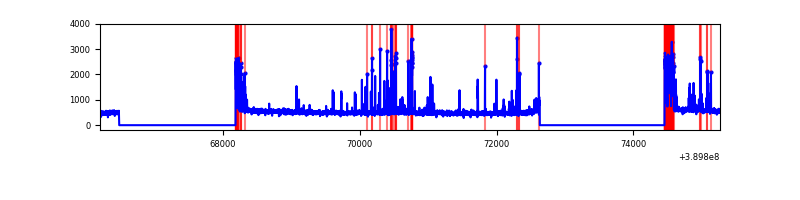 |
| D | 9062 | 5538 | 518 | 518 | 5.72% | 9.35% | 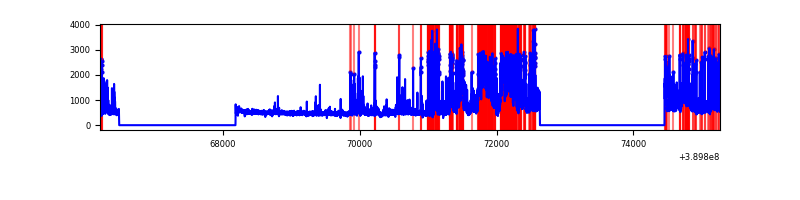 |
Top three noisy pixels from each quadrant. If the there are fewer than three noisy pixels in the level2.evt file, extra rows are filled as -1
| Pixel properties | Quadrant properties | ||||||
|---|---|---|---|---|---|---|---|
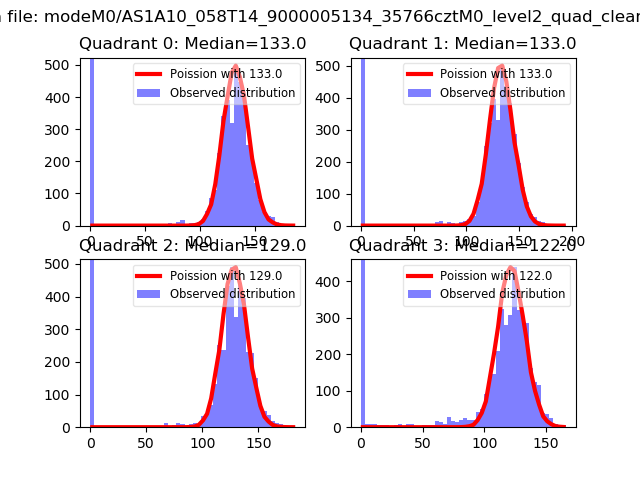
| Quadrant | DetID | PixID | Counts | Sigma | Mean | Median | Sigma |
| A | 10 | 83 | 157246 | 1149.49 | 679 | 667 | 136.2 |
| A | 15 | 223 | 40605 | 293.2 | 679 | 667 | 136.2 |
| A | 13 | 6 | 12210 | 84.74 | 679 | 667 | 136.2 |
| B | 5 | 172 | 331682 | 2609.69 | 666 | 651 | 126.8 |
| B | 5 | 255 | 147366 | 1156.63 | 666 | 651 | 126.8 |
| B | 0 | 213 | 124457 | 976.03 | 666 | 651 | 126.8 |
| C | 1 | 23 | 475070 | 3205.32 | 643 | 648 | 148.0 |
| C | 15 | 214 | 229527 | 1546.37 | 643 | 648 | 148.0 |
| C | 0 | 10 | 131063 | 881.12 | 643 | 648 | 148.0 |
| D | 1 | 52 | 900683 | 5777.77 | 640 | 623 | 155.8 |
| D | 14 | 52 | 679219 | 4356.12 | 640 | 623 | 155.8 |
| D | 13 | 249 | 261389 | 1673.94 | 640 | 623 | 155.8 |
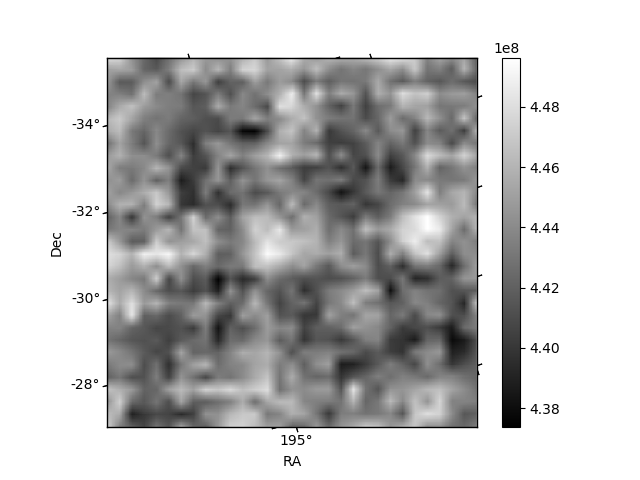
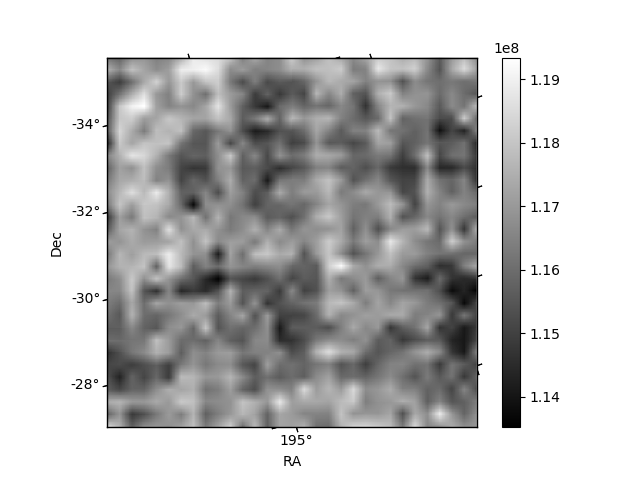
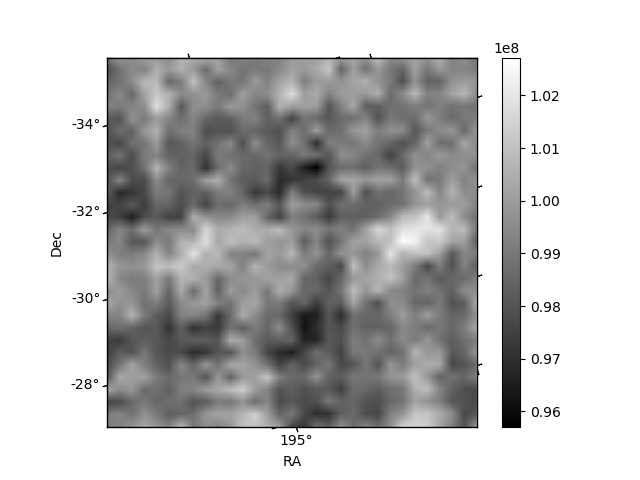
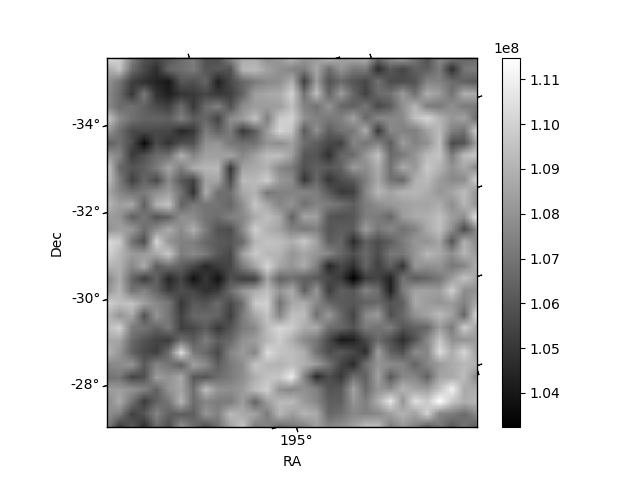
Histogram calculated using DETX and DETY for each event in the final _common_clean file
| Quadrant A | 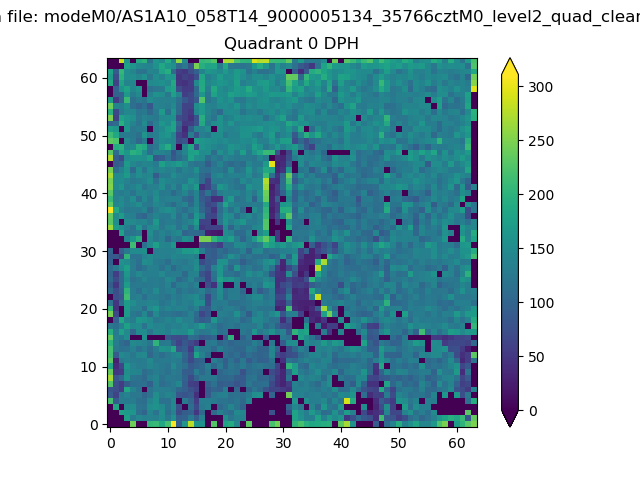 |
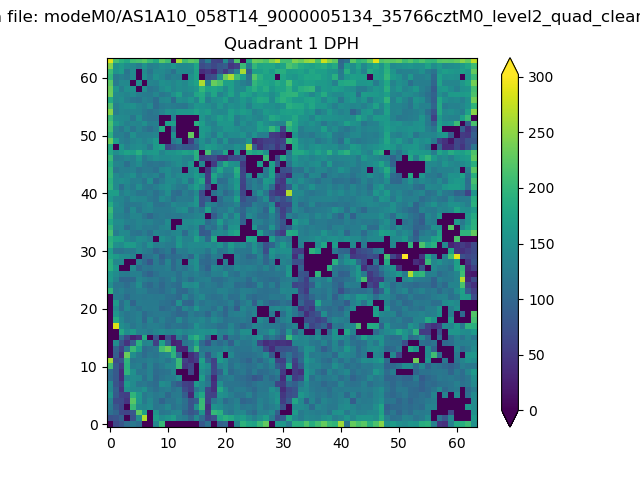 |
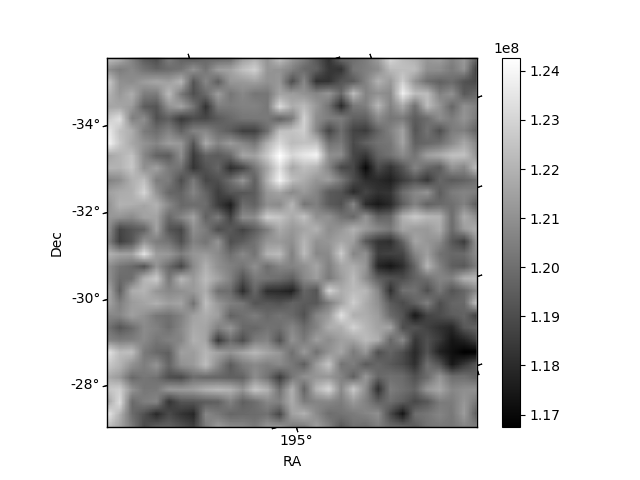
Quadrant B |
|---|---|---|---|
| Quadrant D | 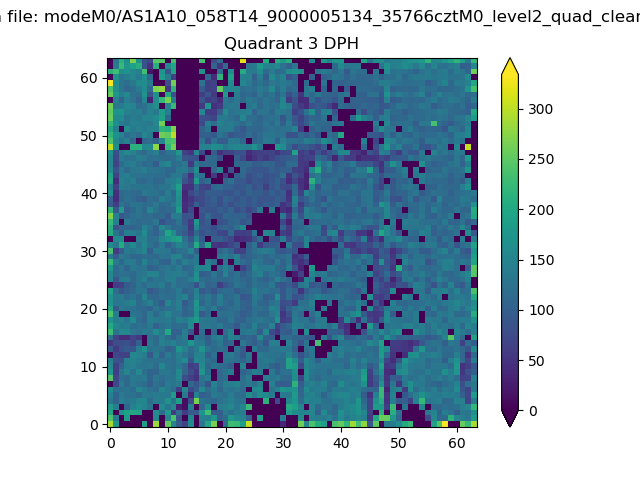 |
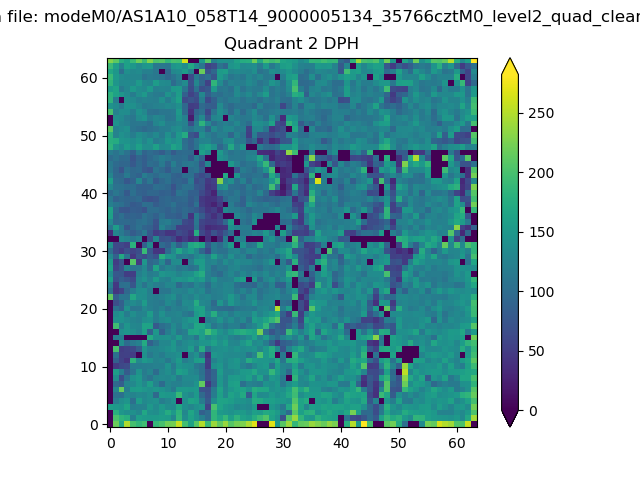 |
Quadrant C |
| Plot type | Count rate plots | Images |
|---|---|---|
| Comparison with Poisson distribution Blue bars denote a histogram of data divided into 1 sec bins. Red curve is a Poisson curve with rate = median count rate of data. |
 |
 |
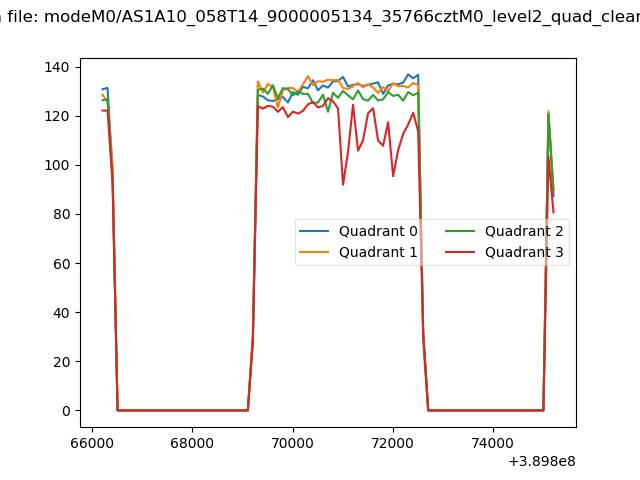
| Quadrant-wise count rates Data is divided into 100 sec bins |
 |
|
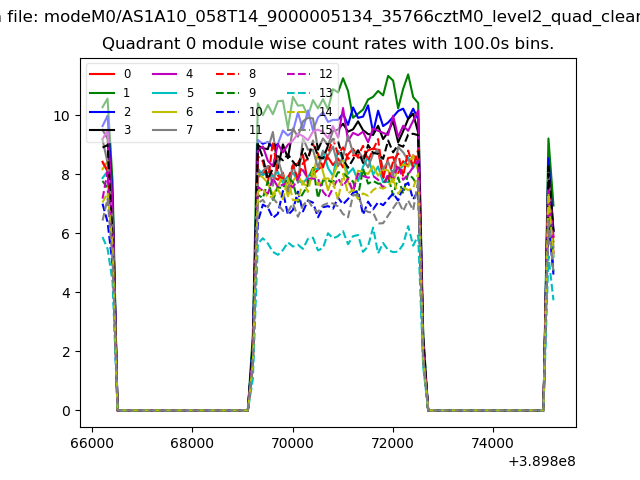
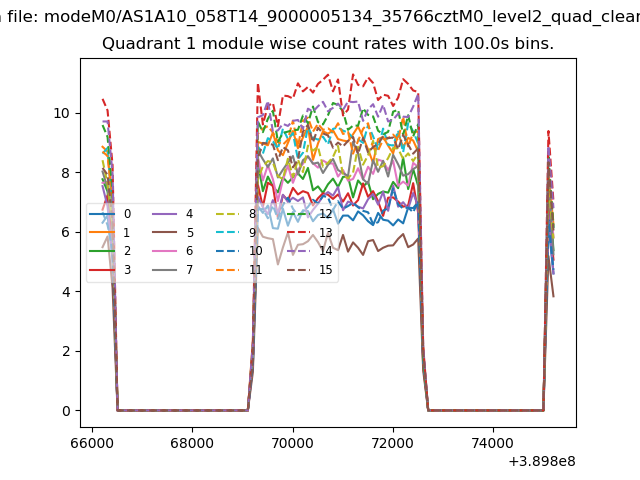
| Module-wise count rates for Quadrant A Data is divided into 100 sec bins |
 |
 |
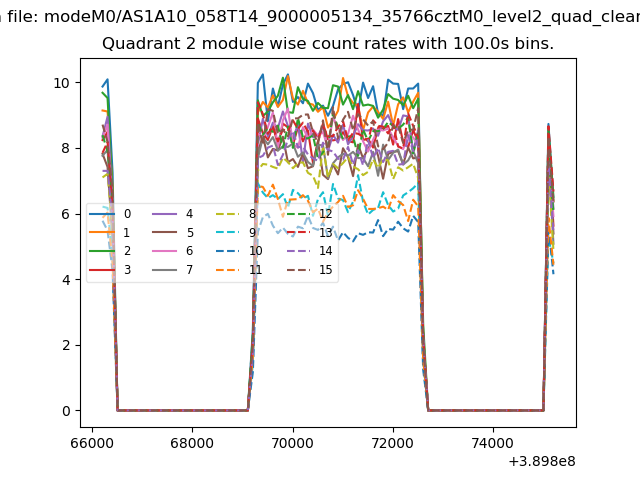
| Module-wise count rates for Quadrant B Data is divided into 100 sec bins |
 |
 |
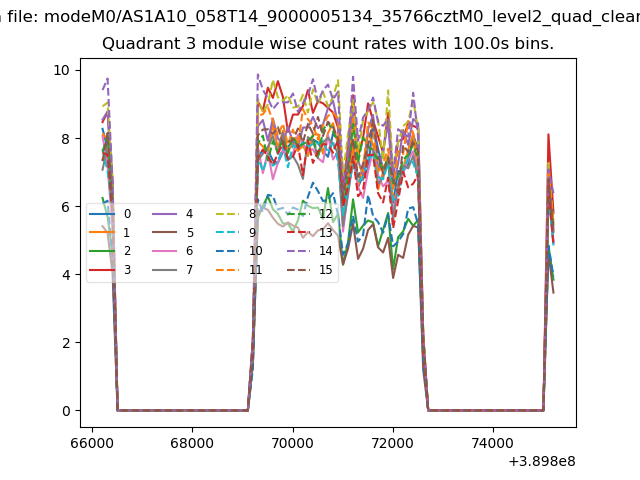
| Module-wise count rates for Quadrant C Data is divided into 100 sec bins |
 |
 |
| Module-wise count rates for Quadrant D Data is divided into 100 sec bins |
 |
 |
| Parameter | Plot |
|---|---|
| CZT HV Monitor | 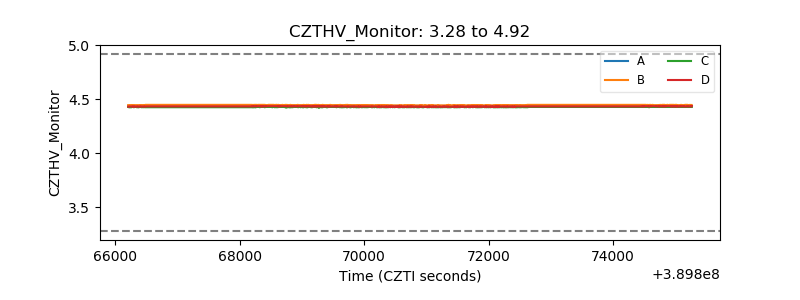 |
| D_VDD | 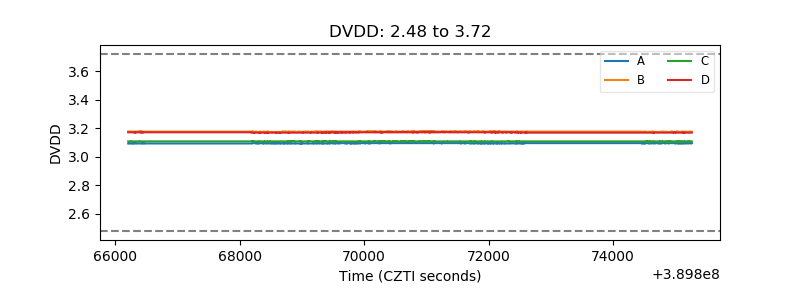 |
| Temperature 1 | 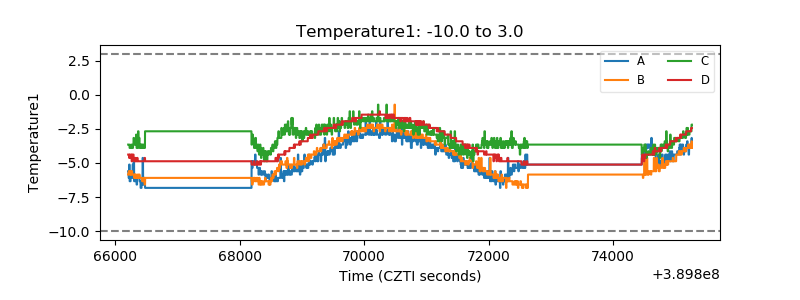 |
| Veto HV Monitor | 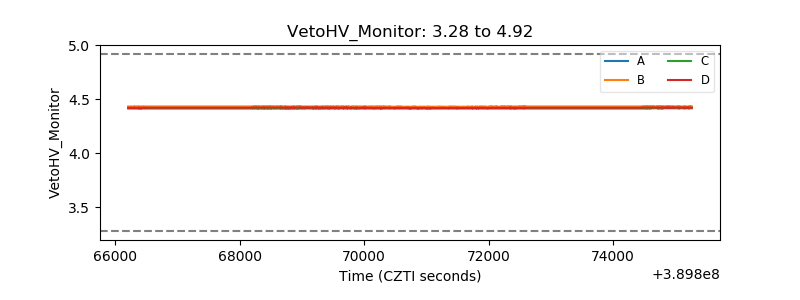 |
| Veto LLD | 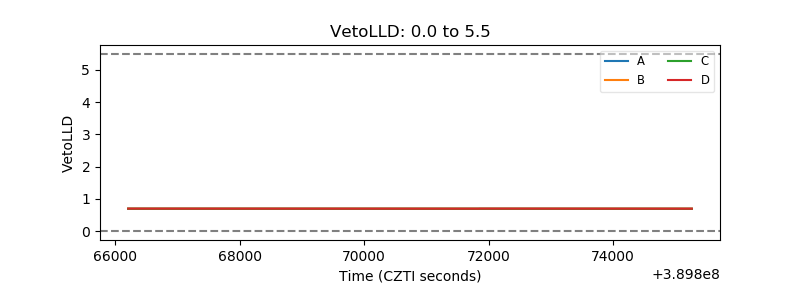 |
| Alpha Counter | 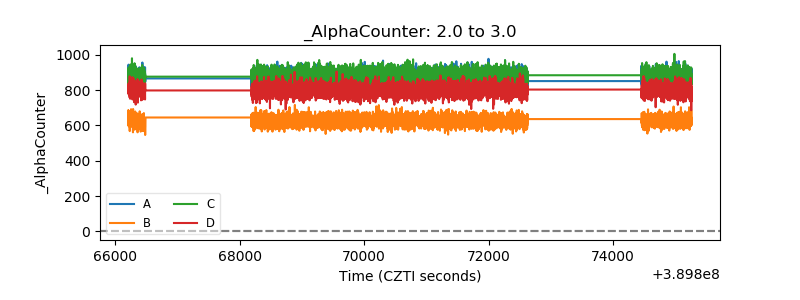 |
| _CPM_Rate | 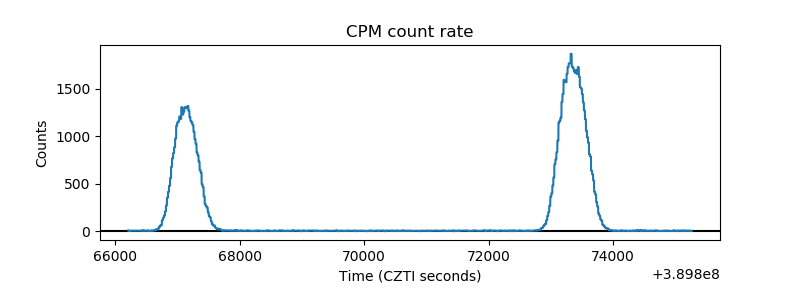 |
| CZT Counter | 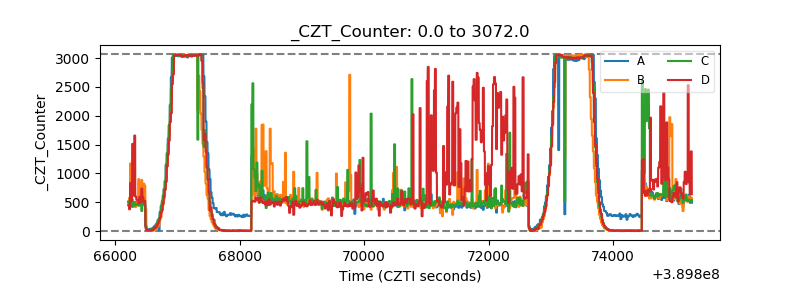 |
| +2.5 Volts monitor | 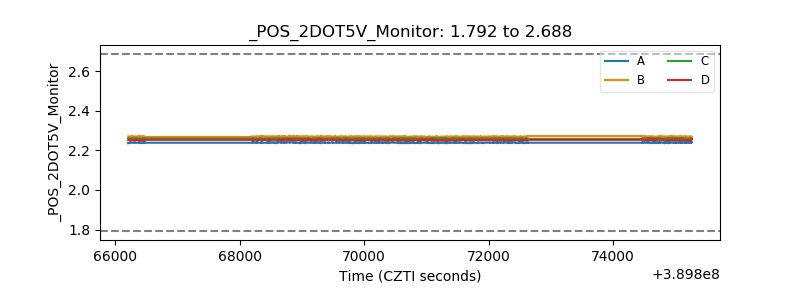 |
| +5 Volts monitor | 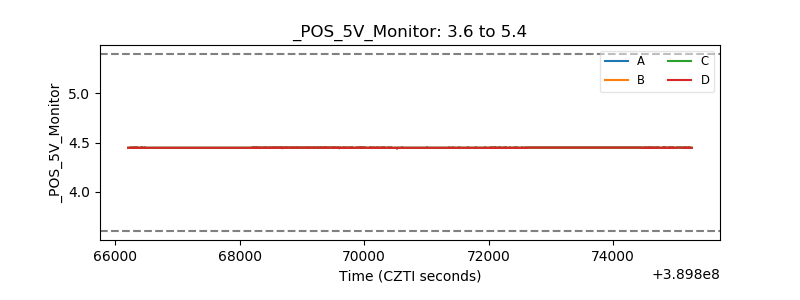 |
| _ROLL_ROT | 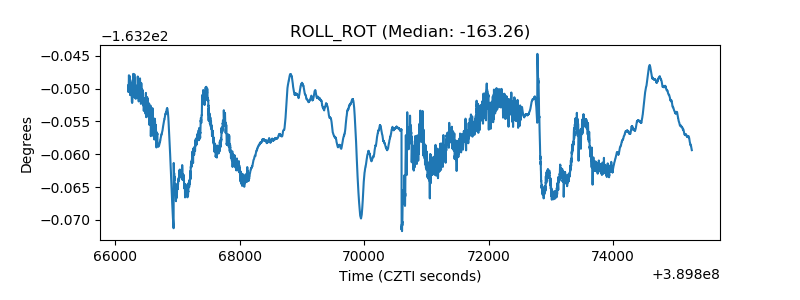 |
| _Roll_DEC | 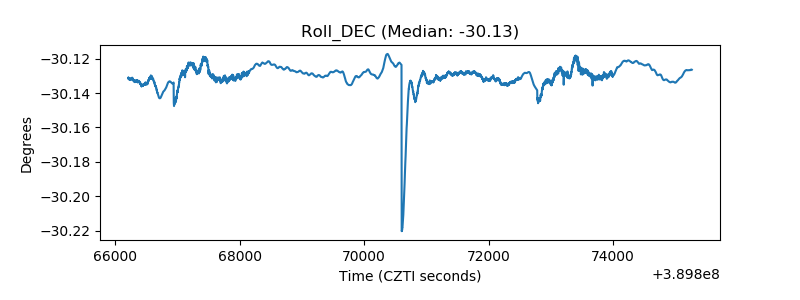 |
| _Roll_RA | 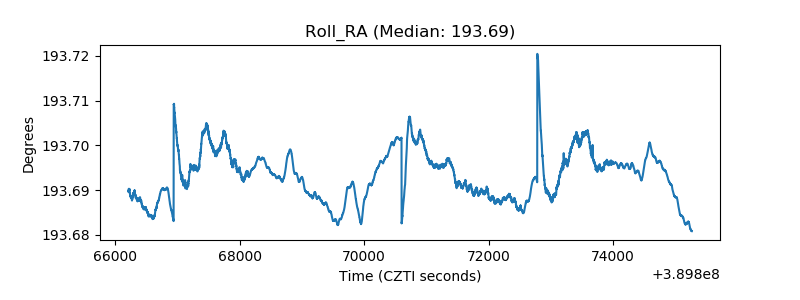 |
| Veto Counter | 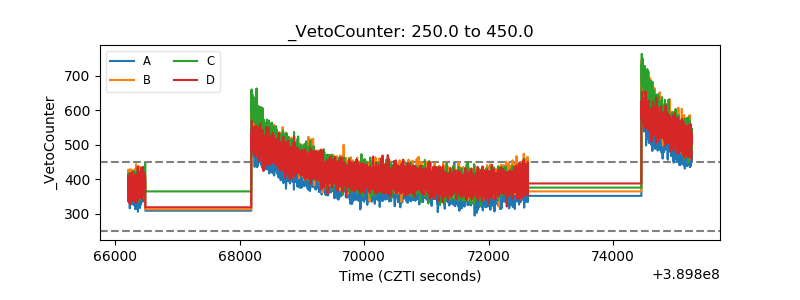 |