| Param | Original file | Final file |
|---|---|---|
| Filename | modeM0/AS1A10_058T14_9000005134_35763cztM0_level2.evt | modeM0/AS1A10_058T14_9000005134_35763cztM0_level2_quad_clean.evt |
| Size (bytes) | 430,704,000 | 58,639,680 |
| Size | 410.8 MB | 55.9 MB |
| Events in quadrant A | 2,698,752 | 354,861 |
| Events in quadrant B | 3,336,451 | 353,489 |
| Events in quadrant C | 3,255,356 | 340,699 |
| Events in quadrant D | 3,372,841 | 334,580 |
| Mode SS | |||
|---|---|---|---|
| Quadrant | BADHDUFLAG | Total packets | Discarded packets |
| A | 0 | 116 | 0 |
| B | 0 | 116 | 0 |
| C | 0 | 116 | 0 |
| D | 0 | 116 | 0 |
| Mode M9 | |||
|---|---|---|---|
| Quadrant | BADHDUFLAG | Total packets | Discarded packets |
| A | 0 | 30 | 0 |
| B | 0 | 30 | 0 |
| C | 0 | 30 | 0 |
| D | 0 | 30 | 0 |
| Mode M0 | |||
|---|---|---|---|
| Quadrant | BADHDUFLAG | Total packets | Discarded packets |
| A | 0 | 11483 | 3 |
| B | 0 | 13410 | 2 |
| C | 0 | 13034 | 2 |
| D | 0 | 13851 | 2 |
| Quadrant | Total seconds | Saturated seconds | Saturation percentage |
|---|---|---|---|
| A | 5599 | 4 | 0.071441% |
| B | 5599 | 157 | 2.804072% |
| C | 5599 | 119 | 2.125380% |
| D | 5599 | 86 | 1.535989% |
Noise dominated data is calculated using 1-second bins in cleaned event files. If a bin has >2000 counts, and if more than 50% of those come from <1% of pixels, then it is considered to be noise-dominated and hence unusable.
| Quadrant | # 1 sec bins | Bins with >0 counts | Bins with >2000 counts | High rate bins dominated by noise | Noise dominated (total time) | Noise dominated (detector-on time) | Marked lightcurve |
|---|---|---|---|---|---|---|---|
| A | 8646 | 5601 | 0 | 0 | 0.00% | 0.00% | 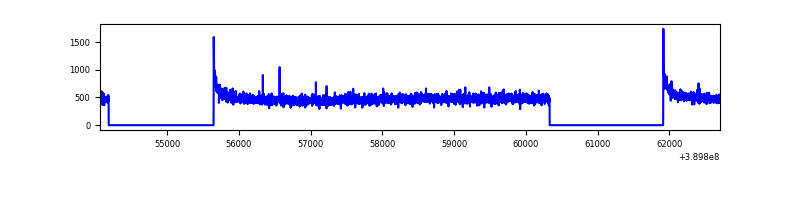 |
| B | 8646 | 5601 | 107 | 107 | 1.24% | 1.91% | 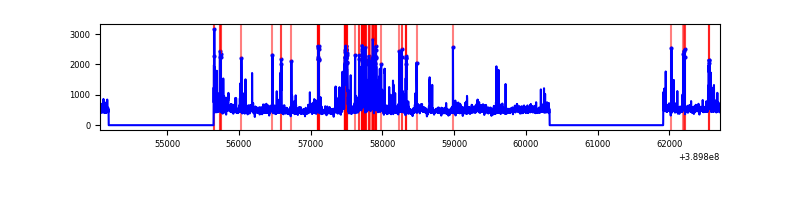 |
| C | 8646 | 5600 | 105 | 105 | 1.21% | 1.88% | 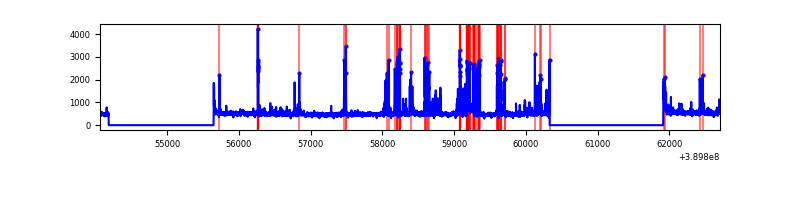 |
| D | 8646 | 5601 | 94 | 94 | 1.09% | 1.68% | 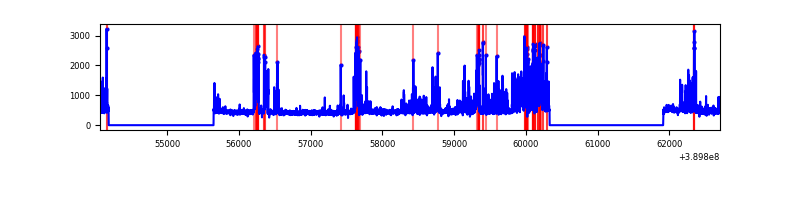 |
Top three noisy pixels from each quadrant. If the there are fewer than three noisy pixels in the level2.evt file, extra rows are filled as -1
| Pixel properties | Quadrant properties | ||||||
|---|---|---|---|---|---|---|---|
| Quadrant | DetID | PixID | Counts | Sigma | Mean | Median | Sigma |
| A | 10 | 83 | 157489 | 1207.38 | 646 | 633 | 129.9 |
| A | 15 | 223 | 26136 | 196.31 | 646 | 633 | 129.9 |
| A | 13 | 6 | 14601 | 107.52 | 646 | 633 | 129.9 |
| B | 5 | 172 | 570185 | 4674.1 | 636 | 621 | 121.9 |
| B | 5 | 255 | 69992 | 569.29 | 636 | 621 | 121.9 |
| B | 0 | 189 | 43460 | 351.56 | 636 | 621 | 121.9 |
| C | 1 | 23 | 540855 | 3760.11 | 617 | 620 | 143.7 |
| C | 15 | 214 | 234296 | 1626.41 | 617 | 620 | 143.7 |
| C | 0 | 10 | 50243 | 345.38 | 617 | 620 | 143.7 |
| D | 7 | 80 | 335914 | 2208.78 | 621 | 604 | 151.8 |
| D | 14 | 52 | 267896 | 1760.73 | 621 | 604 | 151.8 |
| D | 13 | 249 | 159505 | 1046.73 | 621 | 604 | 151.8 |
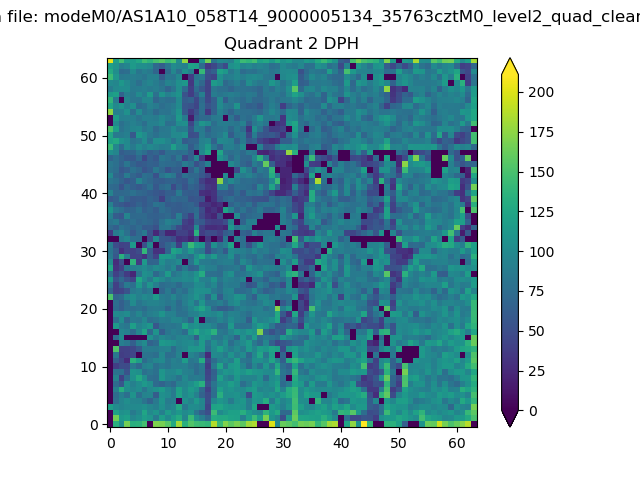
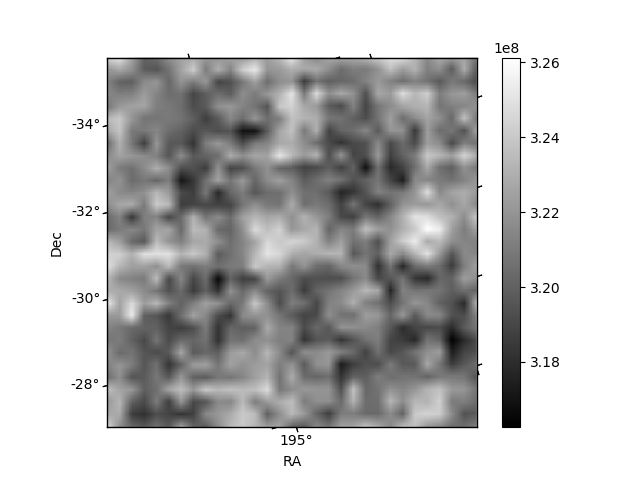
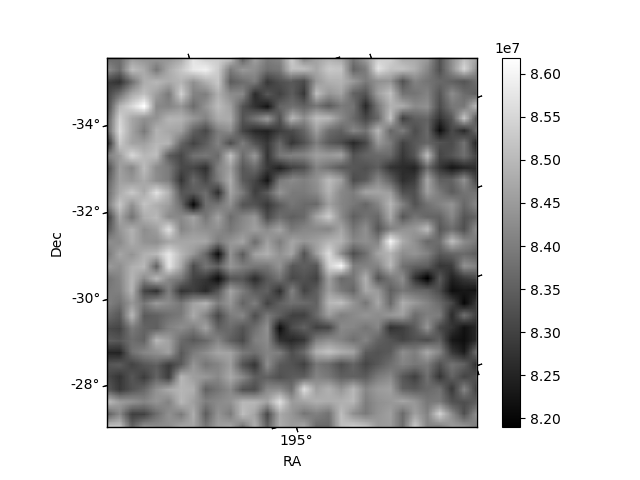
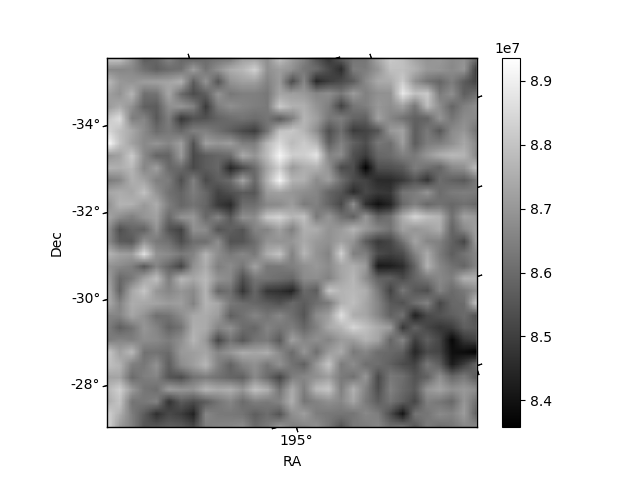
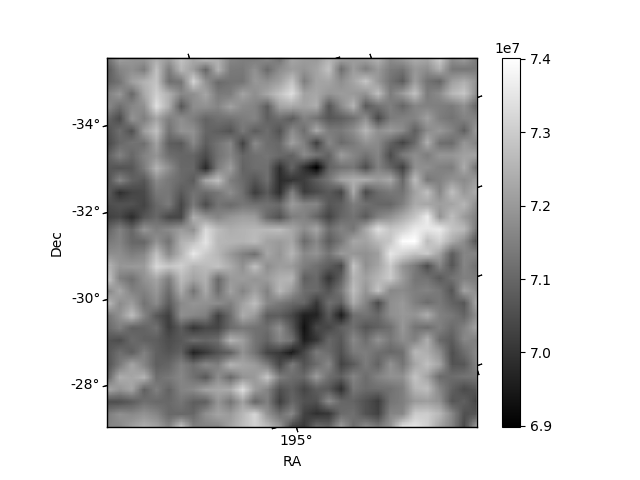
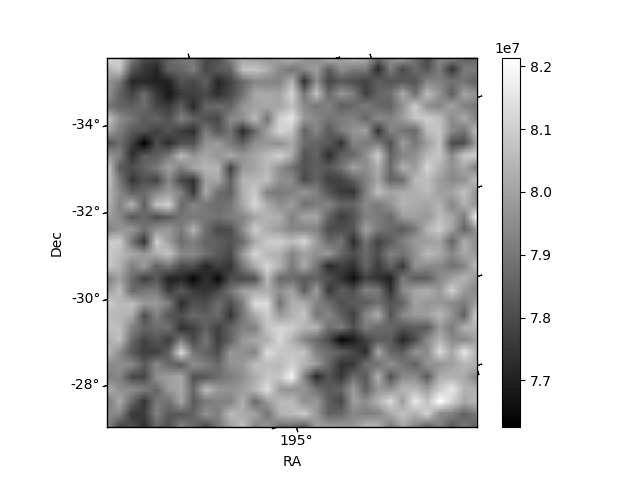
Histogram calculated using DETX and DETY for each event in the final _common_clean file
| Quadrant A | 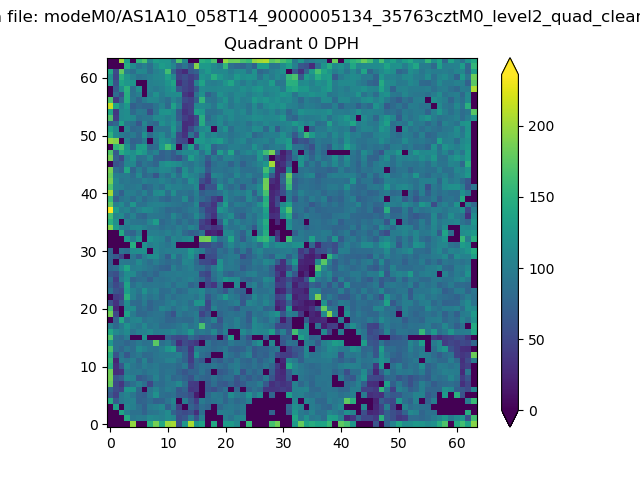 |
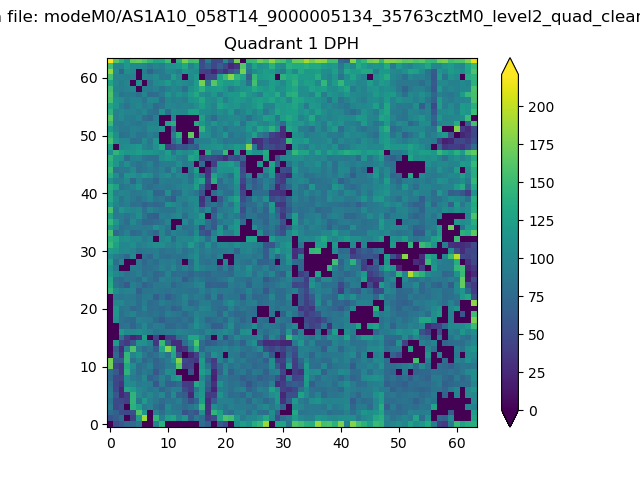 |
Quadrant B |
|---|---|---|---|
| Quadrant D | 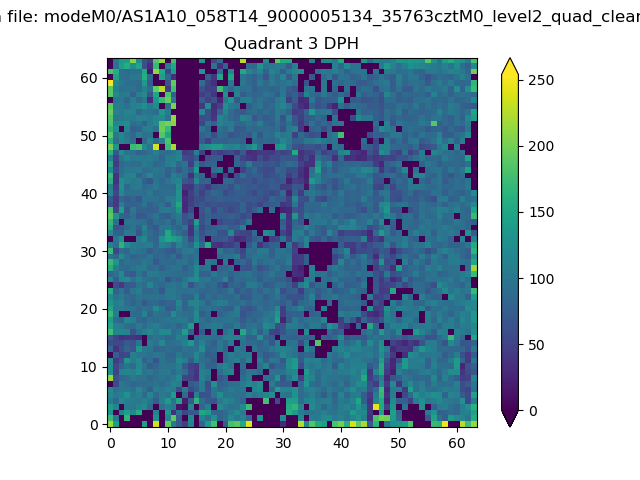 |
 |
Quadrant C |
| Plot type | Count rate plots | Images |
|---|---|---|
| Comparison with Poisson distribution Blue bars denote a histogram of data divided into 1 sec bins. Red curve is a Poisson curve with rate = median count rate of data. |
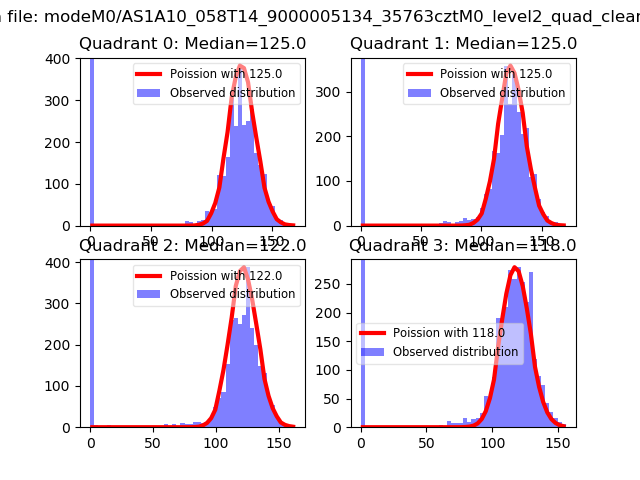 |
 |
| Quadrant-wise count rates Data is divided into 100 sec bins |
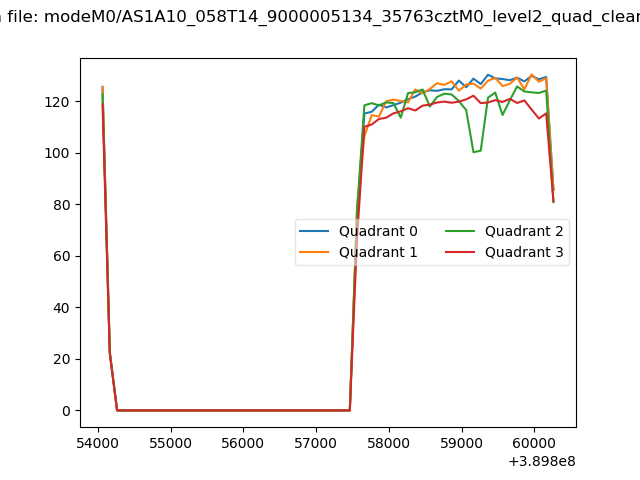 |
|
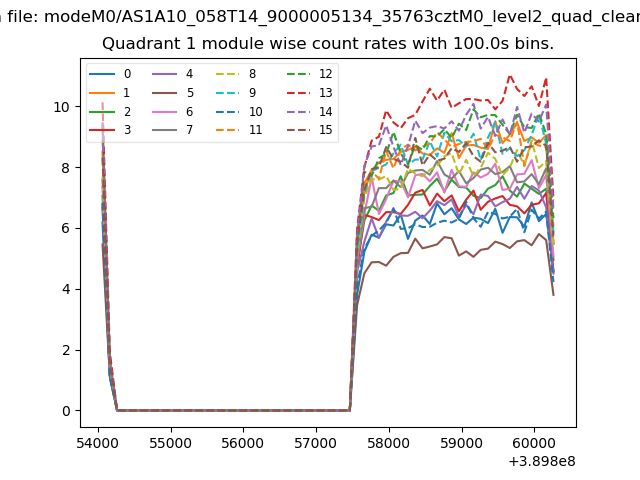
| Module-wise count rates for Quadrant A Data is divided into 100 sec bins |
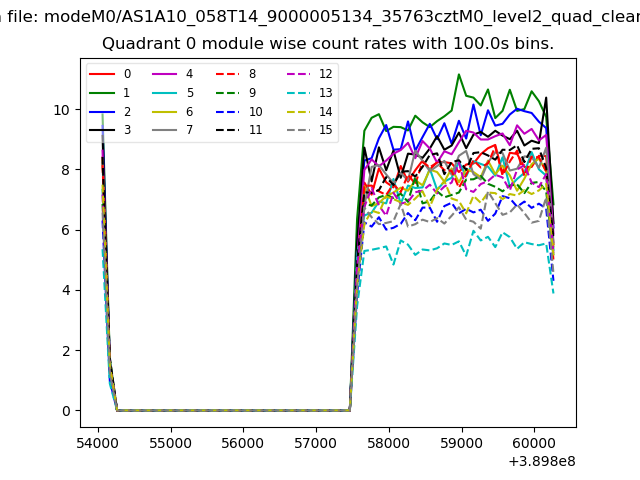 |
 |
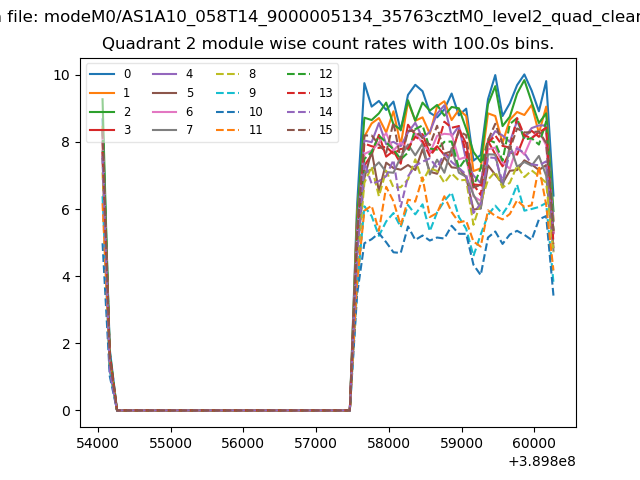
| Module-wise count rates for Quadrant B Data is divided into 100 sec bins |
 |
 |
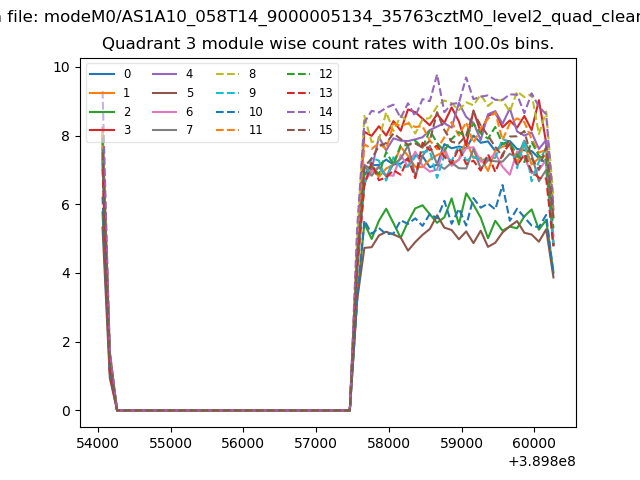
| Module-wise count rates for Quadrant C Data is divided into 100 sec bins |
 |
 |
| Module-wise count rates for Quadrant D Data is divided into 100 sec bins |
 |
 |
| Parameter | Plot |
|---|---|
| CZT HV Monitor | 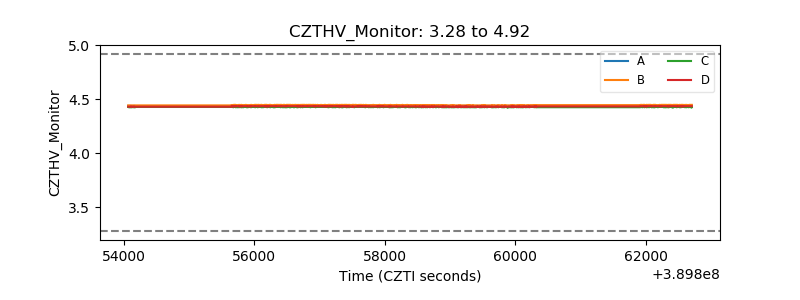 |
| D_VDD | 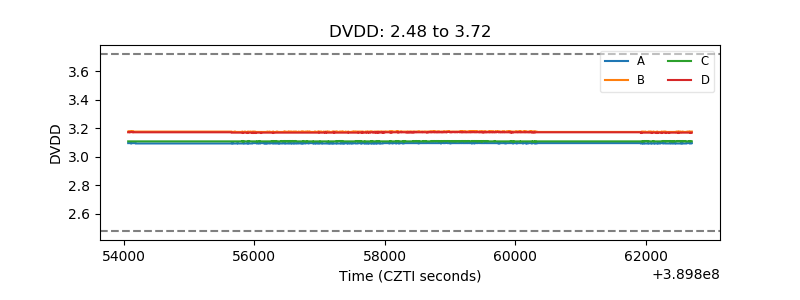 |
| Temperature 1 | 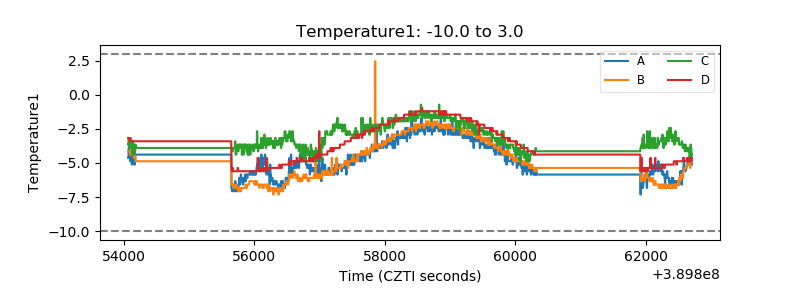 |
| Veto HV Monitor | 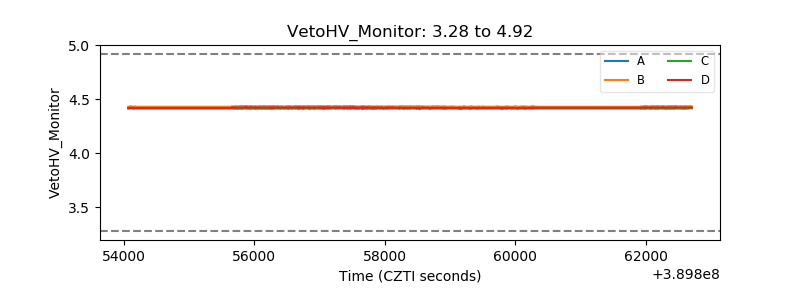 |
| Veto LLD | 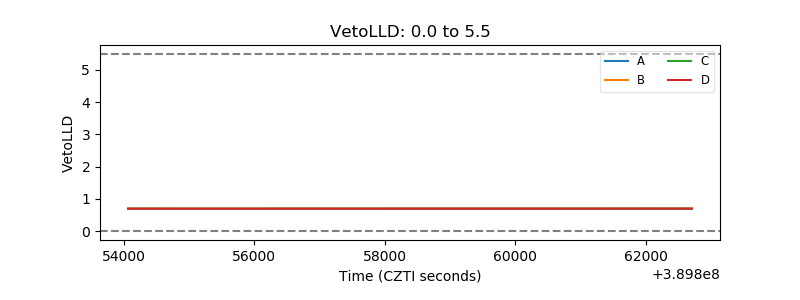 |
| Alpha Counter | 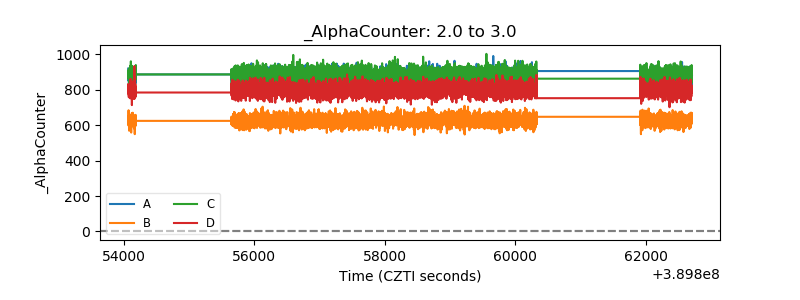 |
| _CPM_Rate | 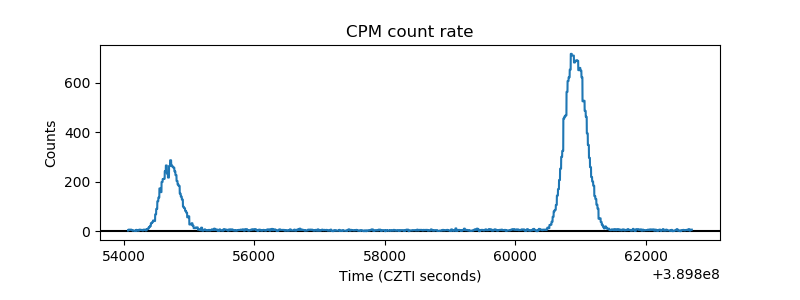 |
| CZT Counter | 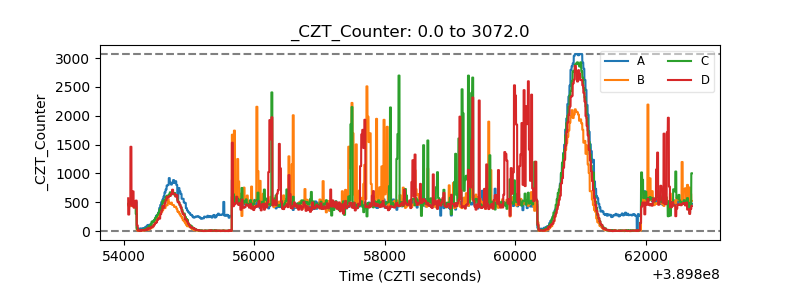 |
| +2.5 Volts monitor | 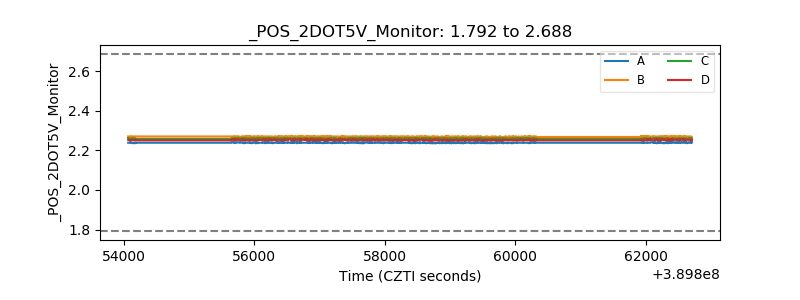 |
| +5 Volts monitor | 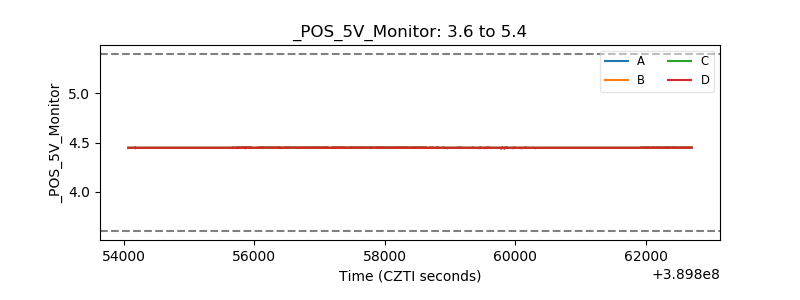 |
| _ROLL_ROT | 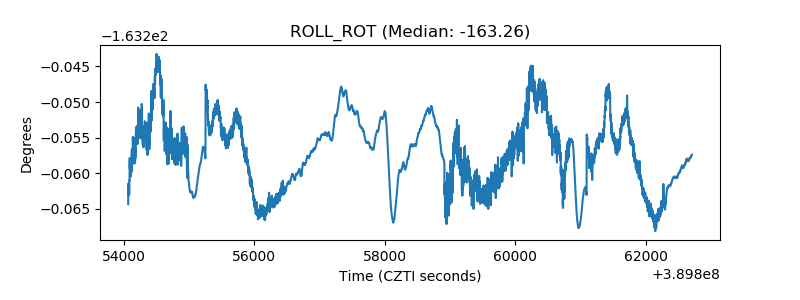 |
| _Roll_DEC | 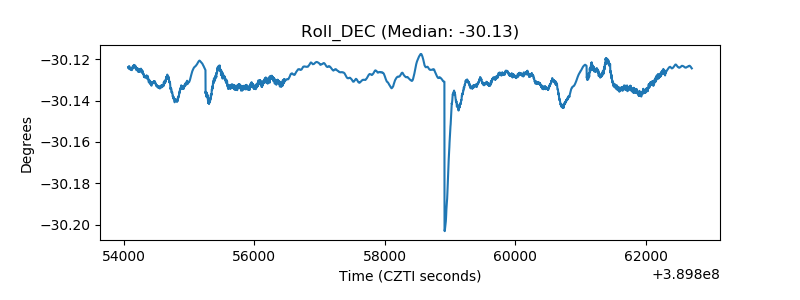 |
| _Roll_RA | 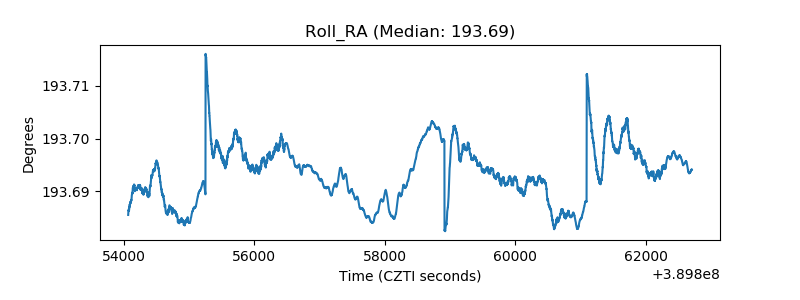 |
| Veto Counter | 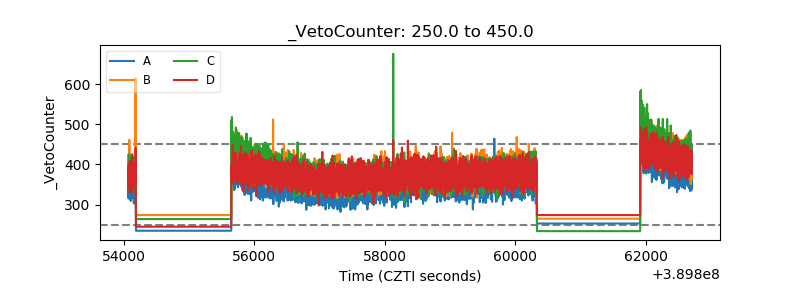 |