| Param | Original file | Final file |
|---|---|---|
| Filename | modeM0/AS1A10_058T14_9000005134_35762cztM0_level2.evt | modeM0/AS1A10_058T14_9000005134_35762cztM0_level2_quad_clean.evt |
| Size (bytes) | 869,708,160 | 114,318,720 |
| Size | 829.4 MB | 109.0 MB |
| Events in quadrant A | 5,615,196 | 696,244 |
| Events in quadrant B | 6,185,700 | 697,738 |
| Events in quadrant C | 6,222,231 | 676,810 |
| Events in quadrant D | 7,582,528 | 639,573 |
| Mode SS | |||
|---|---|---|---|
| Quadrant | BADHDUFLAG | Total packets | Discarded packets |
| A | 0 | 222 | 0 |
| B | 0 | 222 | 0 |
| C | 0 | 222 | 0 |
| D | 0 | 222 | 0 |
| Mode M9 | |||
|---|---|---|---|
| Quadrant | BADHDUFLAG | Total packets | Discarded packets |
| A | 0 | 41 | 0 |
| B | 0 | 41 | 0 |
| C | 0 | 41 | 0 |
| D | 0 | 41 | 0 |
| Mode M0 | |||
|---|---|---|---|
| Quadrant | BADHDUFLAG | Total packets | Discarded packets |
| A | 0 | 23616 | 4 |
| B | 0 | 25308 | 3 |
| C | 0 | 25047 | 3 |
| D | 0 | 30007 | 3 |
| Quadrant | Total seconds | Saturated seconds | Saturation percentage |
|---|---|---|---|
| A | 10857 | 7 | 0.064475% |
| B | 10857 | 233 | 2.146081% |
| C | 10857 | 203 | 1.869761% |
| D | 10857 | 525 | 4.835590% |
Noise dominated data is calculated using 1-second bins in cleaned event files. If a bin has >2000 counts, and if more than 50% of those come from <1% of pixels, then it is considered to be noise-dominated and hence unusable.
| Quadrant | # 1 sec bins | Bins with >0 counts | Bins with >2000 counts | High rate bins dominated by noise | Noise dominated (total time) | Noise dominated (detector-on time) | Marked lightcurve |
|---|---|---|---|---|---|---|---|
| A | 14977 | 10860 | 0 | 0 | 0.00% | 0.00% | 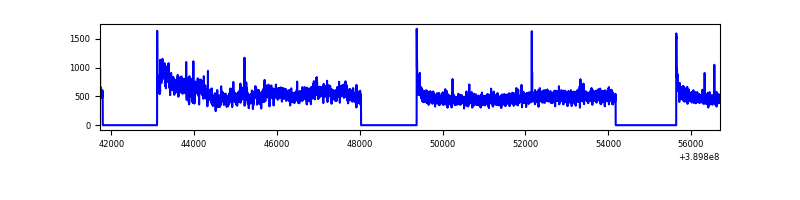 |
| B | 14977 | 10860 | 163 | 163 | 1.09% | 1.50% | 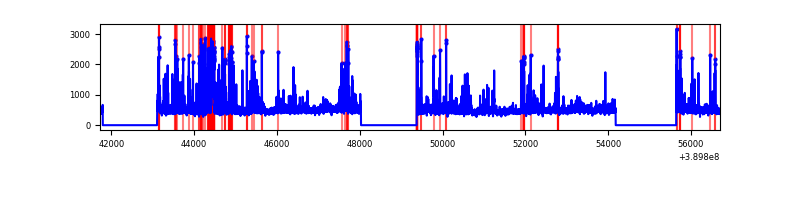 |
| C | 14977 | 10860 | 186 | 186 | 1.24% | 1.71% | 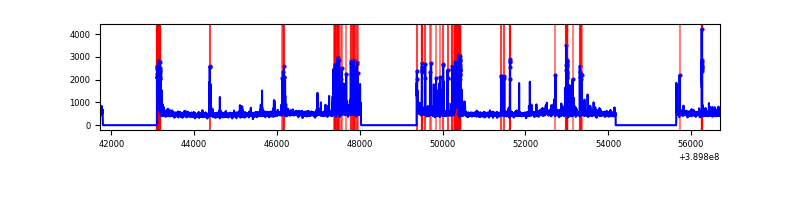 |
| D | 14977 | 10860 | 523 | 523 | 3.49% | 4.82% | 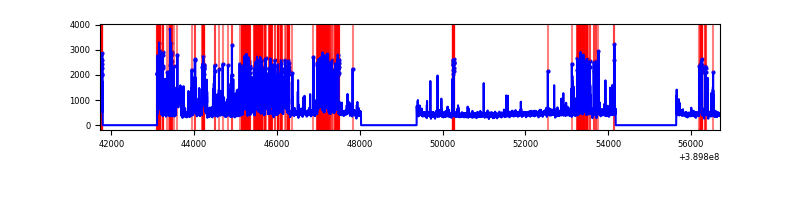 |
Top three noisy pixels from each quadrant. If the there are fewer than three noisy pixels in the level2.evt file, extra rows are filled as -1
| Pixel properties | Quadrant properties | ||||||
|---|---|---|---|---|---|---|---|
| Quadrant | DetID | PixID | Counts | Sigma | Mean | Median | Sigma |
| A | 15 | 223 | 493867 | 1959.44 | 1244 | 1217 | 251.4 |
| A | 10 | 83 | 271953 | 1076.81 | 1244 | 1217 | 251.4 |
| A | 13 | 6 | 29486 | 112.44 | 1244 | 1217 | 251.4 |
| B | 5 | 172 | 731011 | 3115.7 | 1227 | 1195 | 234.2 |
| B | 0 | 213 | 224790 | 954.56 | 1227 | 1195 | 234.2 |
| B | 5 | 255 | 125104 | 528.99 | 1227 | 1195 | 234.2 |
| C | 1 | 23 | 889750 | 3208.04 | 1193 | 1201 | 277.0 |
| C | 15 | 214 | 449258 | 1617.68 | 1193 | 1201 | 277.0 |
| C | 0 | 10 | 165666 | 593.79 | 1193 | 1201 | 277.0 |
| D | 1 | 52 | 1693497 | 5918.52 | 1184 | 1151 | 285.9 |
| D | 13 | 249 | 549740 | 1918.54 | 1184 | 1151 | 285.9 |
| D | 7 | 80 | 259888 | 904.86 | 1184 | 1151 | 285.9 |
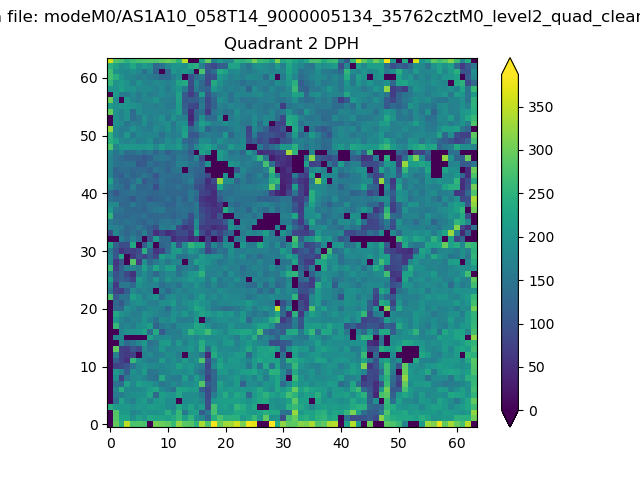
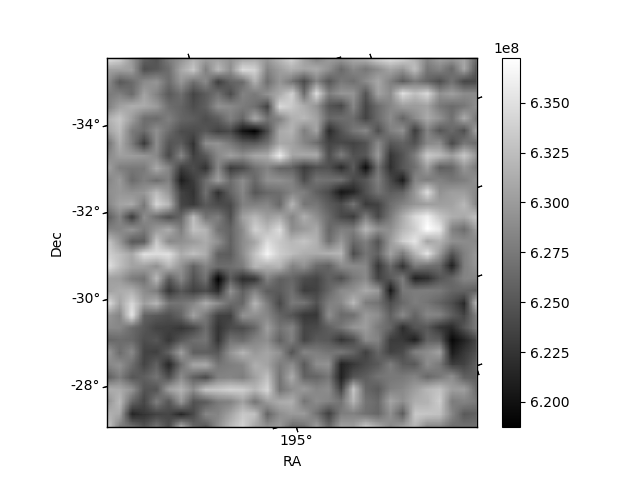
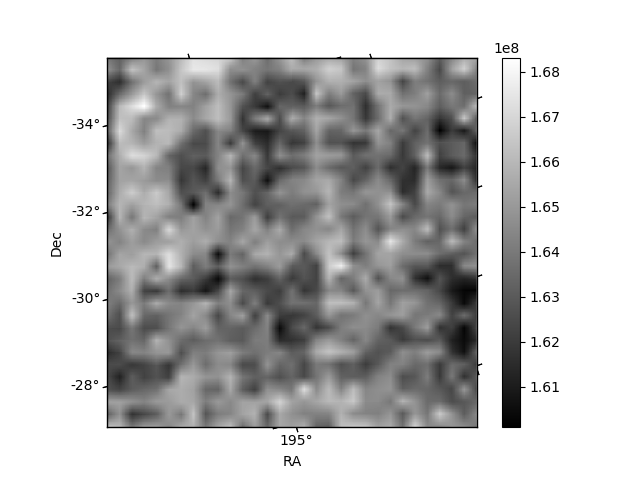
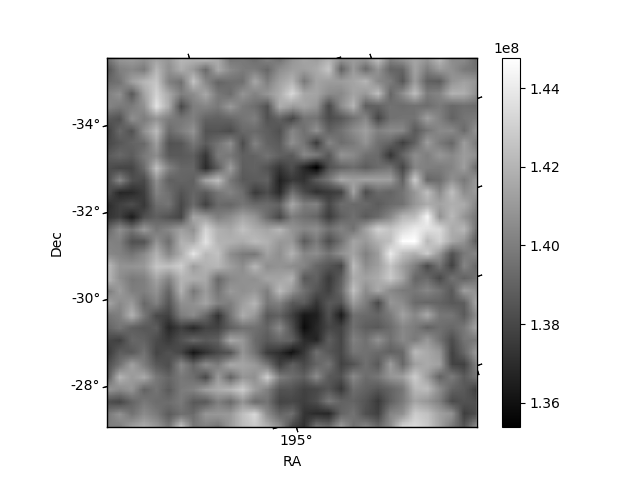
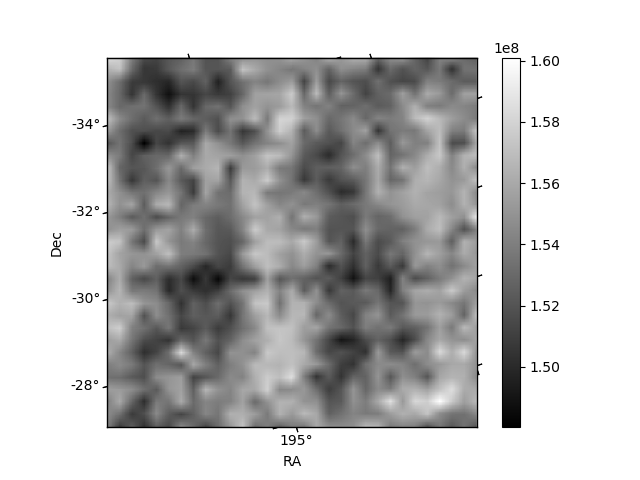
Histogram calculated using DETX and DETY for each event in the final _common_clean file
| Quadrant A | 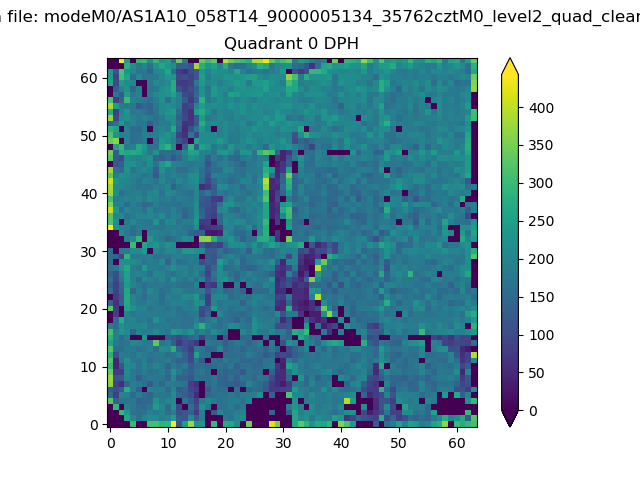 |
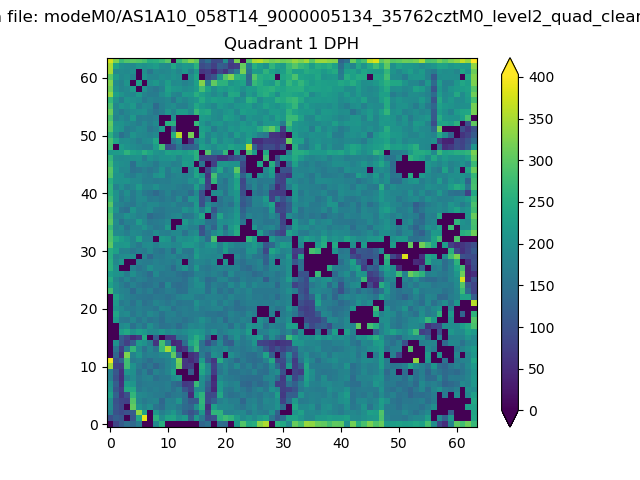 |
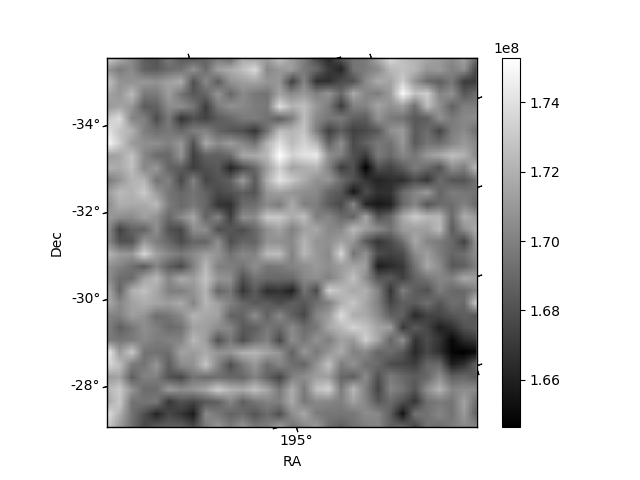
Quadrant B |
|---|---|---|---|
| Quadrant D | 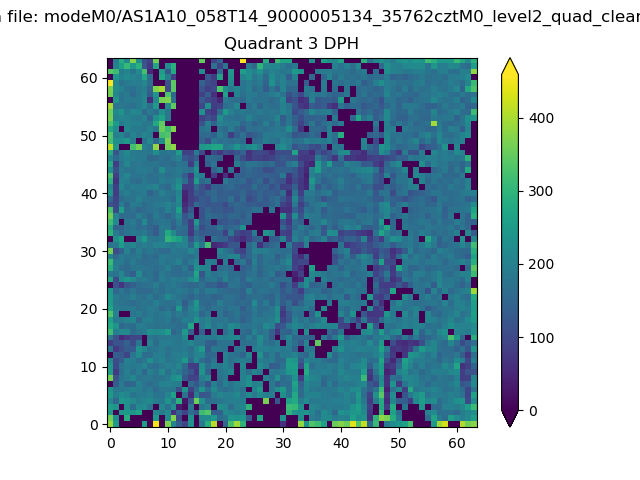 |
 |
Quadrant C |
| Plot type | Count rate plots | Images |
|---|---|---|
| Comparison with Poisson distribution Blue bars denote a histogram of data divided into 1 sec bins. Red curve is a Poisson curve with rate = median count rate of data. |
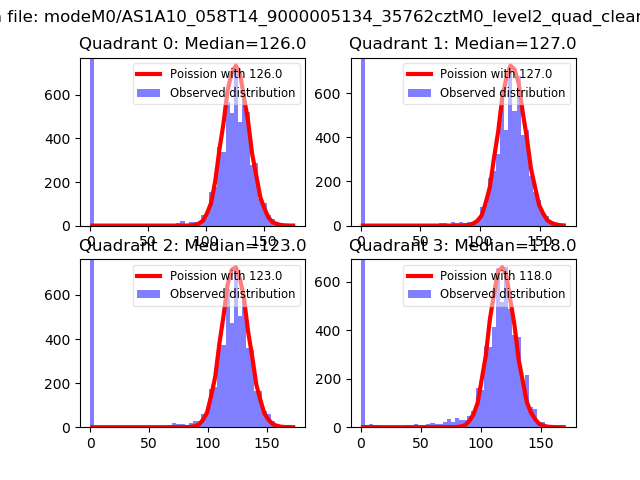 |
 |
| Quadrant-wise count rates Data is divided into 100 sec bins |
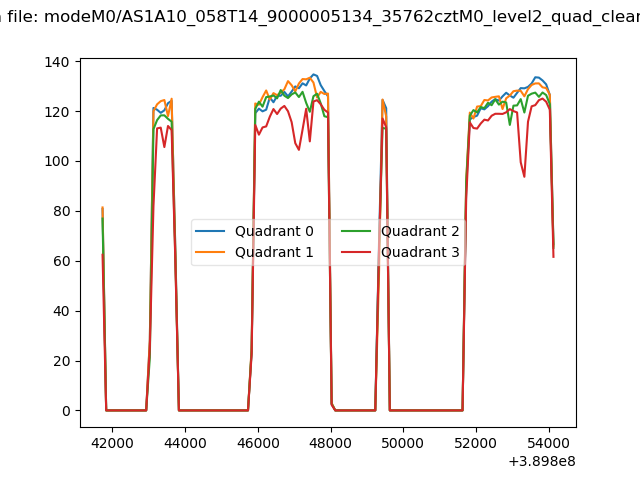 |
|
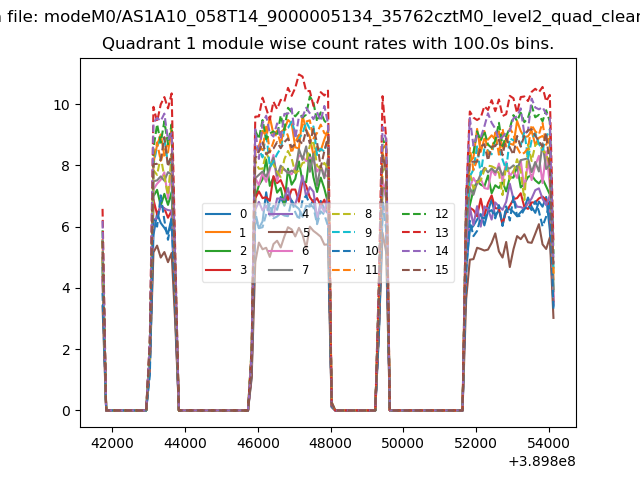
| Module-wise count rates for Quadrant A Data is divided into 100 sec bins |
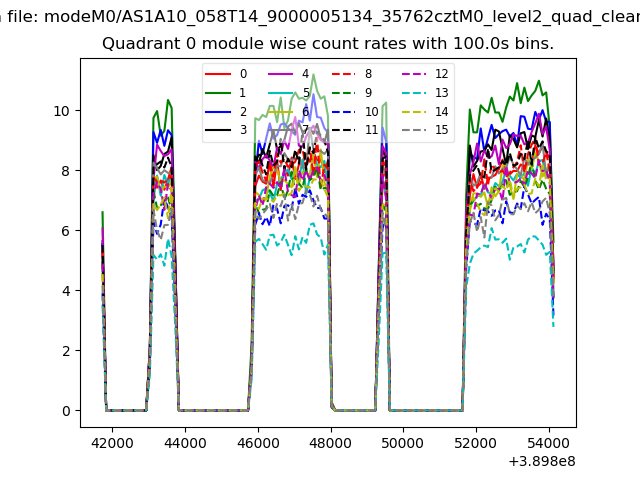 |
 |
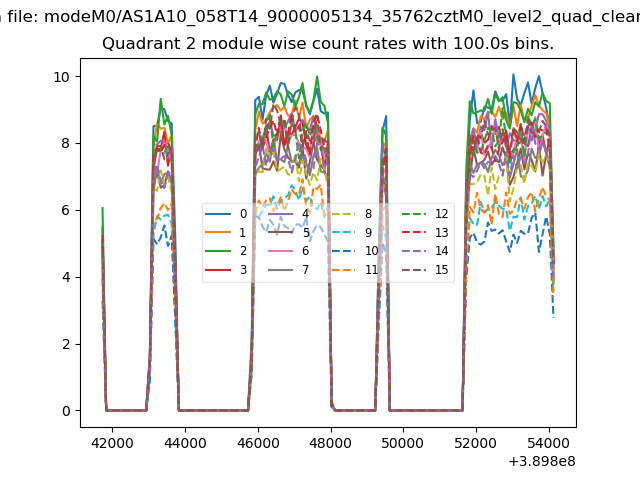
| Module-wise count rates for Quadrant B Data is divided into 100 sec bins |
 |
 |
| Module-wise count rates for Quadrant C Data is divided into 100 sec bins |
 |
 |
| Module-wise count rates for Quadrant D Data is divided into 100 sec bins |
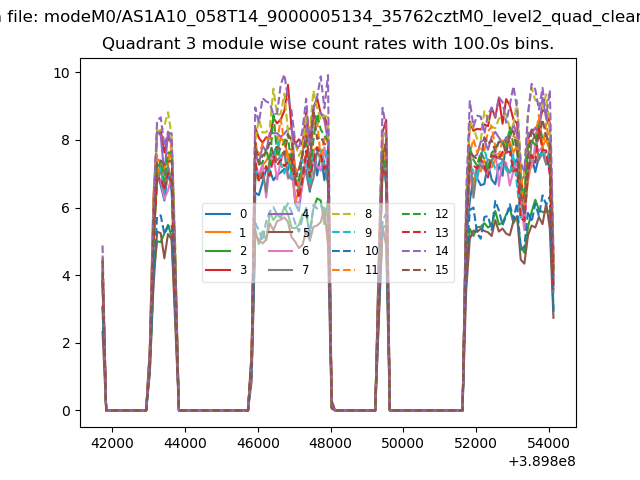 |
 |
| Parameter | Plot |
|---|---|
| CZT HV Monitor | 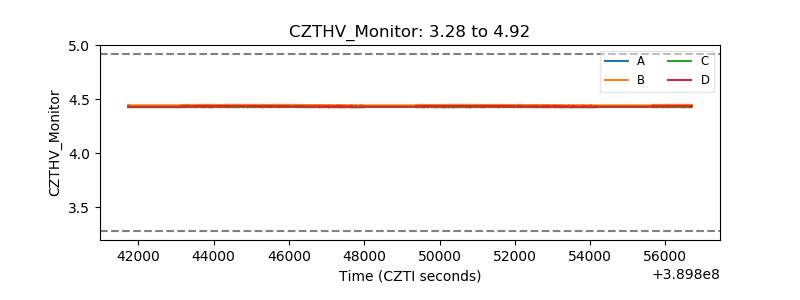 |
| D_VDD | 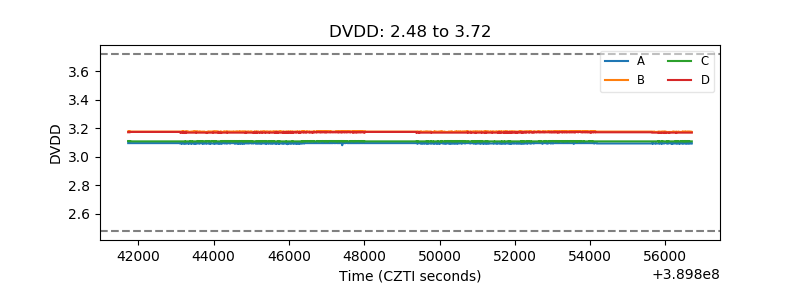 |
| Temperature 1 | 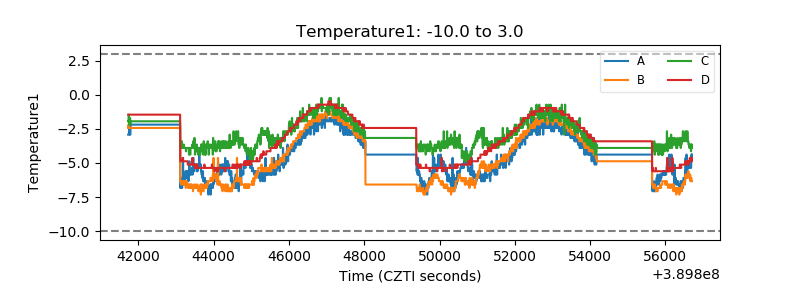 |
| Veto HV Monitor | 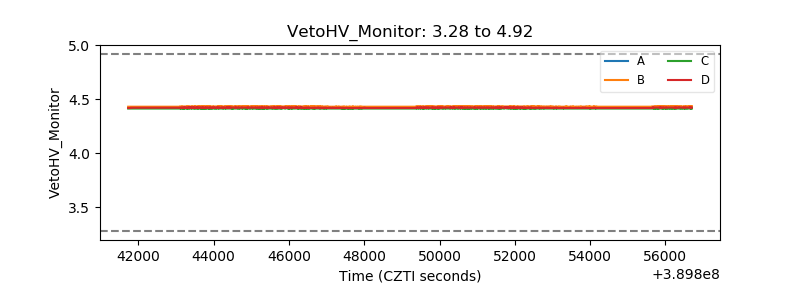 |
| Veto LLD | 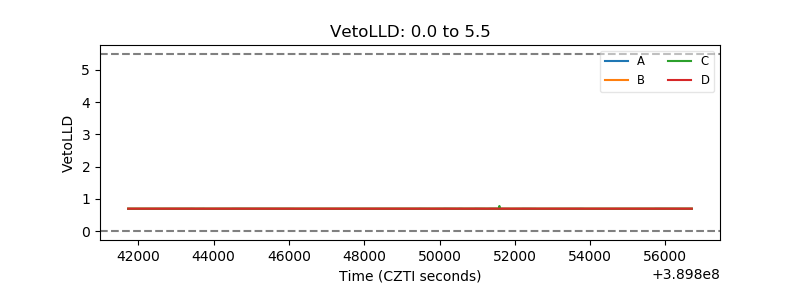 |
| Alpha Counter | 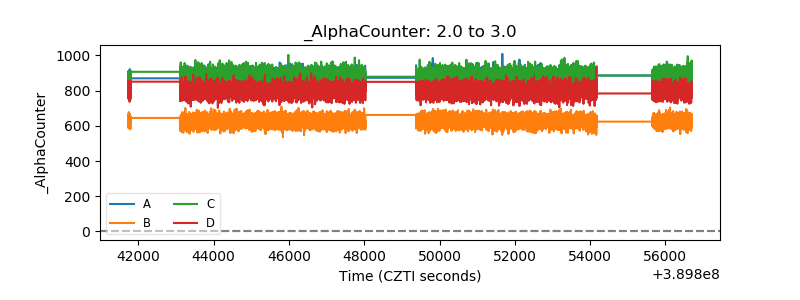 |
| _CPM_Rate | 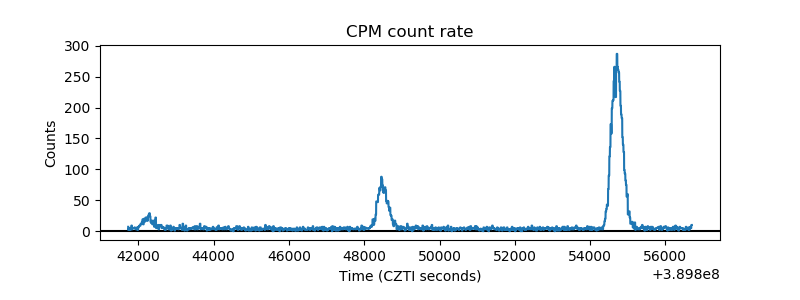 |
| CZT Counter | 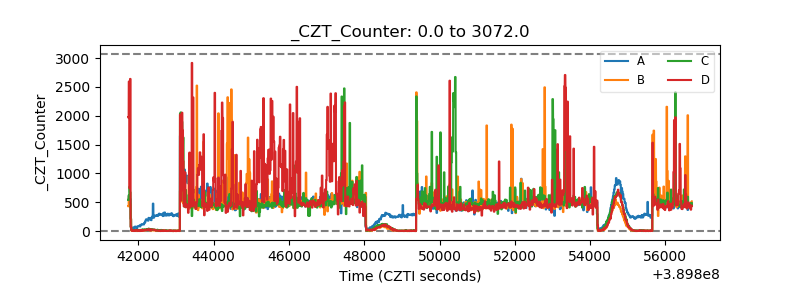 |
| +2.5 Volts monitor | 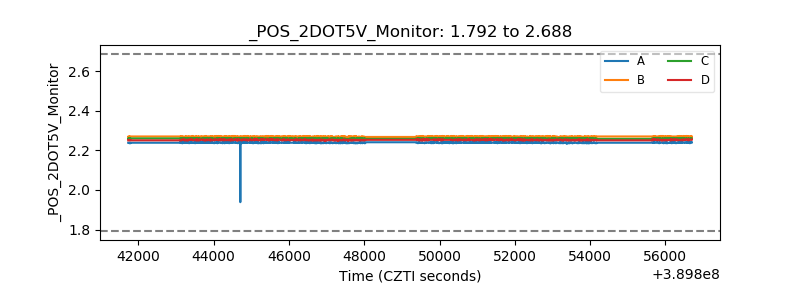 |
| +5 Volts monitor | 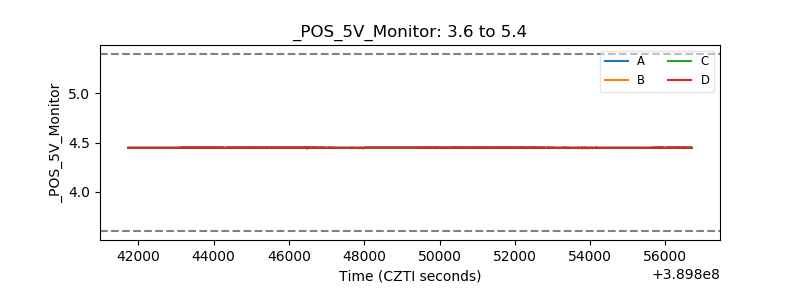 |
| _ROLL_ROT | 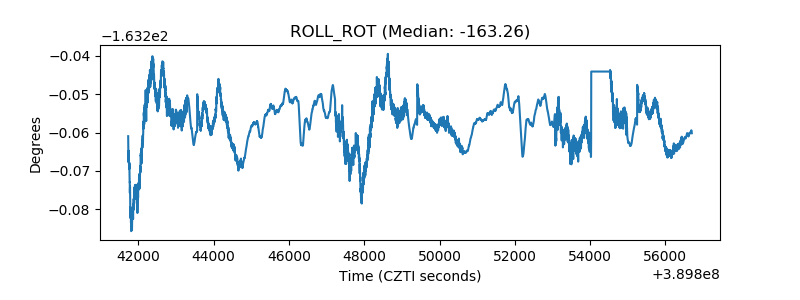 |
| _Roll_DEC | 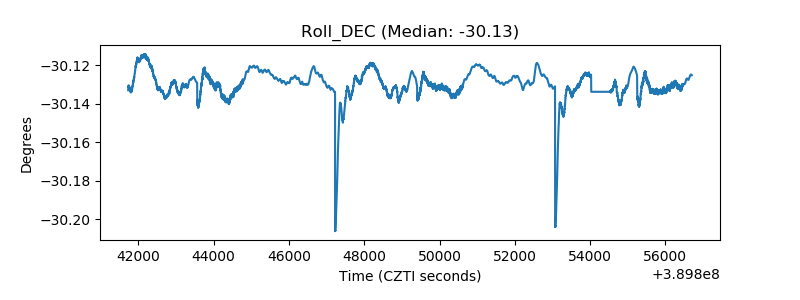 |
| _Roll_RA | 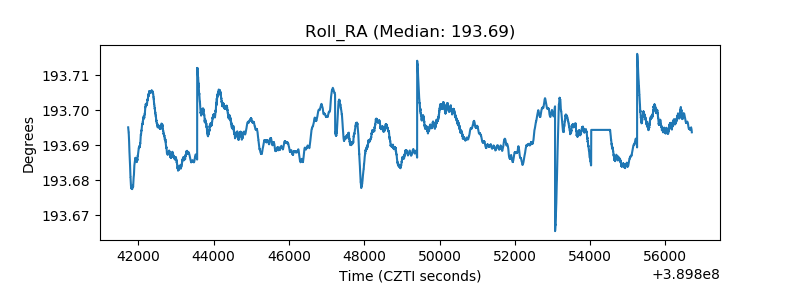 |
| Veto Counter | 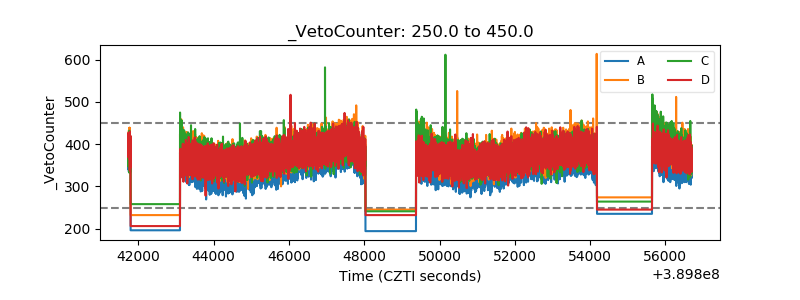 |