| Param | Original file | Final file |
|---|---|---|
| Filename | modeM0/AS1A10_058T14_9000005134_35760cztM0_level2.evt | modeM0/AS1A10_058T14_9000005134_35760cztM0_level2_quad_clean.evt |
| Size (bytes) | 622,463,040 | 74,952,000 |
| Size | 593.6 MB | 71.5 MB |
| Events in quadrant A | 4,266,210 | 479,750 |
| Events in quadrant B | 3,597,331 | 485,869 |
| Events in quadrant C | 3,429,245 | 469,903 |
| Events in quadrant D | 7,125,063 | 386,359 |
| Mode SS | |||
|---|---|---|---|
| Quadrant | BADHDUFLAG | Total packets | Discarded packets |
| A | 0 | 130 | 0 |
| B | 0 | 130 | 0 |
| C | 0 | 130 | 0 |
| D | 0 | 130 | 0 |
| Mode M9 | |||
|---|---|---|---|
| Quadrant | BADHDUFLAG | Total packets | Discarded packets |
| A | 0 | 27 | 0 |
| B | 0 | 27 | 0 |
| C | 0 | 27 | 0 |
| D | 0 | 27 | 0 |
| Mode M0 | |||
|---|---|---|---|
| Quadrant | BADHDUFLAG | Total packets | Discarded packets |
| A | 0 | 17658 | 3 |
| B | 0 | 14862 | 2 |
| C | 0 | 14075 | 2 |
| D | 0 | 25551 | 2 |
| Quadrant | Total seconds | Saturated seconds | Saturation percentage |
|---|---|---|---|
| A | 6412 | 9 | 0.140362% |
| B | 6412 | 93 | 1.450405% |
| C | 6412 | 82 | 1.278852% |
| D | 6412 | 1422 | 22.177168% |
Noise dominated data is calculated using 1-second bins in cleaned event files. If a bin has >2000 counts, and if more than 50% of those come from <1% of pixels, then it is considered to be noise-dominated and hence unusable.
| Quadrant | # 1 sec bins | Bins with >0 counts | Bins with >2000 counts | High rate bins dominated by noise | Noise dominated (total time) | Noise dominated (detector-on time) | Marked lightcurve |
|---|---|---|---|---|---|---|---|
| A | 9068 | 6414 | 1 | 1 | 0.01% | 0.02% | 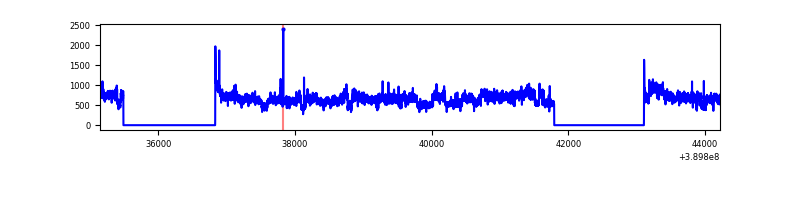 |
| B | 9068 | 6414 | 66 | 66 | 0.73% | 1.03% | 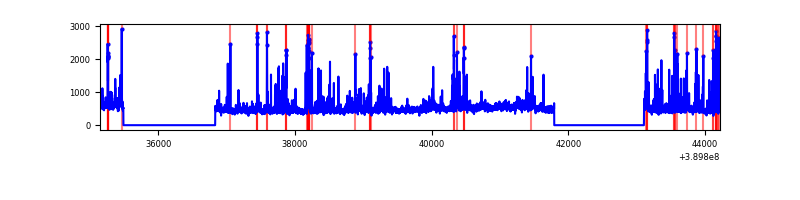 |
| C | 9068 | 6414 | 82 | 82 | 0.90% | 1.28% | 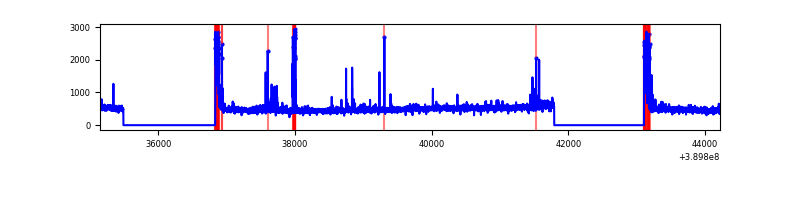 |
| D | 9068 | 6413 | 1437 | 1437 | 15.85% | 22.41% | 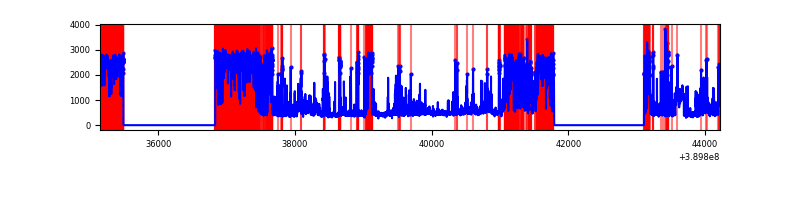 |
Top three noisy pixels from each quadrant. If the there are fewer than three noisy pixels in the level2.evt file, extra rows are filled as -1
| Pixel properties | Quadrant properties | ||||||
|---|---|---|---|---|---|---|---|
| Quadrant | DetID | PixID | Counts | Sigma | Mean | Median | Sigma |
| A | 15 | 223 | 1233354 | 8316.35 | 733 | 719 | 148.2 |
| A | 10 | 83 | 167549 | 1125.57 | 733 | 719 | 148.2 |
| A | 13 | 6 | 17671 | 114.37 | 733 | 719 | 148.2 |
| B | 5 | 172 | 327190 | 2312.86 | 725 | 707 | 141.2 |
| B | 5 | 255 | 133540 | 941.01 | 725 | 707 | 141.2 |
| B | 0 | 213 | 113758 | 800.87 | 725 | 707 | 141.2 |
| C | 15 | 214 | 267602 | 1608.17 | 706 | 710 | 166.0 |
| C | 0 | 10 | 236143 | 1418.61 | 706 | 710 | 166.0 |
| C | 0 | 207 | 91605 | 547.69 | 706 | 710 | 166.0 |
| D | 1 | 52 | 3125747 | 19726.45 | 650 | 631 | 158.4 |
| D | 7 | 80 | 556846 | 3510.96 | 650 | 631 | 158.4 |
| D | 13 | 249 | 534695 | 3371.14 | 650 | 631 | 158.4 |
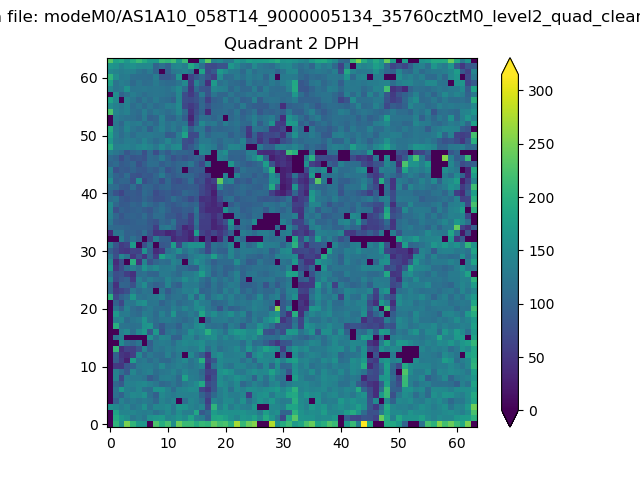
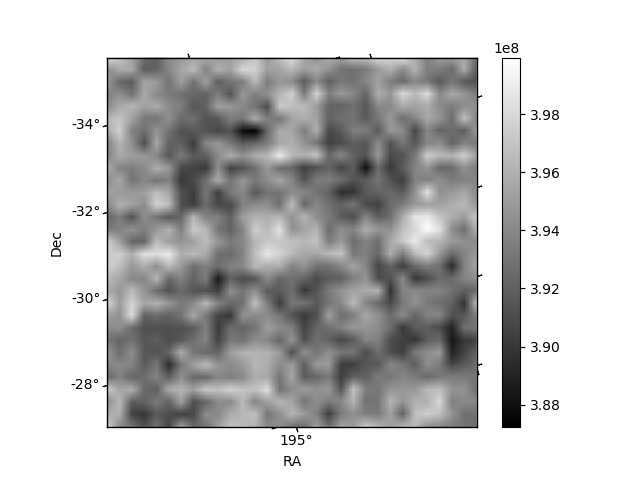
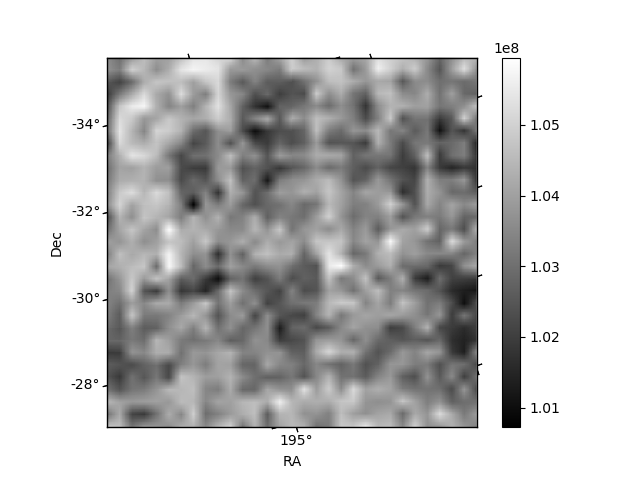
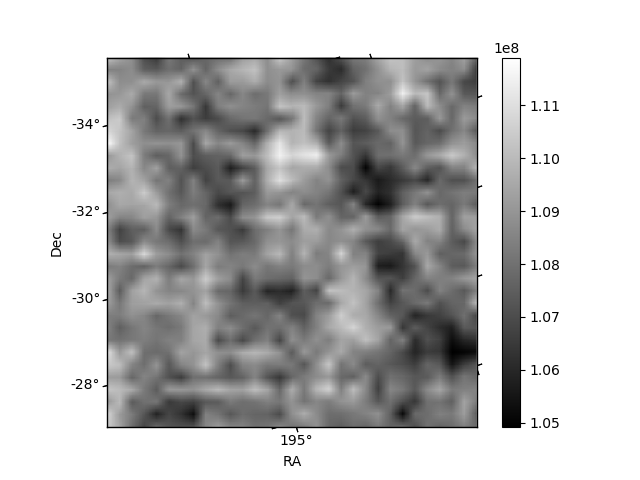
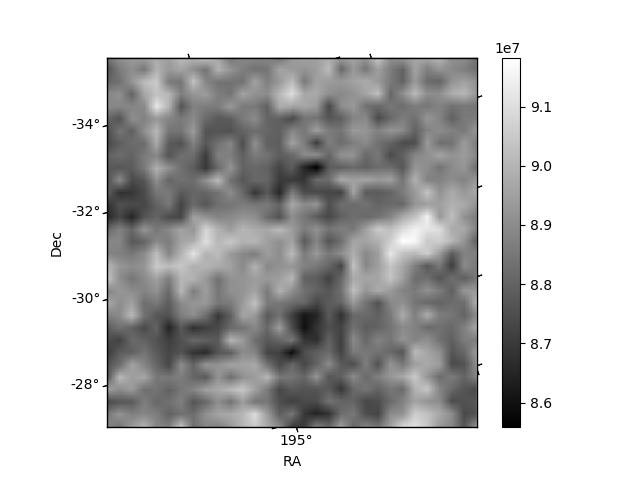
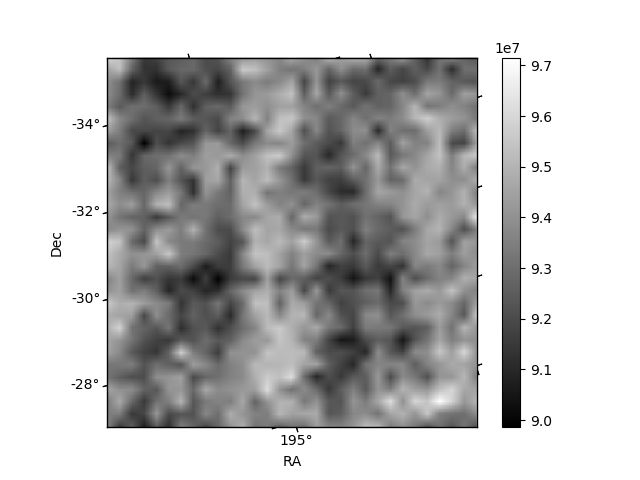
Histogram calculated using DETX and DETY for each event in the final _common_clean file
| Quadrant A | 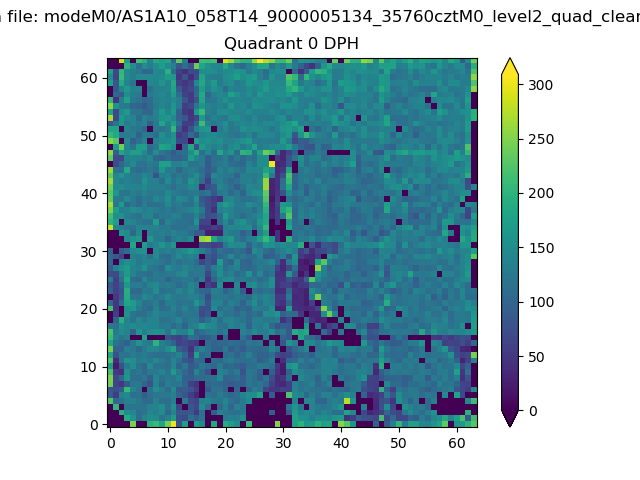 |
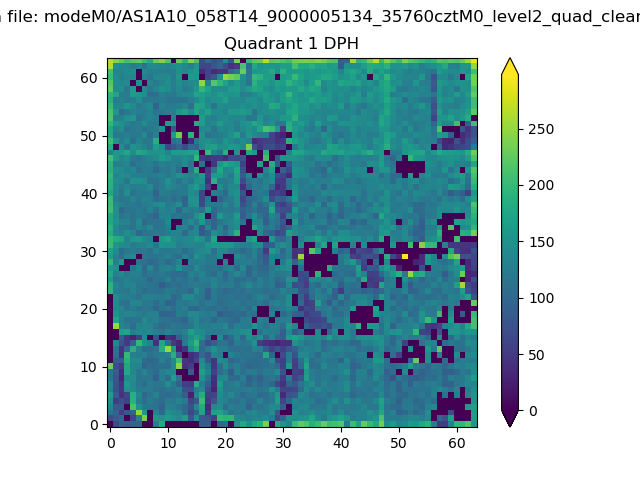 |
Quadrant B |
|---|---|---|---|
| Quadrant D | 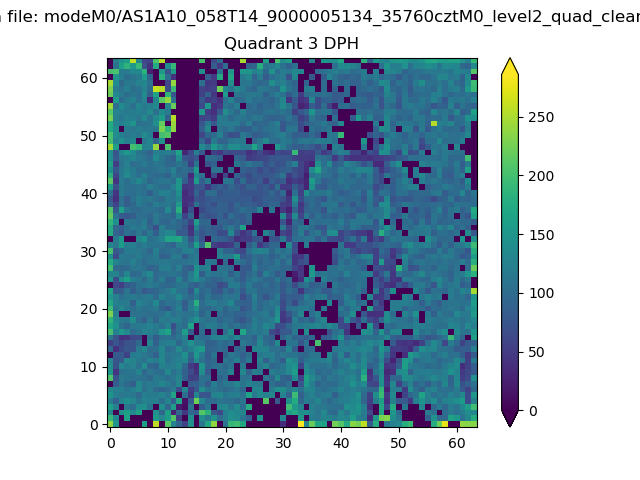 |
 |
Quadrant C |
| Plot type | Count rate plots | Images |
|---|---|---|
| Comparison with Poisson distribution Blue bars denote a histogram of data divided into 1 sec bins. Red curve is a Poisson curve with rate = median count rate of data. |
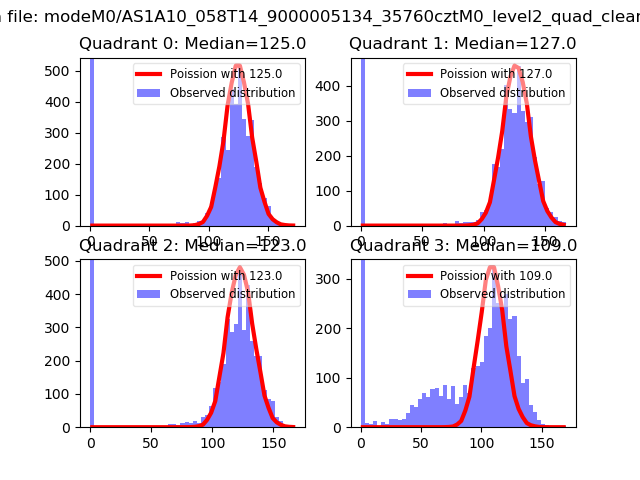 |
 |
| Quadrant-wise count rates Data is divided into 100 sec bins |
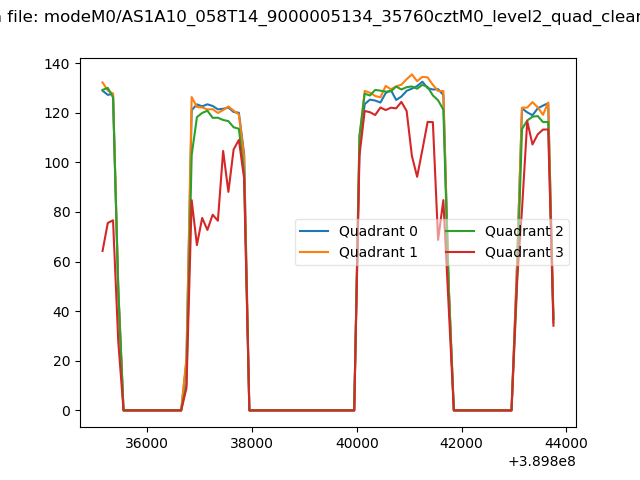 |
|
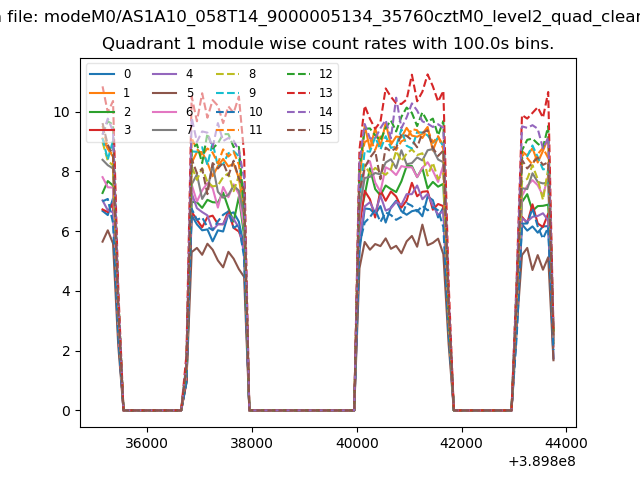
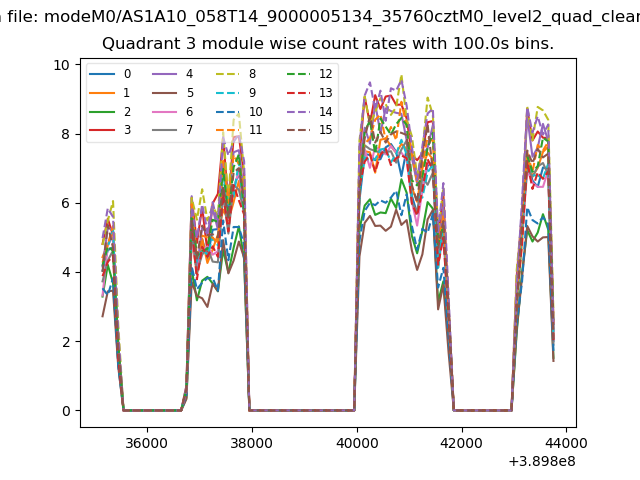
| Module-wise count rates for Quadrant A Data is divided into 100 sec bins |
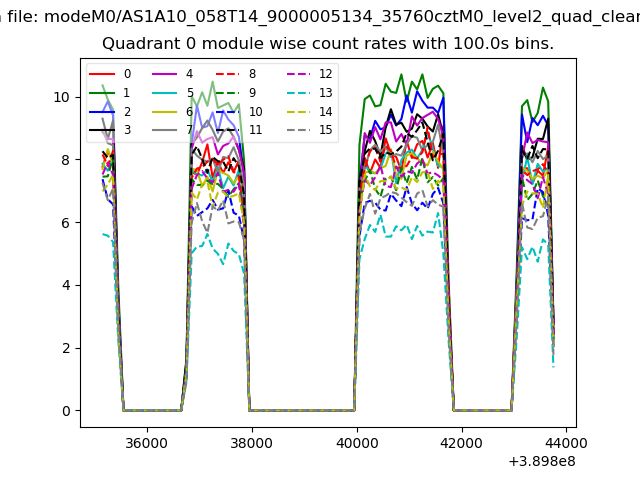 |
 |
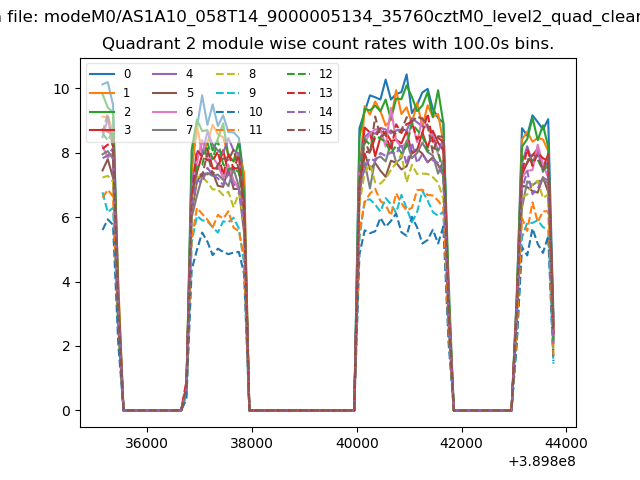
| Module-wise count rates for Quadrant B Data is divided into 100 sec bins |
 |
 |
| Module-wise count rates for Quadrant C Data is divided into 100 sec bins |
 |
 |
| Module-wise count rates for Quadrant D Data is divided into 100 sec bins |
 |
 |
| Parameter | Plot |
|---|---|
| CZT HV Monitor | 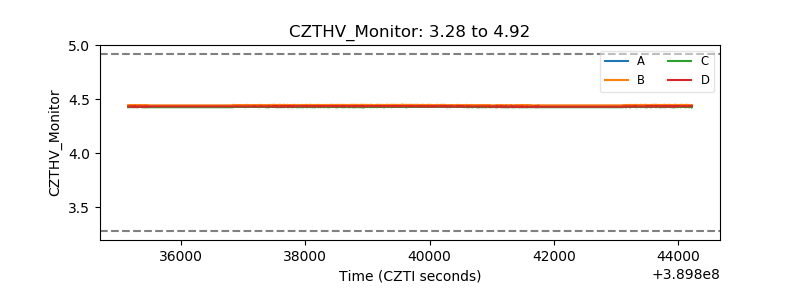 |
| D_VDD | 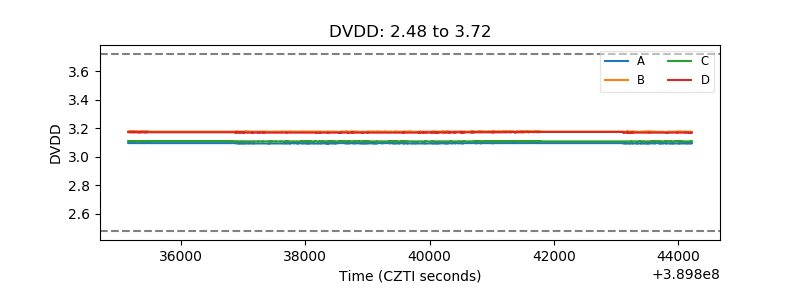 |
| Temperature 1 | 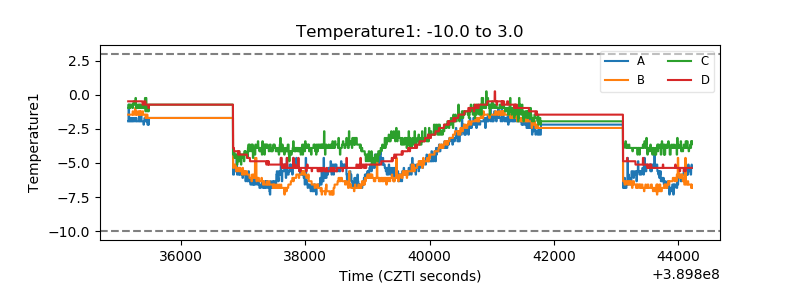 |
| Veto HV Monitor | 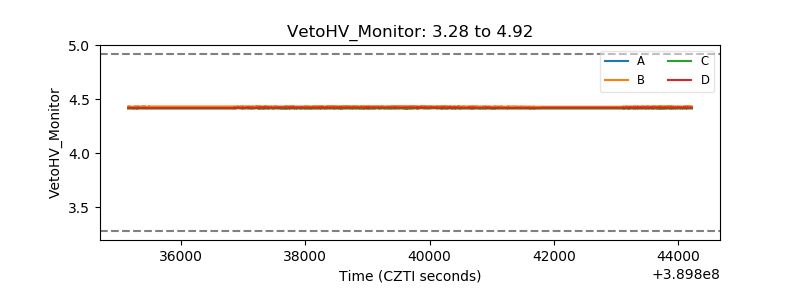 |
| Veto LLD | 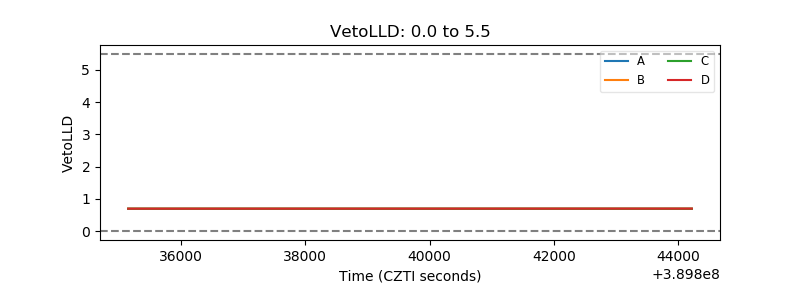 |
| Alpha Counter | 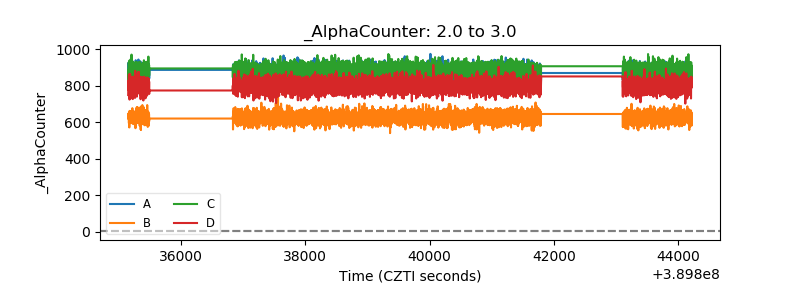 |
| _CPM_Rate | 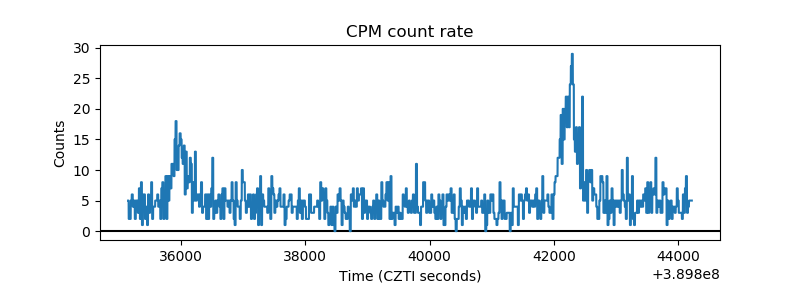 |
| CZT Counter | 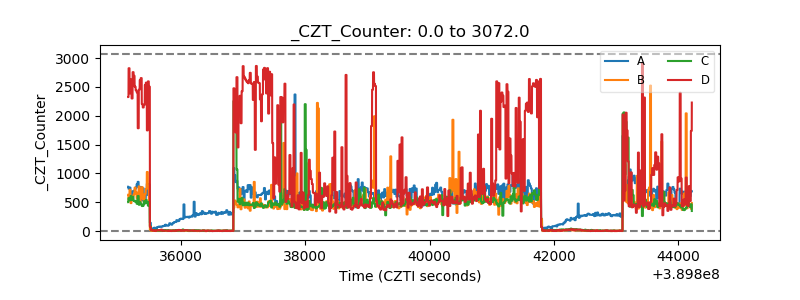 |
| +2.5 Volts monitor | 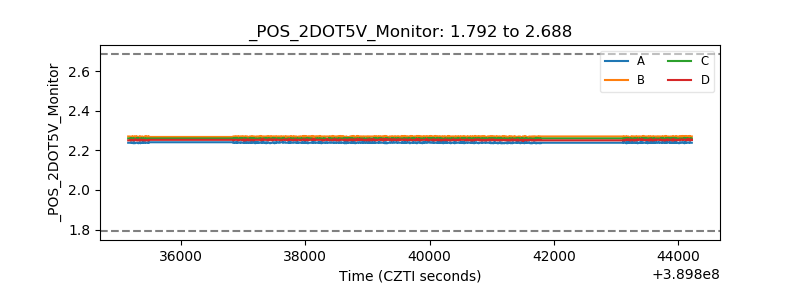 |
| +5 Volts monitor | 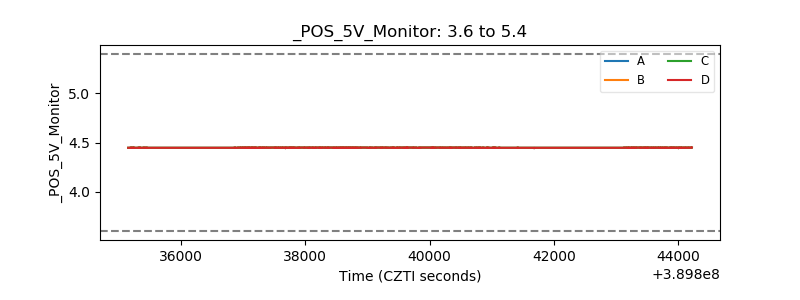 |
| _ROLL_ROT | 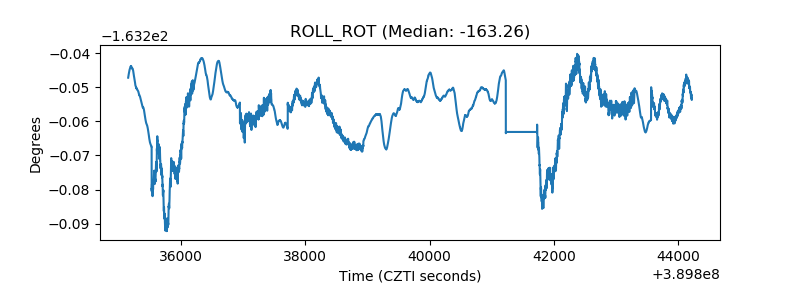 |
| _Roll_DEC | 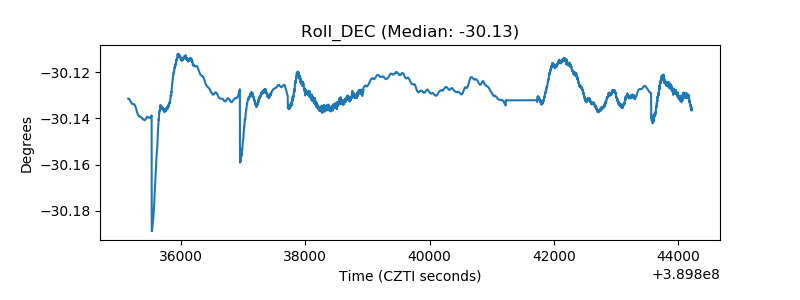 |
| _Roll_RA | 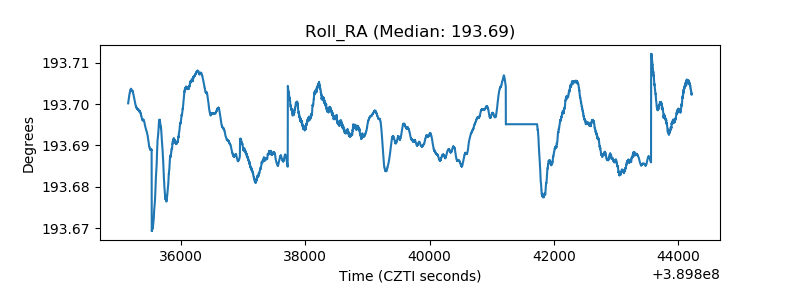 |
| Veto Counter | 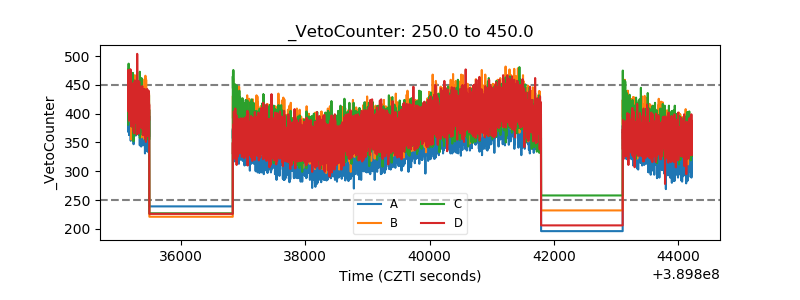 |