| Param | Original file | Final file |
|---|---|---|
| Filename | modeM0/AS1A10_058T14_9000005134cztM0_level2.evt | modeM0/AS1A10_058T14_9000005134cztM0_level2_quad_clean.evt |
| Size (bytes) | 5,325,206,400 | 845,539,200 |
| Size | 5.0 GB | 806.4 MB |
| Events in quadrant A | 33,345,141 | 5,528,823 |
| Events in quadrant B | 38,371,632 | 5,507,914 |
| Events in quadrant C | 34,151,286 | 5,339,177 |
| Events in quadrant D | 51,187,480 | 4,932,149 |
| Mode SS | |||
|---|---|---|---|
| Quadrant | BADHDUFLAG | Total packets | Discarded packets |
| A | 0 | 1216 | 0 |
| B | 0 | 1216 | 0 |
| C | 0 | 1216 | 0 |
| D | 0 | 1216 | 0 |
| Mode M9 | |||
|---|---|---|---|
| Quadrant | BADHDUFLAG | Total packets | Discarded packets |
| A | 0 | 227 | 0 |
| B | 0 | 227 | 0 |
| C | 0 | 227 | 0 |
| D | 0 | 228 | 0 |
| Mode M0 | |||
|---|---|---|---|
| Quadrant | BADHDUFLAG | Total packets | Discarded packets |
| A | 0 | 139822 | 0 |
| B | 0 | 154168 | 0 |
| C | 0 | 139274 | 0 |
| D | 0 | 194331 | 0 |
| Quadrant | Total seconds | Saturated seconds | Saturation percentage |
|---|---|---|---|
| A | 62945 | 113 | 0.179522% |
| B | 62945 | 2011 | 3.194853% |
| C | 62945 | 796 | 1.264596% |
| D | 62945 | 5164 | 8.203988% |
Noise dominated data is calculated using 1-second bins in cleaned event files. If a bin has >2000 counts, and if more than 50% of those come from <1% of pixels, then it is considered to be noise-dominated and hence unusable.
| Quadrant | # 1 sec bins | Bins with >0 counts | Bins with >2000 counts | High rate bins dominated by noise | Noise dominated (total time) | Noise dominated (detector-on time) | Marked lightcurve |
|---|---|---|---|---|---|---|---|
| A | 87000 | 62959 | 44 | 44 | 0.05% | 0.07% | 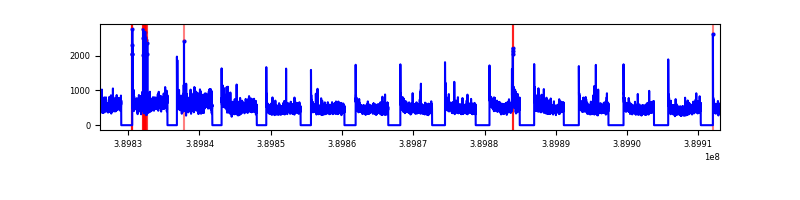 |
| B | 87000 | 62959 | 1420 | 1420 | 1.63% | 2.26% | 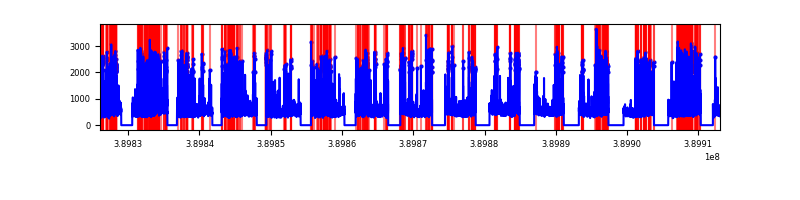 |
| C | 87000 | 62958 | 710 | 710 | 0.82% | 1.13% | 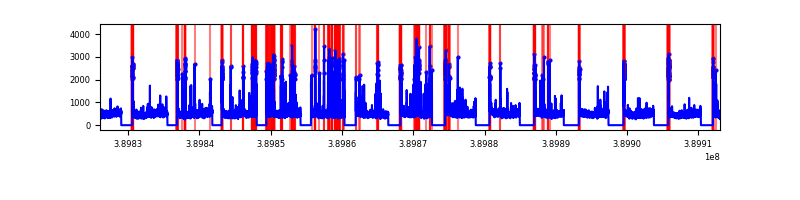 |
| D | 87000 | 62958 | 5477 | 5477 | 6.30% | 8.70% | 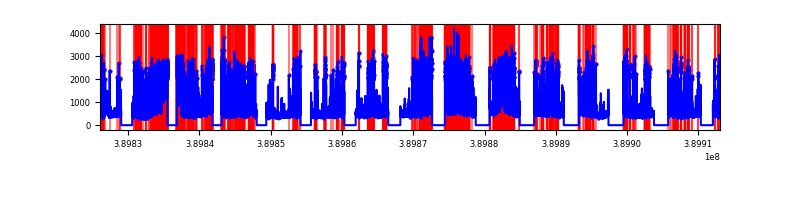 |
Top three noisy pixels from each quadrant. If the there are fewer than three noisy pixels in the level2.evt file, extra rows are filled as -1
| Pixel properties | Quadrant properties | ||||||
|---|---|---|---|---|---|---|---|
| Quadrant | DetID | PixID | Counts | Sigma | Mean | Median | Sigma |
| A | 15 | 223 | 2459993 | 1655.57 | 7454 | 7321 | 1481.5 |
| A | 10 | 83 | 1451879 | 975.09 | 7454 | 7321 | 1481.5 |
| A | 15 | 169 | 432409 | 286.94 | 7454 | 7321 | 1481.5 |
| B | 5 | 172 | 5622137 | 4083.05 | 7307 | 7123 | 1375.2 |
| B | 5 | 255 | 1566688 | 1134.06 | 7307 | 7123 | 1375.2 |
| B | 0 | 213 | 675600 | 486.09 | 7307 | 7123 | 1375.2 |
| C | 15 | 214 | 2584244 | 1589.15 | 7103 | 7157 | 1621.7 |
| C | 1 | 23 | 2132514 | 1310.6 | 7103 | 7157 | 1621.7 |
| C | 0 | 10 | 1166009 | 714.6 | 7103 | 7157 | 1621.7 |
| D | 1 | 52 | 13184259 | 7687.53 | 7009 | 6823 | 1714.1 |
| D | 7 | 80 | 2793539 | 1625.73 | 7009 | 6823 | 1714.1 |
| D | 13 | 249 | 2790777 | 1624.12 | 7009 | 6823 | 1714.1 |
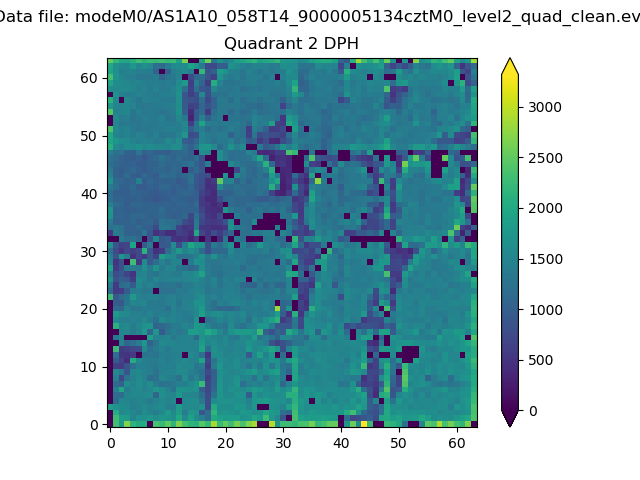
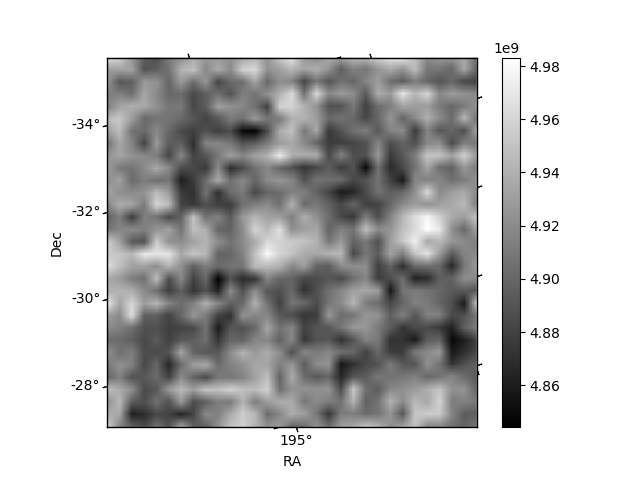
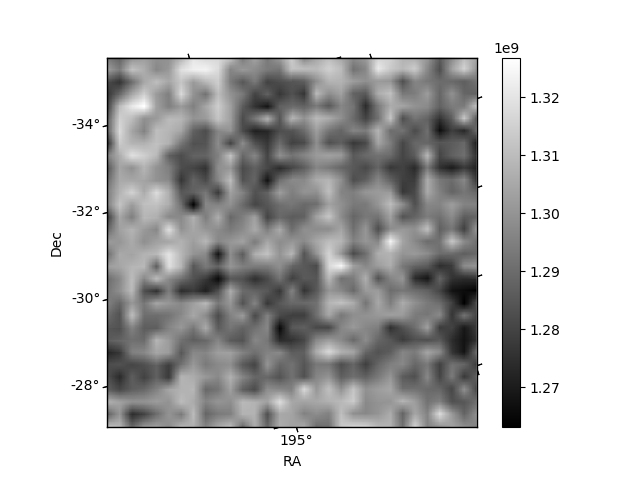
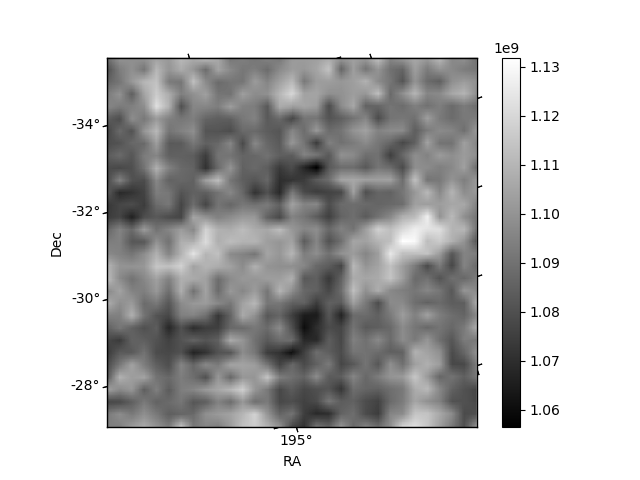
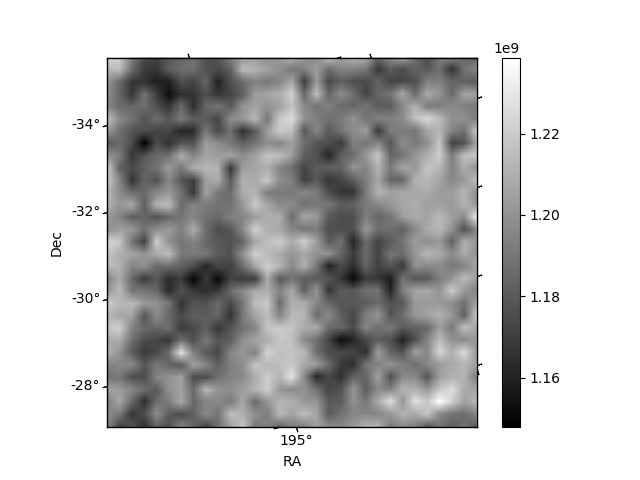
Histogram calculated using DETX and DETY for each event in the final _common_clean file
| Quadrant A | 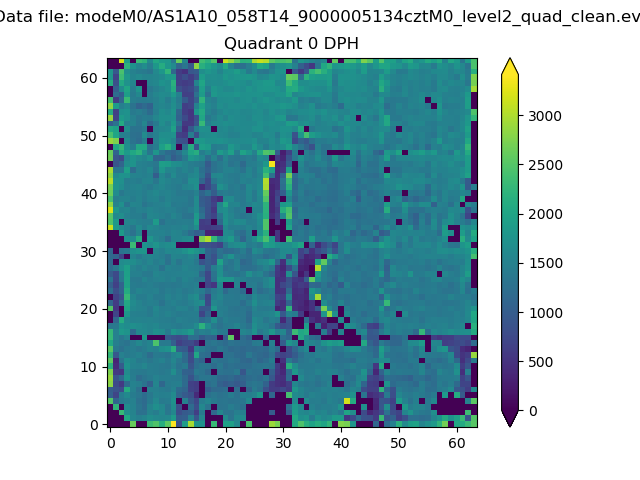 |
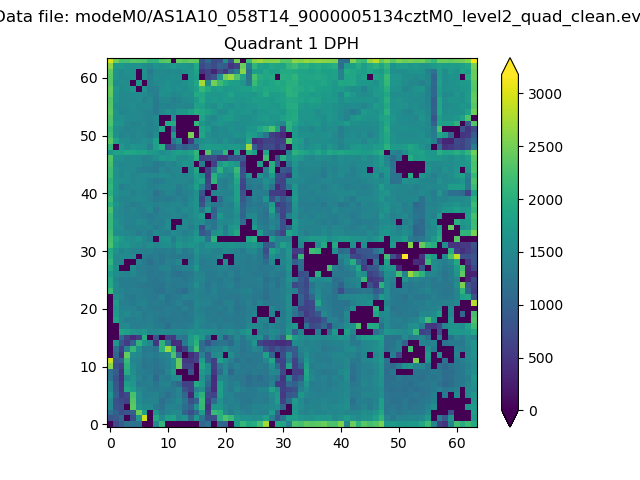 |
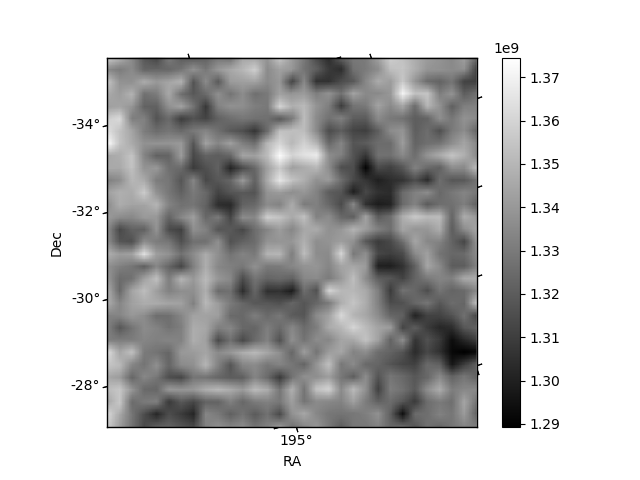
Quadrant B |
|---|---|---|---|
| Quadrant D | 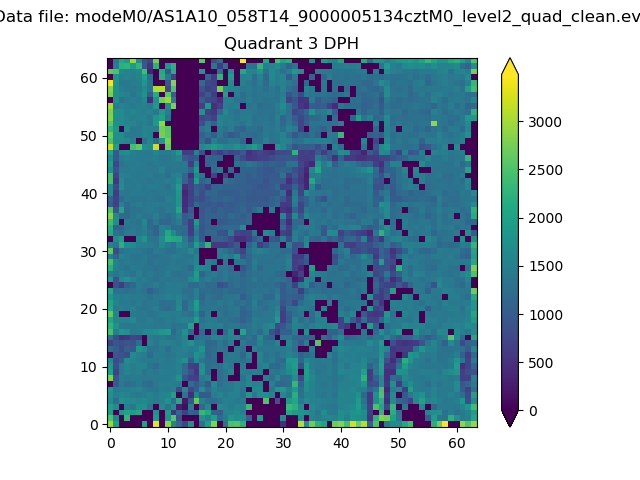 |
 |
Quadrant C |
| Plot type | Count rate plots | Images |
|---|---|---|
| Comparison with Poisson distribution Blue bars denote a histogram of data divided into 1 sec bins. Red curve is a Poisson curve with rate = median count rate of data. |
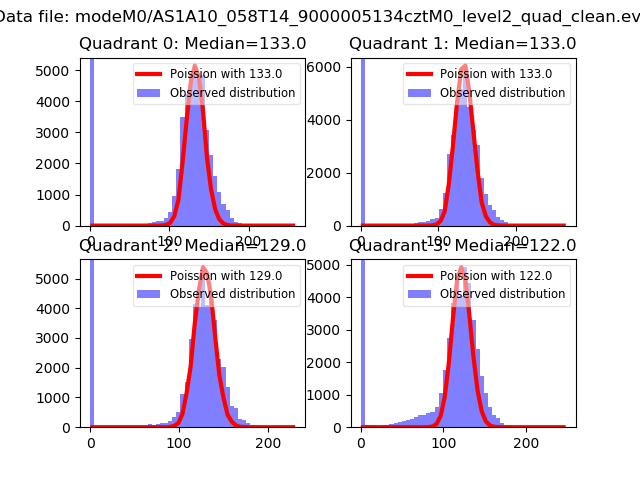 |
 |
| Quadrant-wise count rates Data is divided into 100 sec bins |
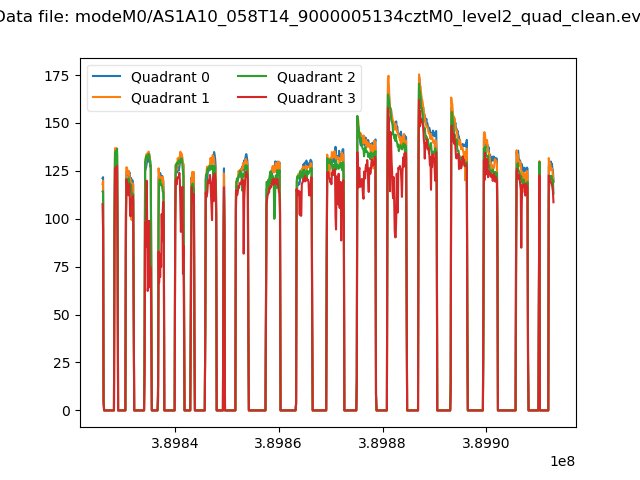 |
|
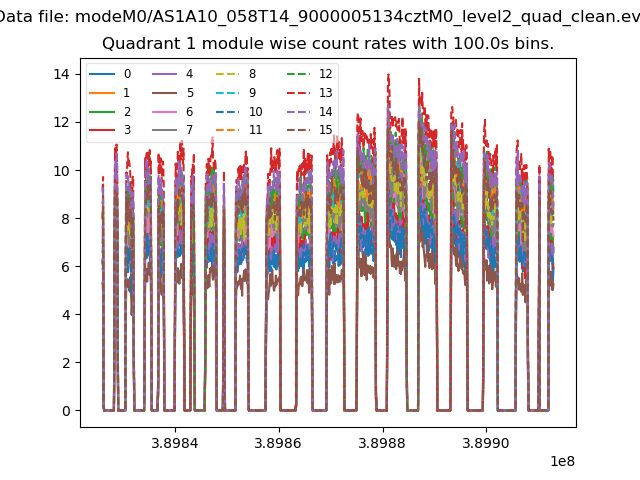
| Module-wise count rates for Quadrant A Data is divided into 100 sec bins |
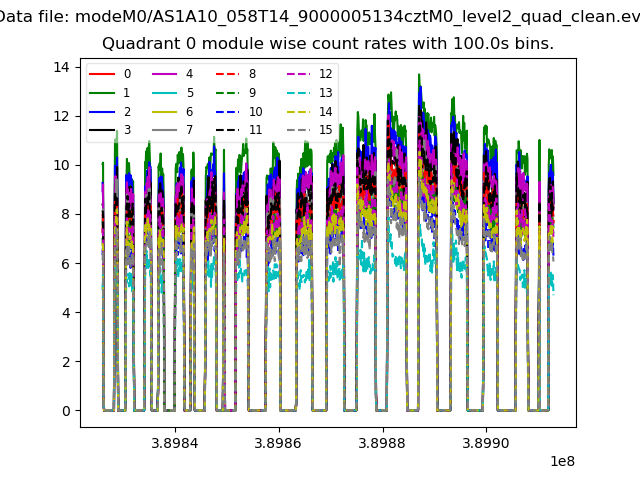 |
 |
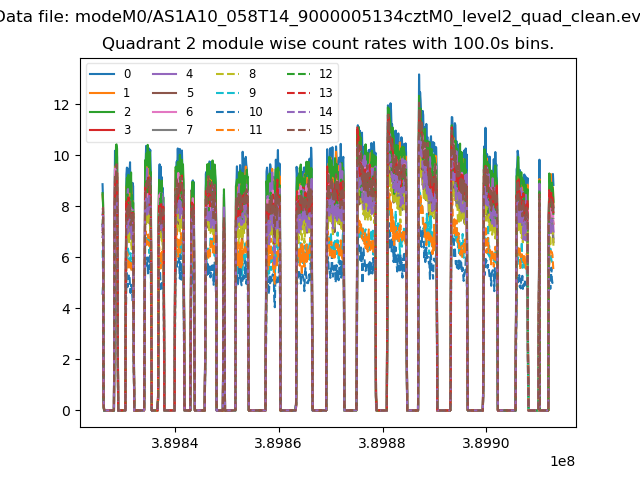
| Module-wise count rates for Quadrant B Data is divided into 100 sec bins |
 |
 |
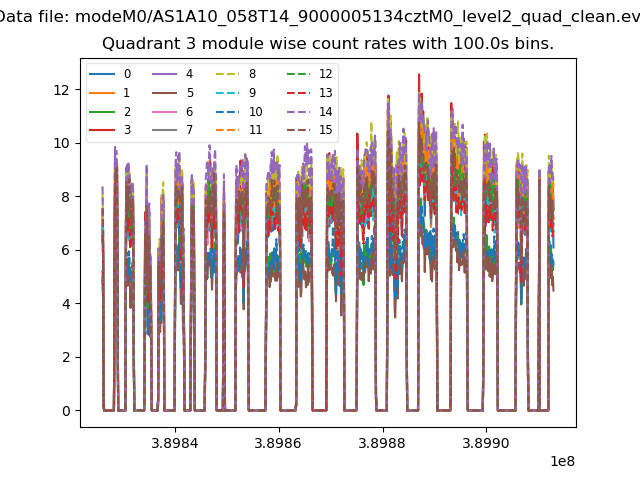
| Module-wise count rates for Quadrant C Data is divided into 100 sec bins |
 |
 |
| Module-wise count rates for Quadrant D Data is divided into 100 sec bins |
 |
 |
| Parameter | Plot |
|---|---|
| CZT HV Monitor |  |
| D_VDD | 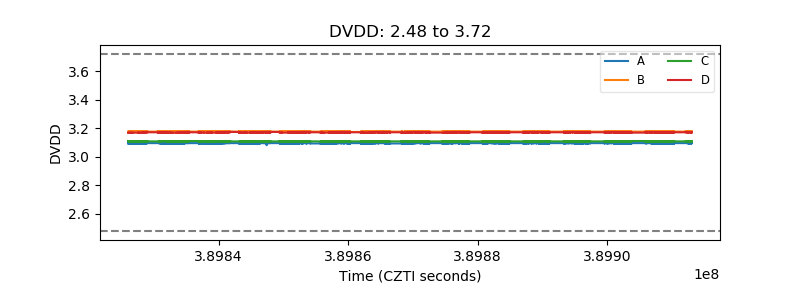 |
| Temperature 1 | 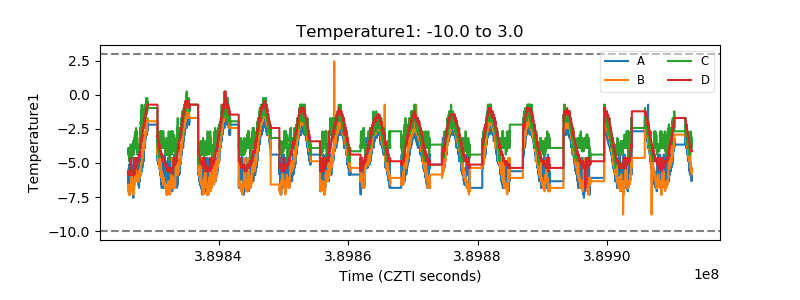 |
| Veto HV Monitor | 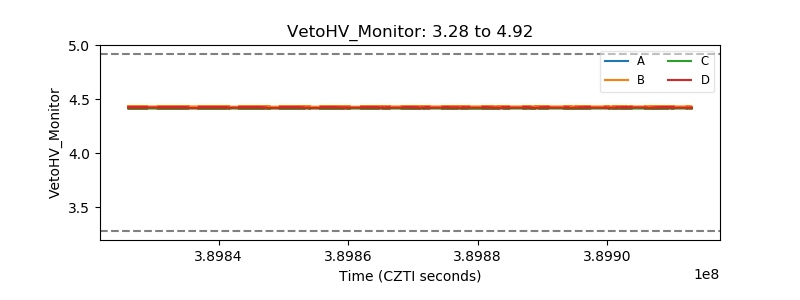 |
| Veto LLD | 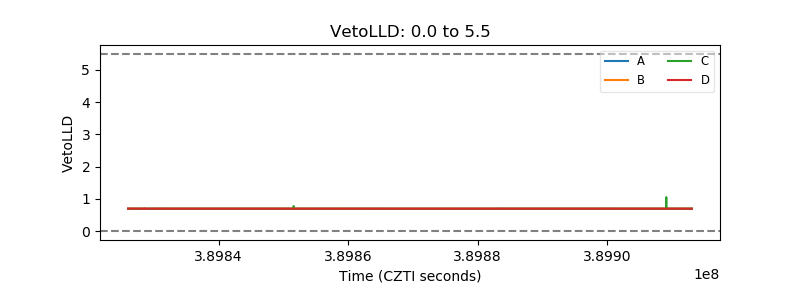 |
| Alpha Counter | 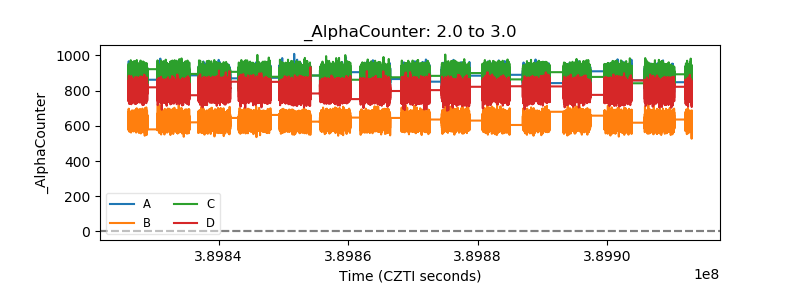 |
| _CPM_Rate | 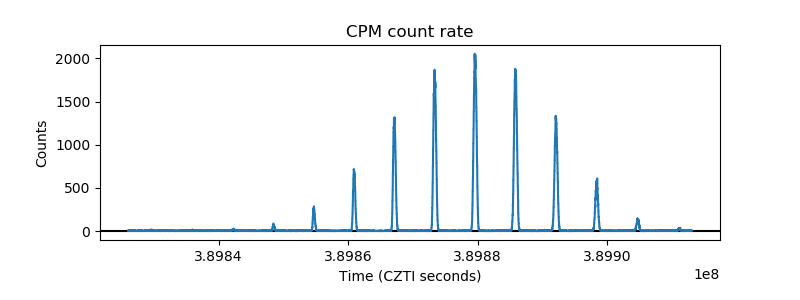 |
| CZT Counter |  |
| +2.5 Volts monitor | 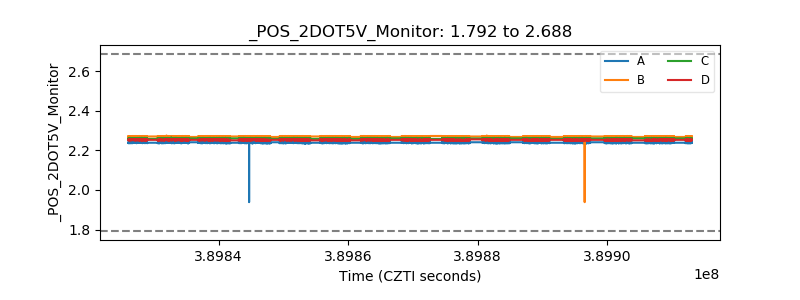 |
| +5 Volts monitor | 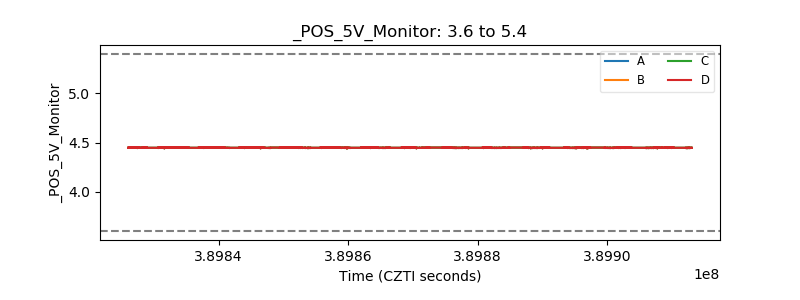 |
| _ROLL_ROT | 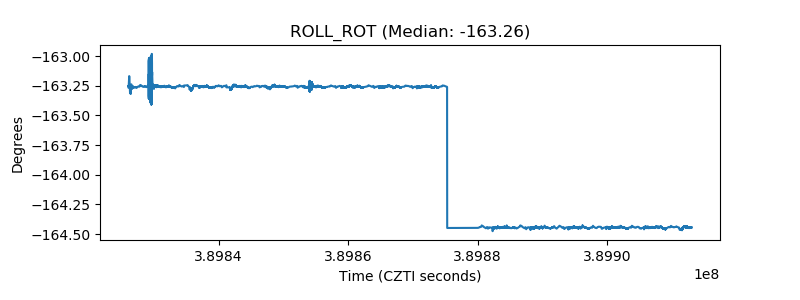 |
| _Roll_DEC | 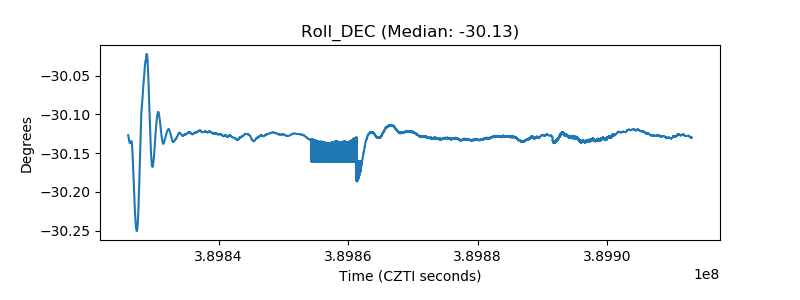 |
| _Roll_RA | 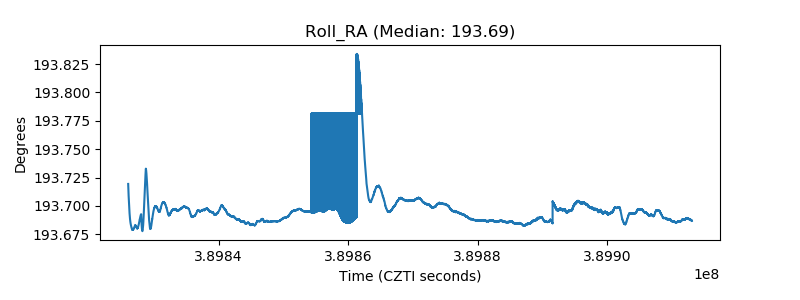 |
| Veto Counter | 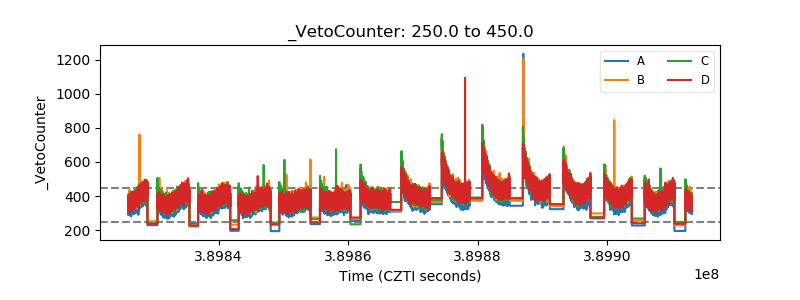 |