| Param | Original file | Final file |
|---|---|---|
| Filename | modeM0/AS1A09_143T10_9000005130_35753cztM0_level2.evt | modeM0/AS1A09_143T10_9000005130_35753cztM0_level2_quad_clean.evt |
| Size (bytes) | 232,136,640 | 57,628,800 |
| Size | 221.4 MB | 55.0 MB |
| Events in quadrant A | 1,435,023 | 401,271 |
| Events in quadrant B | 1,544,315 | 400,313 |
| Events in quadrant C | 1,620,254 | 381,777 |
| Events in quadrant D | 2,240,163 | 363,038 |
| Mode M0 | |||
|---|---|---|---|
| Quadrant | BADHDUFLAG | Total packets | Discarded packets |
| A | 0 | 5990 | 1 |
| B | 0 | 6297 | 1 |
| C | 0 | 6488 | 1 |
| D | 0 | 8552 | 1 |
| Mode SS | |||
|---|---|---|---|
| Quadrant | BADHDUFLAG | Total packets | Discarded packets |
| A | 0 | 56 | 0 |
| B | 0 | 56 | 0 |
| C | 0 | 56 | 0 |
| D | 0 | 56 | 0 |
| Mode M9 | |||
|---|---|---|---|
| Quadrant | BADHDUFLAG | Total packets | Discarded packets |
| A | 0 | 1 | 0 |
| B | 0 | 1 | 0 |
| C | 0 | 1 | 0 |
| D | 0 | 2 | 0 |
| Quadrant | Total seconds | Saturated seconds | Saturation percentage |
|---|---|---|---|
| A | 2777 | 5 | 0.180050% |
| B | 2777 | 21 | 0.756212% |
| C | 2777 | 74 | 2.664746% |
| D | 2777 | 155 | 5.581563% |
Noise dominated data is calculated using 1-second bins in cleaned event files. If a bin has >2000 counts, and if more than 50% of those come from <1% of pixels, then it is considered to be noise-dominated and hence unusable.
| Quadrant | # 1 sec bins | Bins with >0 counts | Bins with >2000 counts | High rate bins dominated by noise | Noise dominated (total time) | Noise dominated (detector-on time) | Marked lightcurve |
|---|---|---|---|---|---|---|---|
| A | 2777 | 2777 | 0 | 0 | 0.00% | 0.00% | 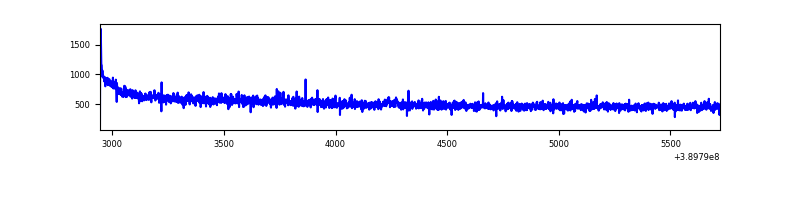 |
| B | 2777 | 2777 | 17 | 17 | 0.61% | 0.61% | 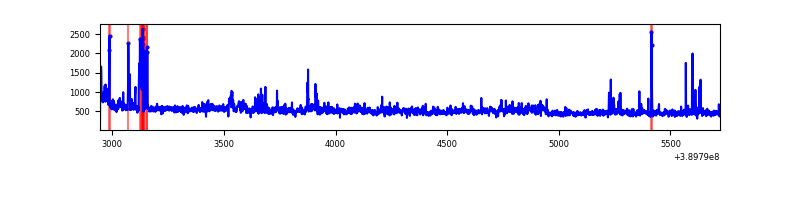 |
| C | 2777 | 2777 | 61 | 61 | 2.20% | 2.20% | 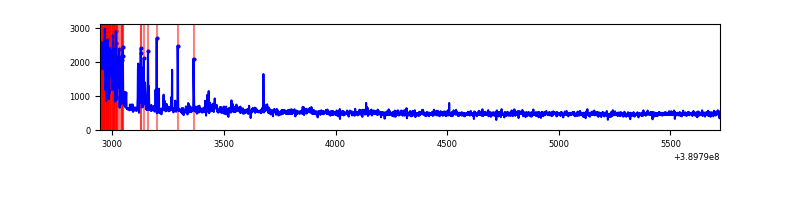 |
| D | 2777 | 2777 | 141 | 141 | 5.08% | 5.08% | 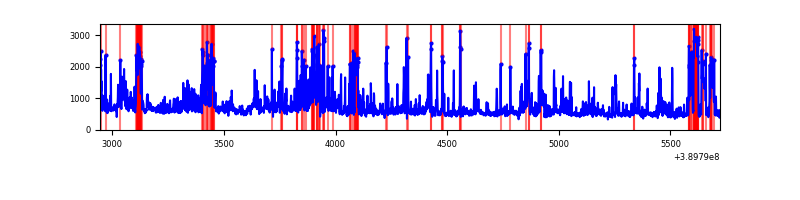 |
Top three noisy pixels from each quadrant. If the there are fewer than three noisy pixels in the level2.evt file, extra rows are filled as -1
| Pixel properties | Quadrant properties | ||||||
|---|---|---|---|---|---|---|---|
| Quadrant | DetID | PixID | Counts | Sigma | Mean | Median | Sigma |
| A | 10 | 83 | 85359 | 1229.59 | 343 | 337 | 69.1 |
| A | 8 | 144 | 8534 | 118.55 | 343 | 337 | 69.1 |
| A | 8 | 192 | 6042 | 82.51 | 343 | 337 | 69.1 |
| B | 5 | 255 | 63952 | 979.16 | 335 | 328 | 65.0 |
| B | 0 | 190 | 57147 | 874.43 | 335 | 328 | 65.0 |
| B | 0 | 155 | 32220 | 490.81 | 335 | 328 | 65.0 |
| C | 0 | 10 | 155274 | 2034.4 | 325 | 327 | 76.2 |
| C | 15 | 214 | 117446 | 1537.73 | 325 | 327 | 76.2 |
| C | 15 | 208 | 78258 | 1023.21 | 325 | 327 | 76.2 |
| D | 14 | 52 | 356346 | 4430.18 | 327 | 318 | 80.4 |
| D | 13 | 249 | 179956 | 2235.3 | 327 | 318 | 80.4 |
| D | 13 | 13 | 120924 | 1500.74 | 327 | 318 | 80.4 |
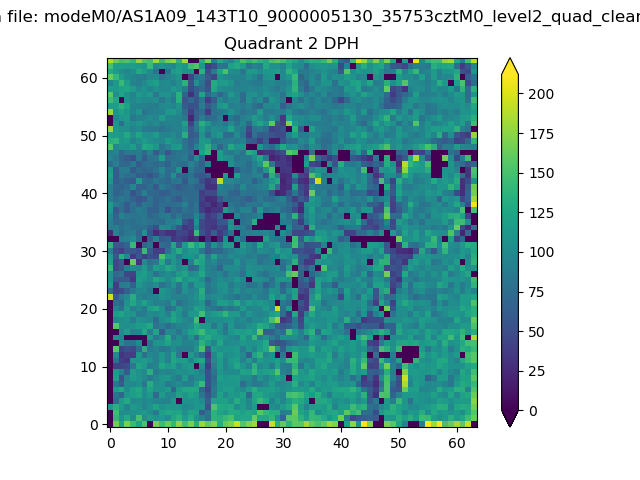
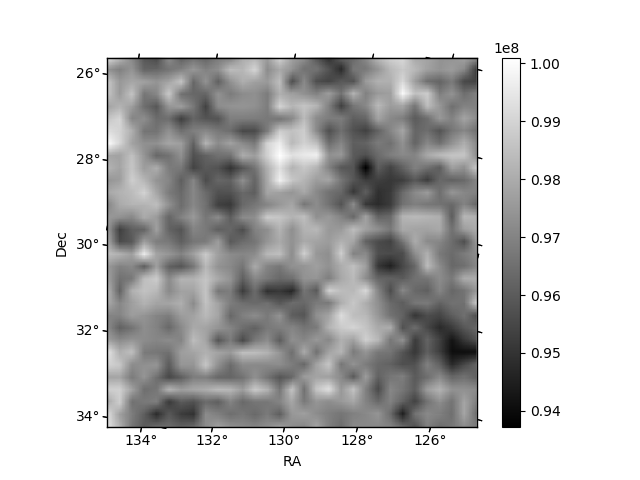
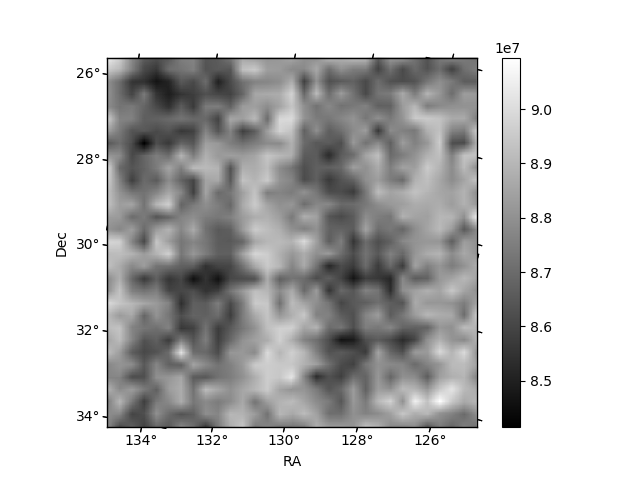
Histogram calculated using DETX and DETY for each event in the final _common_clean file
| Quadrant A | 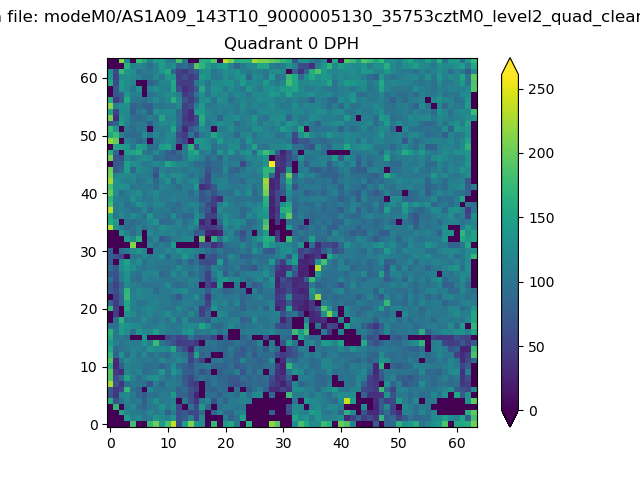 |
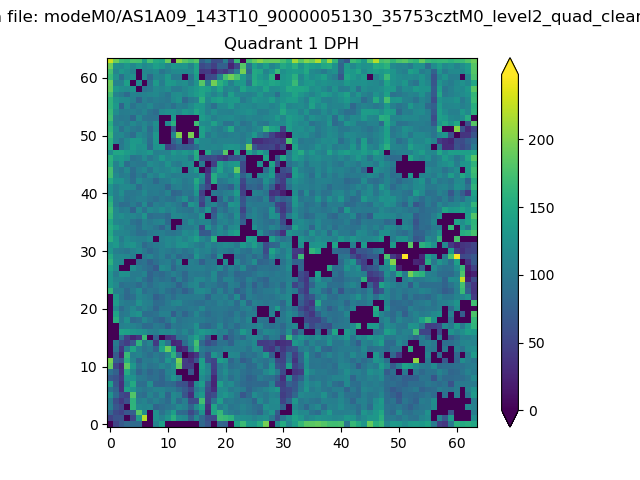 |
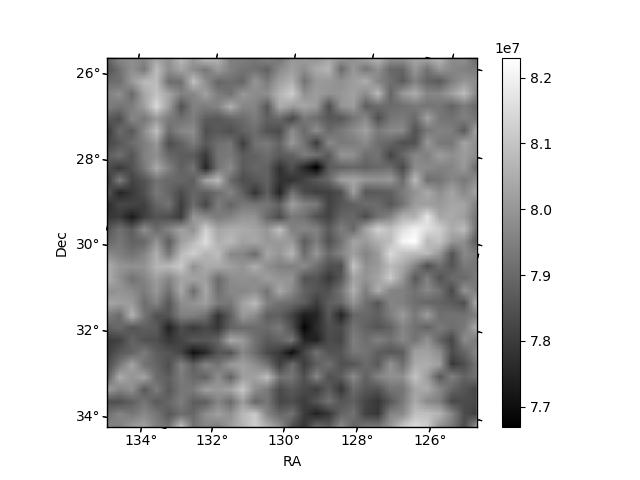
Quadrant B |
|---|---|---|---|
| Quadrant D | 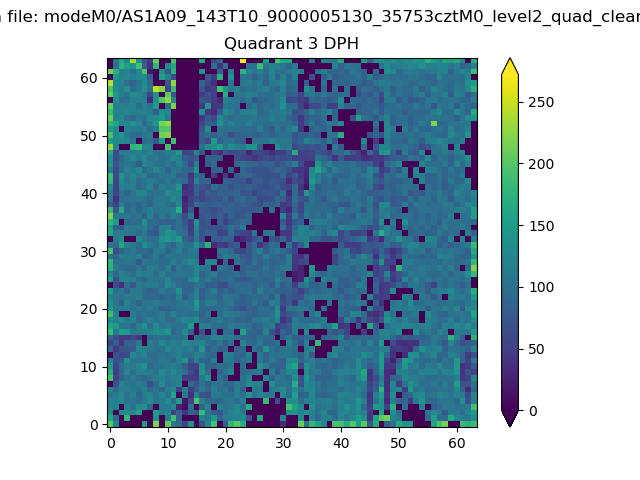 |
 |
Quadrant C |
| Plot type | Count rate plots | Images |
|---|---|---|
| Comparison with Poisson distribution Blue bars denote a histogram of data divided into 1 sec bins. Red curve is a Poisson curve with rate = median count rate of data. |
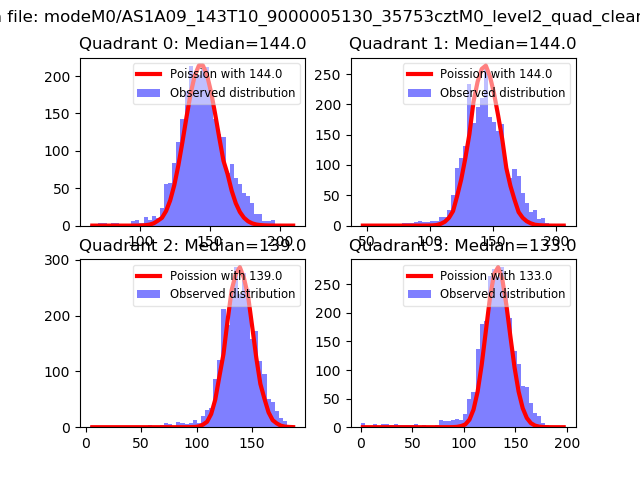 |
 |
| Quadrant-wise count rates Data is divided into 100 sec bins |
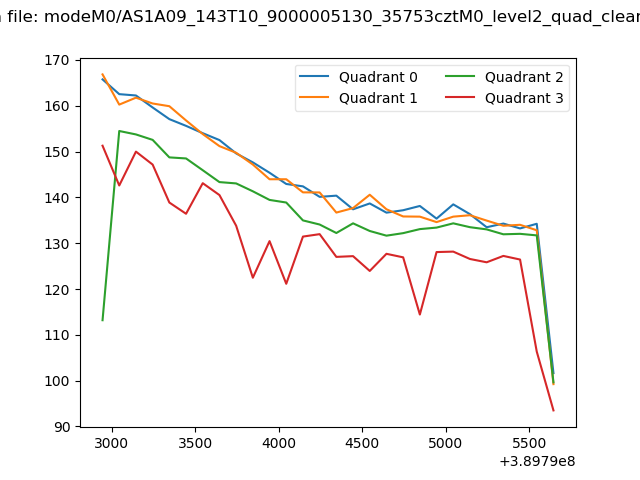 |
|
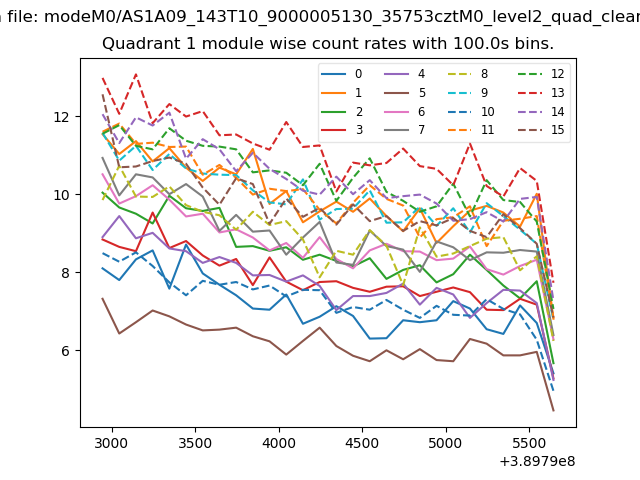
| Module-wise count rates for Quadrant A Data is divided into 100 sec bins |
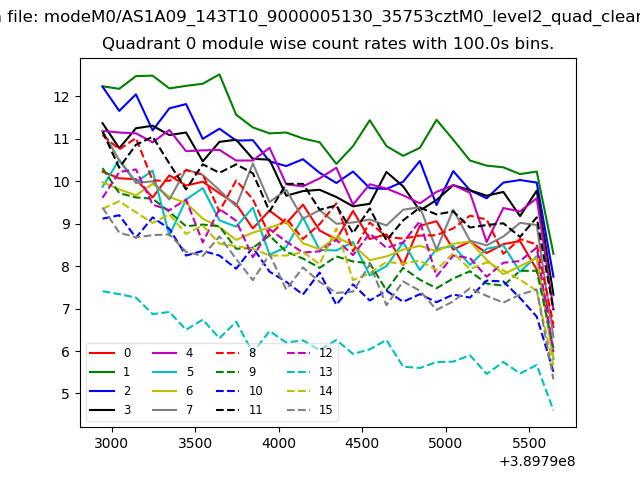 |
 |
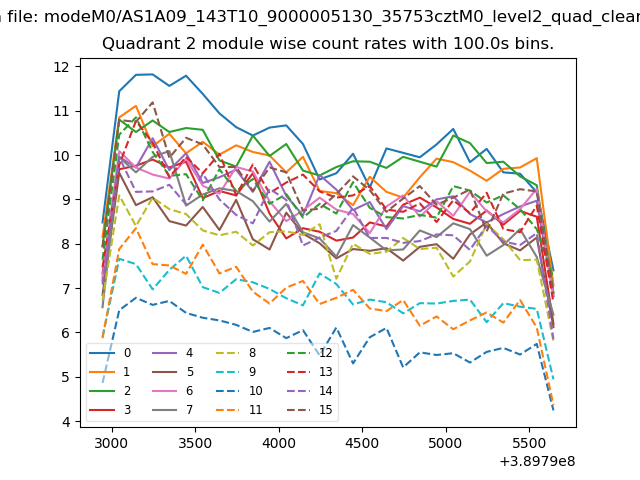
| Module-wise count rates for Quadrant B Data is divided into 100 sec bins |
 |
 |
| Module-wise count rates for Quadrant C Data is divided into 100 sec bins |
 |
 |
| Module-wise count rates for Quadrant D Data is divided into 100 sec bins |
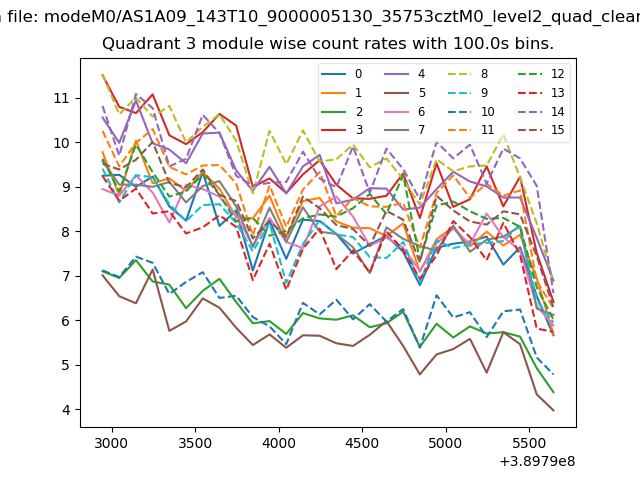 |
 |
| Parameter | Plot |
|---|---|
| CZT HV Monitor | 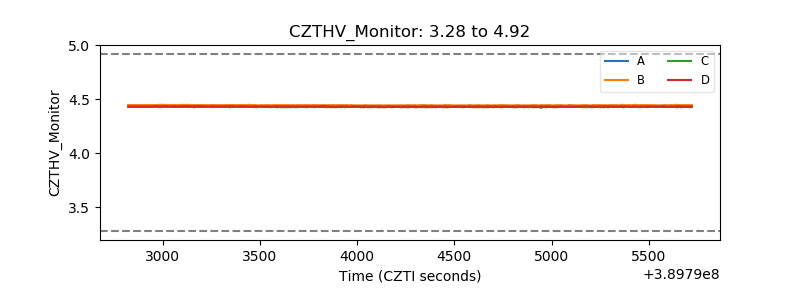 |
| D_VDD | 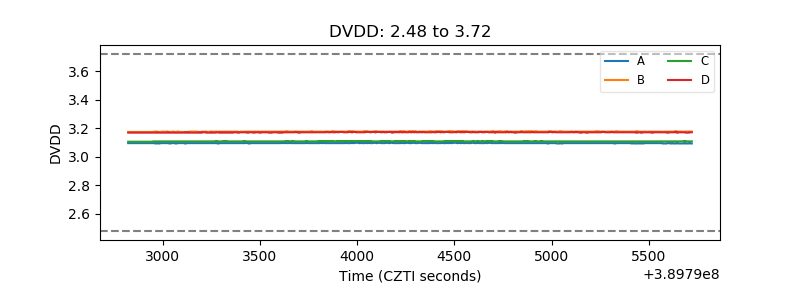 |
| Temperature 1 | 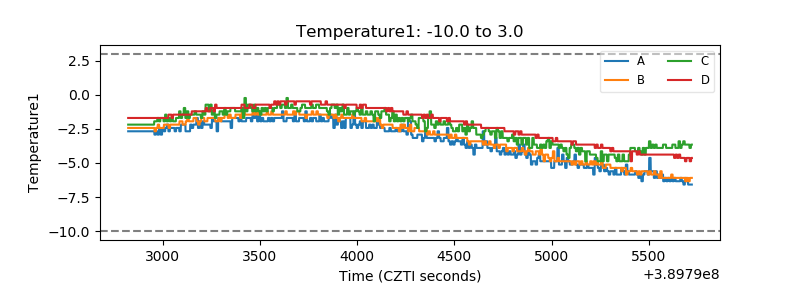 |
| Veto HV Monitor | 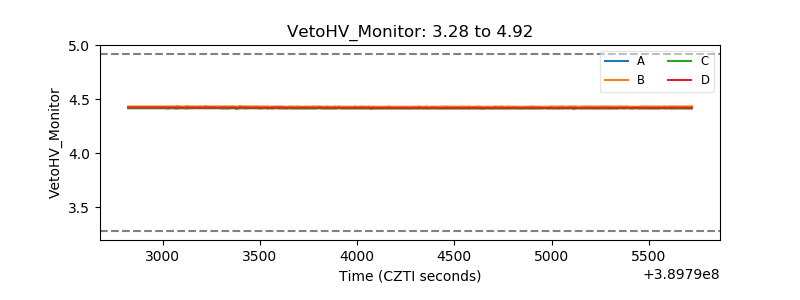 |
| Veto LLD | 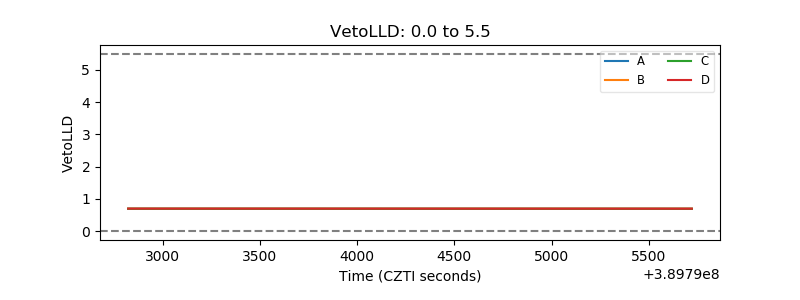 |
| Alpha Counter | 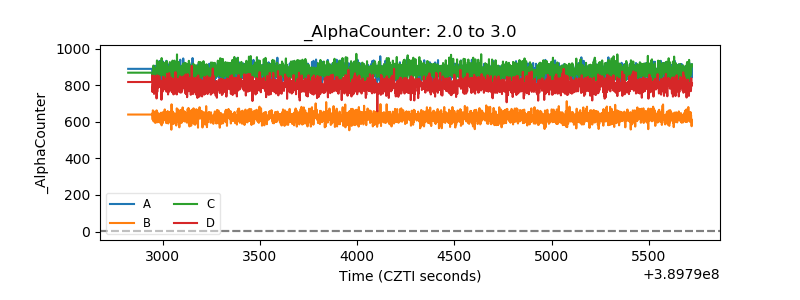 |
| _CPM_Rate | 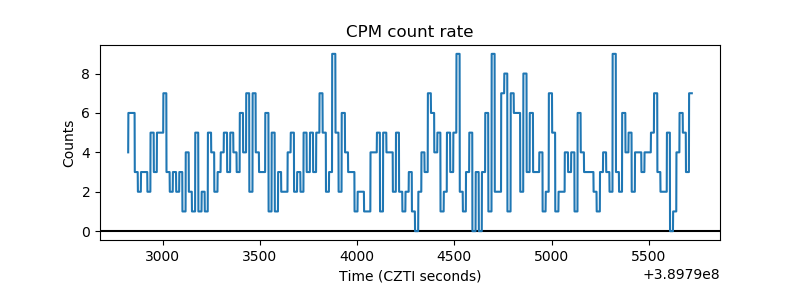 |
| CZT Counter | 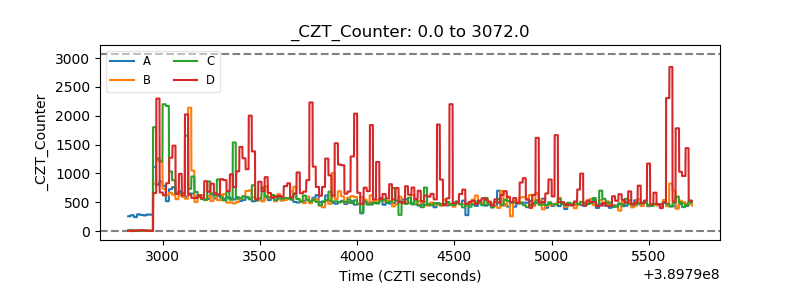 |
| +2.5 Volts monitor | 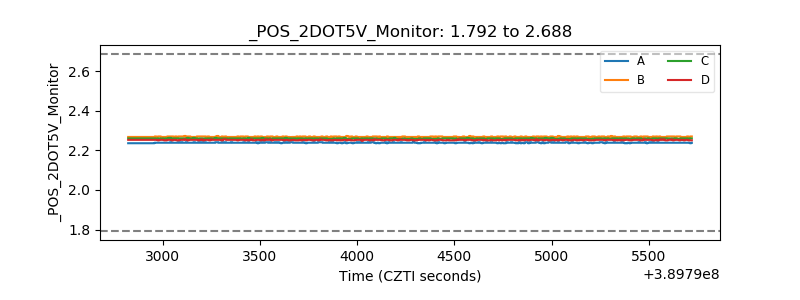 |
| +5 Volts monitor | 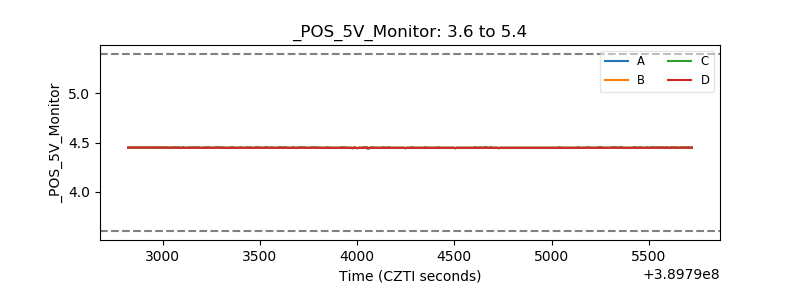 |
| _ROLL_ROT | 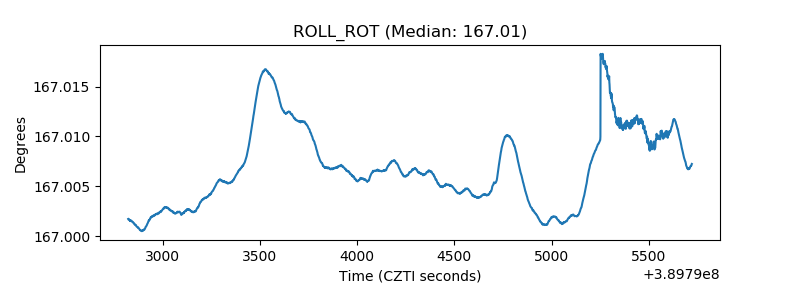 |
| _Roll_DEC | 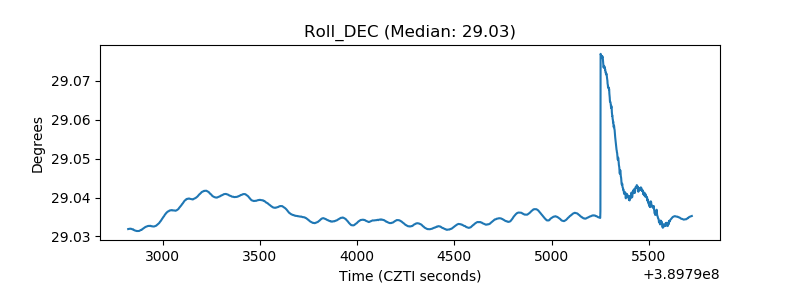 |
| _Roll_RA | 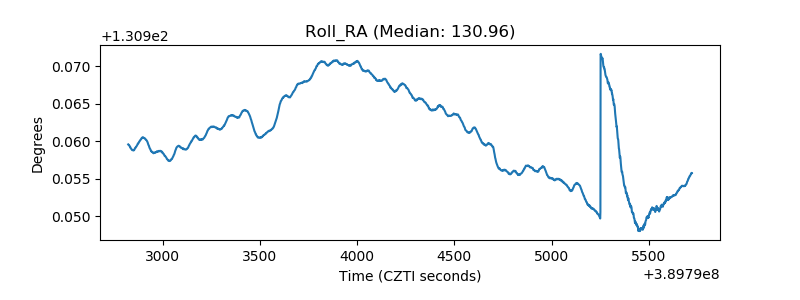 |
| Veto Counter | 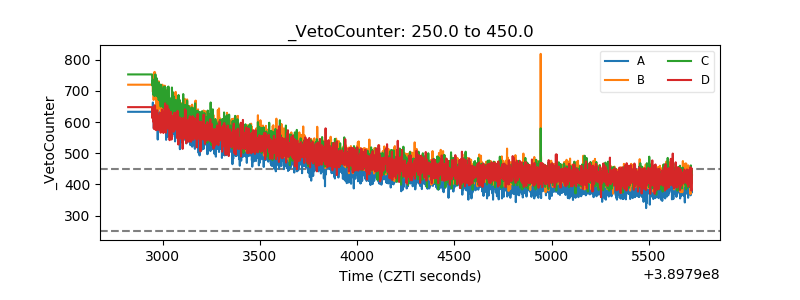 |