| Param | Original file | Final file |
|---|---|---|
| Filename | modeM0/AS1A09_143T10_9000005130_35752cztM0_level2.evt | modeM0/AS1A09_143T10_9000005130_35752cztM0_level2_quad_clean.evt |
| Size (bytes) | 439,188,480 | 90,774,720 |
| Size | 418.8 MB | 86.6 MB |
| Events in quadrant A | 2,691,998 | 618,079 |
| Events in quadrant B | 3,097,337 | 611,593 |
| Events in quadrant C | 2,933,697 | 592,383 |
| Events in quadrant D | 4,217,419 | 555,287 |
| Mode M0 | |||
|---|---|---|---|
| Quadrant | BADHDUFLAG | Total packets | Discarded packets |
| A | 0 | 11282 | 2 |
| B | 0 | 12552 | 1 |
| C | 0 | 11843 | 1 |
| D | 0 | 16169 | 1 |
| Mode SS | |||
|---|---|---|---|
| Quadrant | BADHDUFLAG | Total packets | Discarded packets |
| A | 0 | 108 | 0 |
| B | 0 | 108 | 0 |
| C | 0 | 108 | 0 |
| D | 0 | 108 | 0 |
| Mode M9 | |||
|---|---|---|---|
| Quadrant | BADHDUFLAG | Total packets | Discarded packets |
| A | 0 | 19 | 0 |
| B | 0 | 19 | 0 |
| C | 0 | 19 | 0 |
| D | 0 | 19 | 0 |
| Quadrant | Total seconds | Saturated seconds | Saturation percentage |
|---|---|---|---|
| A | 5308 | 6 | 0.113037% |
| B | 5308 | 115 | 2.166541% |
| C | 5308 | 77 | 1.450641% |
| D | 5308 | 361 | 6.801055% |
Noise dominated data is calculated using 1-second bins in cleaned event files. If a bin has >2000 counts, and if more than 50% of those come from <1% of pixels, then it is considered to be noise-dominated and hence unusable.
| Quadrant | # 1 sec bins | Bins with >0 counts | Bins with >2000 counts | High rate bins dominated by noise | Noise dominated (total time) | Noise dominated (detector-on time) | Marked lightcurve |
|---|---|---|---|---|---|---|---|
| A | 7192 | 5309 | 0 | 0 | 0.00% | 0.00% | 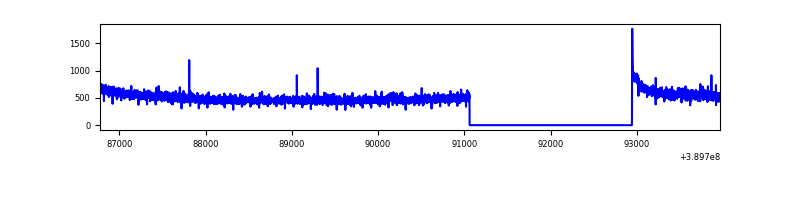 |
| B | 7192 | 5309 | 92 | 92 | 1.28% | 1.73% | 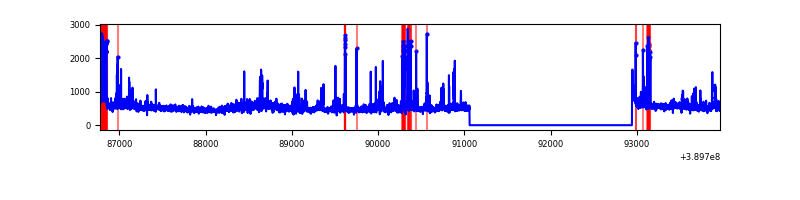 |
| C | 7192 | 5309 | 63 | 63 | 0.88% | 1.19% | 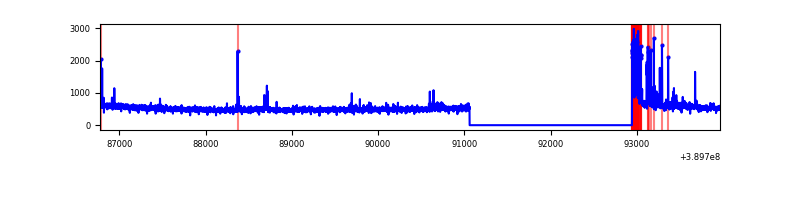 |
| D | 7192 | 5309 | 369 | 369 | 5.13% | 6.95% | 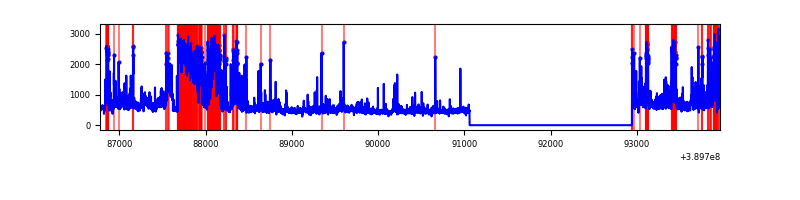 |
Top three noisy pixels from each quadrant. If the there are fewer than three noisy pixels in the level2.evt file, extra rows are filled as -1
| Pixel properties | Quadrant properties | ||||||
|---|---|---|---|---|---|---|---|
| Quadrant | DetID | PixID | Counts | Sigma | Mean | Median | Sigma |
| A | 10 | 83 | 137547 | 1037.64 | 652 | 640 | 131.9 |
| A | 13 | 6 | 12894 | 92.88 | 652 | 640 | 131.9 |
| A | 8 | 192 | 10297 | 73.19 | 652 | 640 | 131.9 |
| B | 5 | 172 | 277690 | 2294.04 | 633 | 615 | 120.8 |
| B | 0 | 190 | 101232 | 833.06 | 633 | 615 | 120.8 |
| B | 5 | 255 | 98066 | 806.85 | 633 | 615 | 120.8 |
| C | 15 | 214 | 223282 | 1550.37 | 621 | 626 | 143.6 |
| C | 0 | 10 | 182936 | 1269.44 | 621 | 626 | 143.6 |
| C | 15 | 208 | 98584 | 682.09 | 621 | 626 | 143.6 |
| D | 14 | 52 | 1264219 | 8267.03 | 621 | 604 | 152.8 |
| D | 13 | 249 | 121200 | 788.98 | 621 | 604 | 152.8 |
| D | 14 | 226 | 100574 | 654.04 | 621 | 604 | 152.8 |
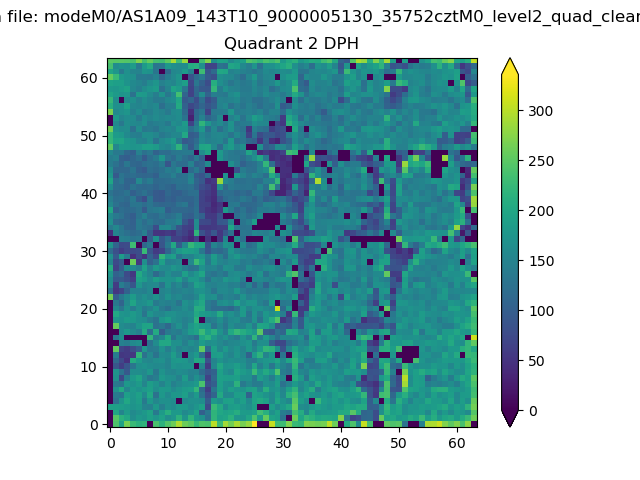
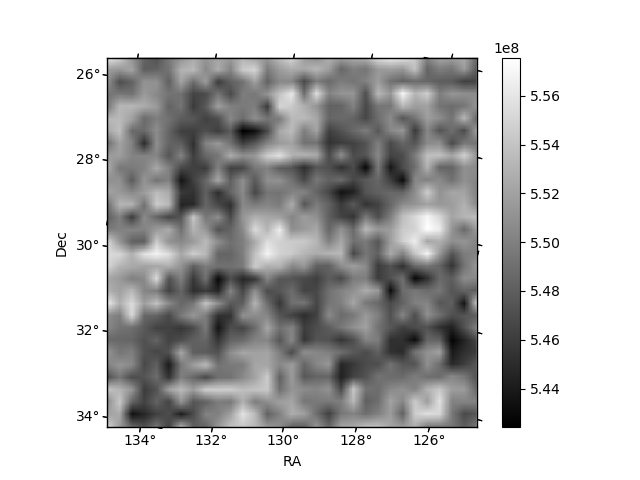
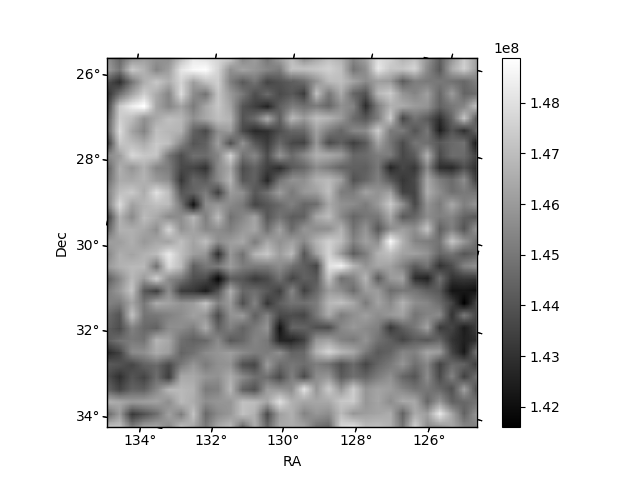
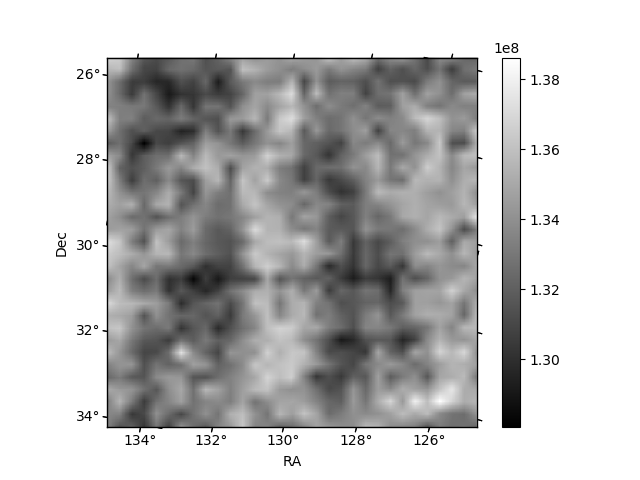
Histogram calculated using DETX and DETY for each event in the final _common_clean file
| Quadrant A | 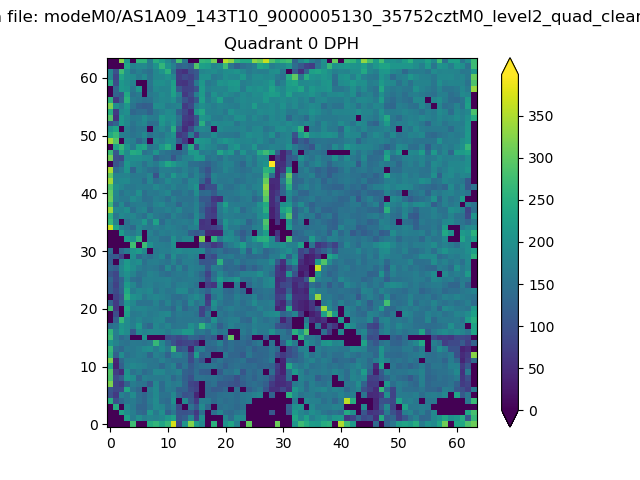 |
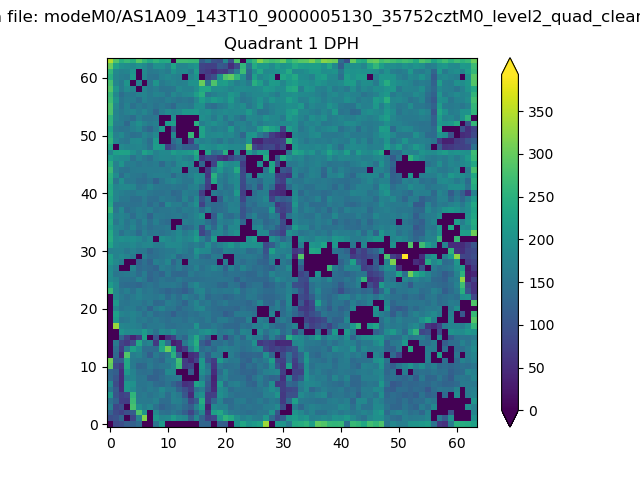 |
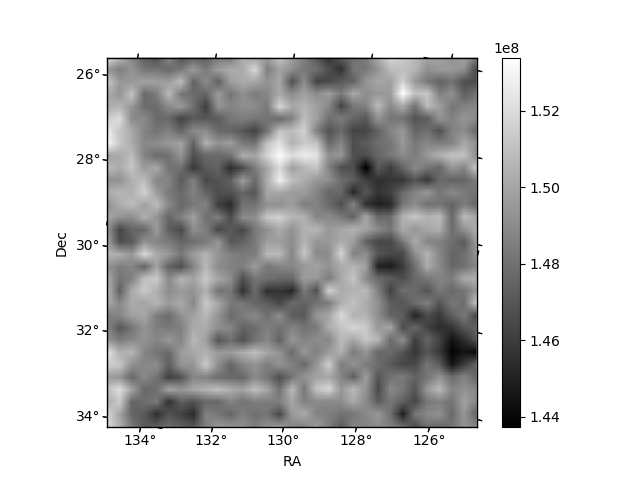
Quadrant B |
|---|---|---|---|
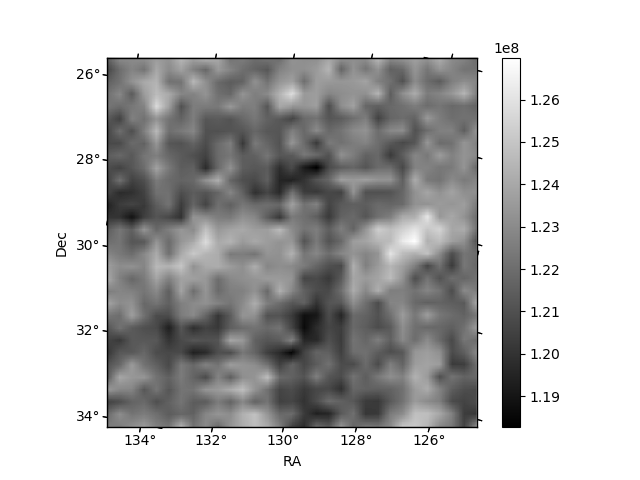
| Quadrant D | 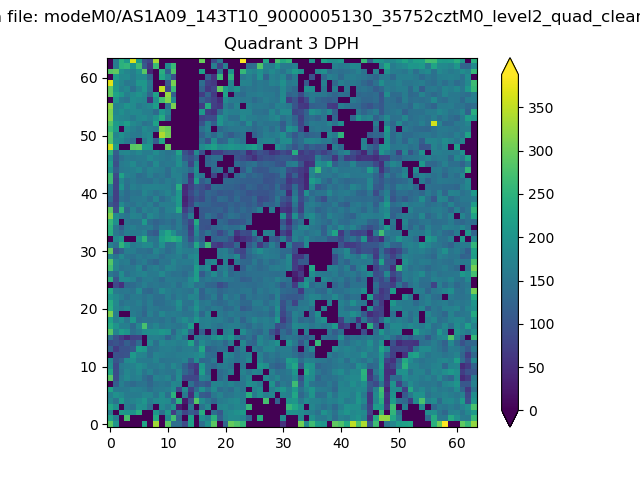 |
 |
Quadrant C |
| Plot type | Count rate plots | Images |
|---|---|---|
| Comparison with Poisson distribution Blue bars denote a histogram of data divided into 1 sec bins. Red curve is a Poisson curve with rate = median count rate of data. |
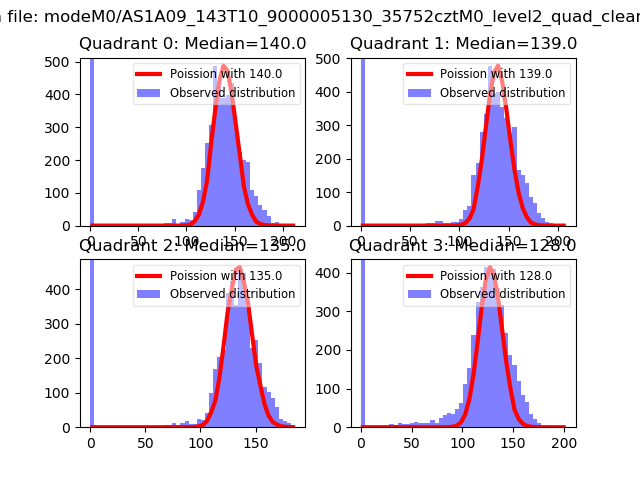 |
 |
| Quadrant-wise count rates Data is divided into 100 sec bins |
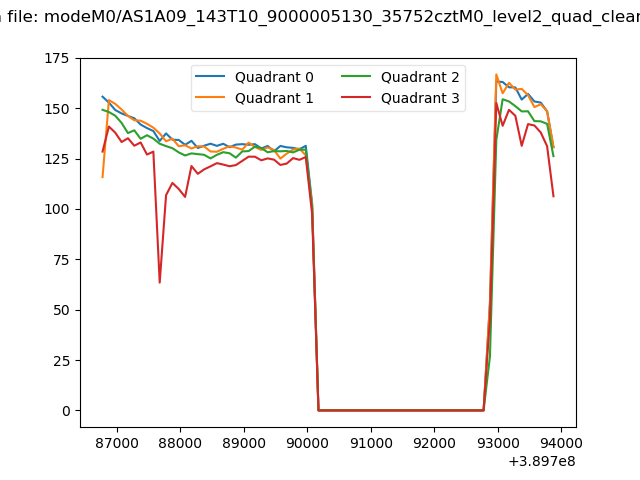 |
|
| Module-wise count rates for Quadrant A Data is divided into 100 sec bins |
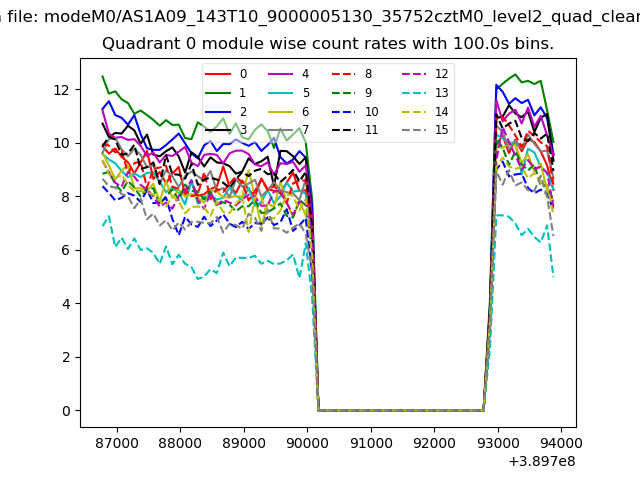 |
 |
| Module-wise count rates for Quadrant B Data is divided into 100 sec bins |
 |
 |
| Module-wise count rates for Quadrant C Data is divided into 100 sec bins |
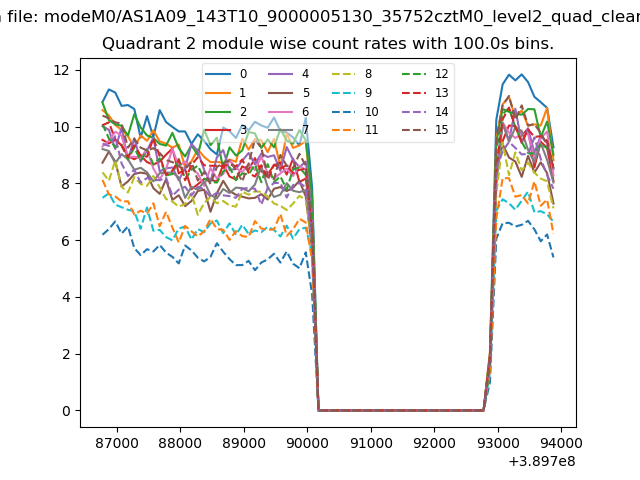 |
 |
| Module-wise count rates for Quadrant D Data is divided into 100 sec bins |
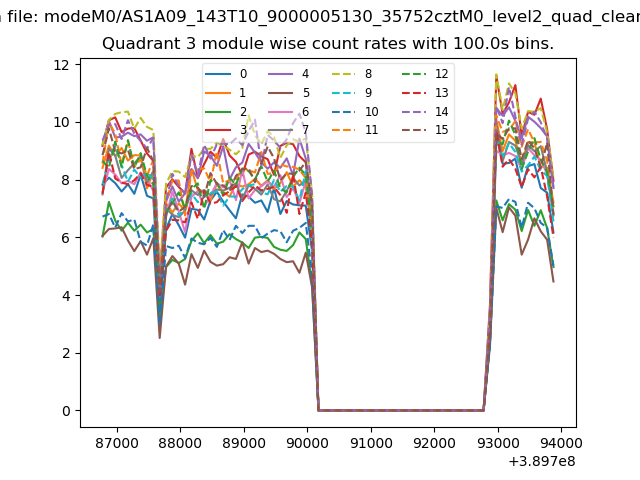 |
 |
| Parameter | Plot |
|---|---|
| CZT HV Monitor | 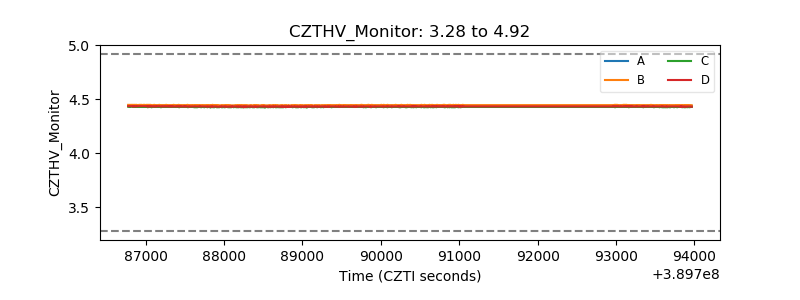 |
| D_VDD | 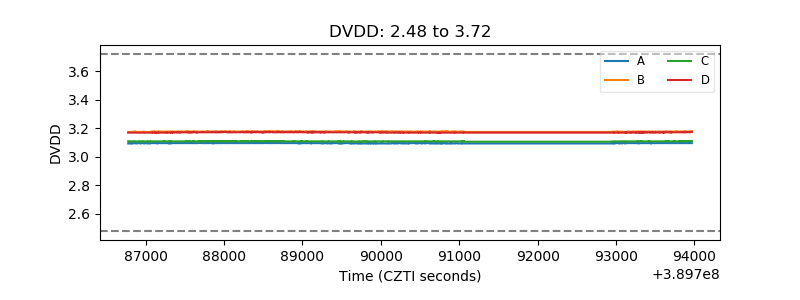 |
| Temperature 1 | 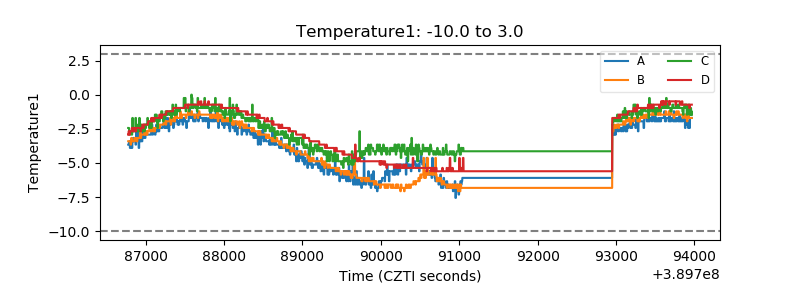 |
| Veto HV Monitor | 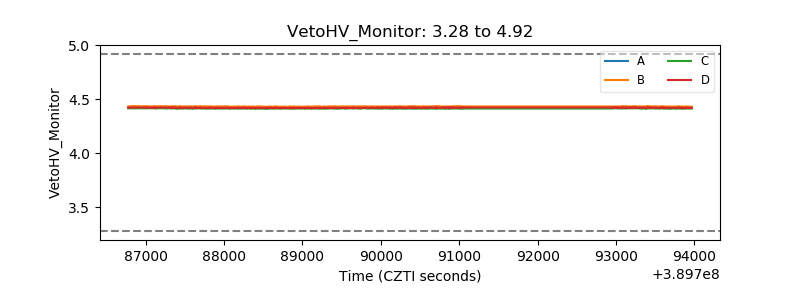 |
| Veto LLD | 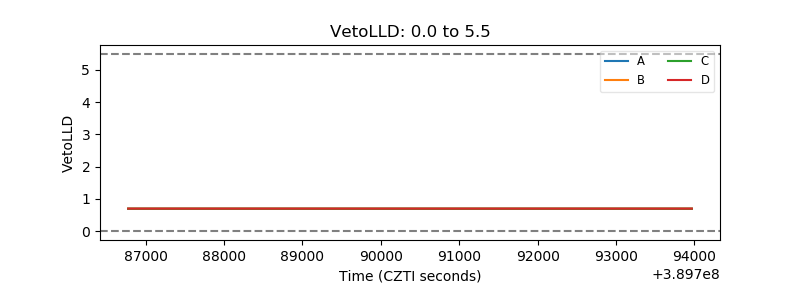 |
| Alpha Counter | 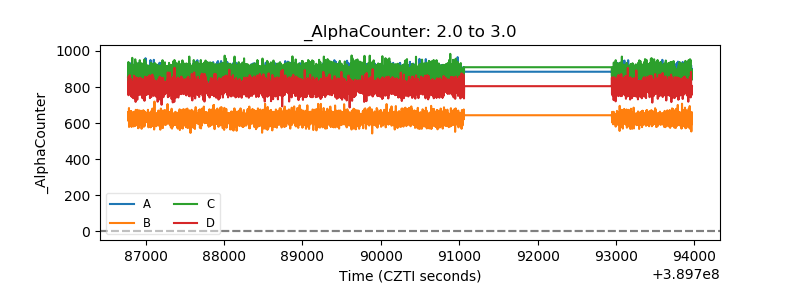 |
| _CPM_Rate | 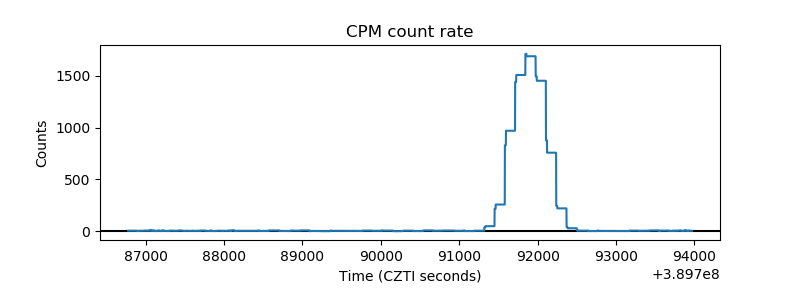 |
| CZT Counter | 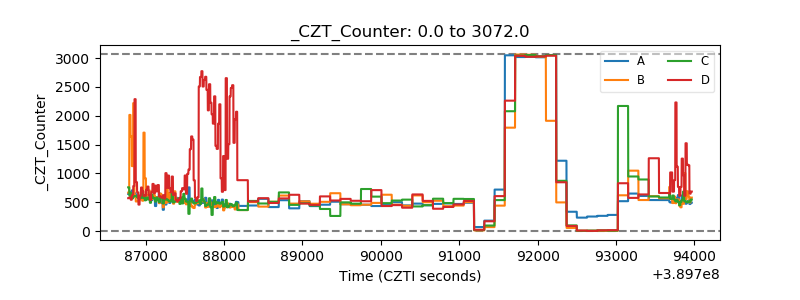 |
| +2.5 Volts monitor | 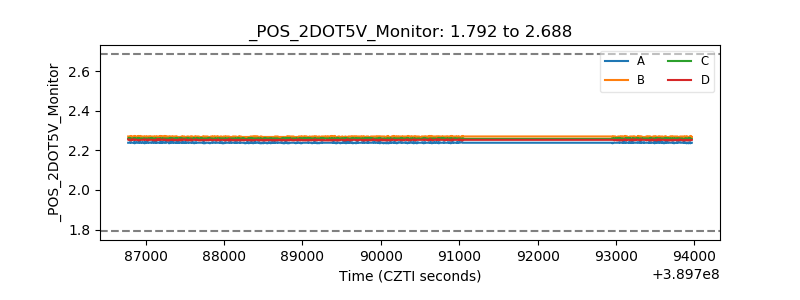 |
| +5 Volts monitor | 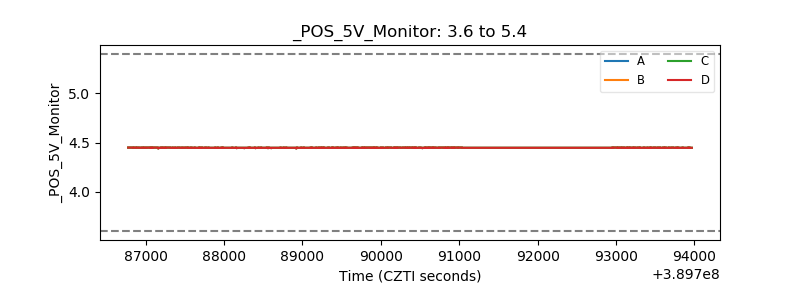 |
| _ROLL_ROT | 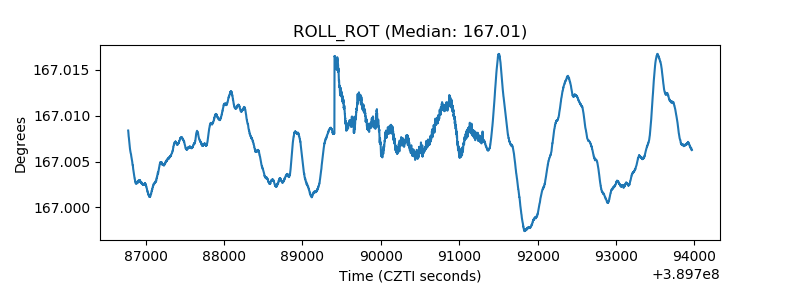 |
| _Roll_DEC | 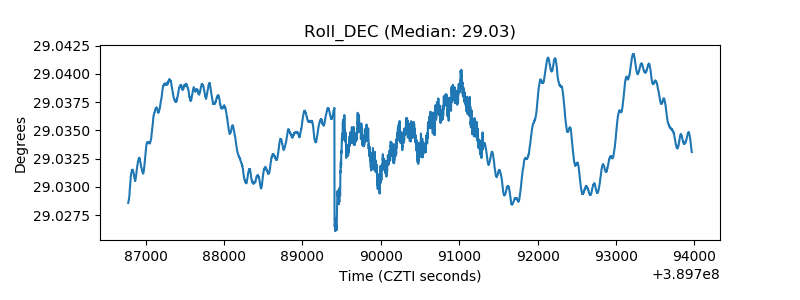 |
| _Roll_RA | 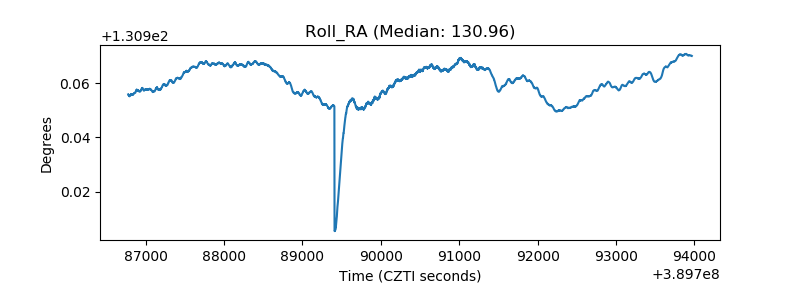 |
| Veto Counter | 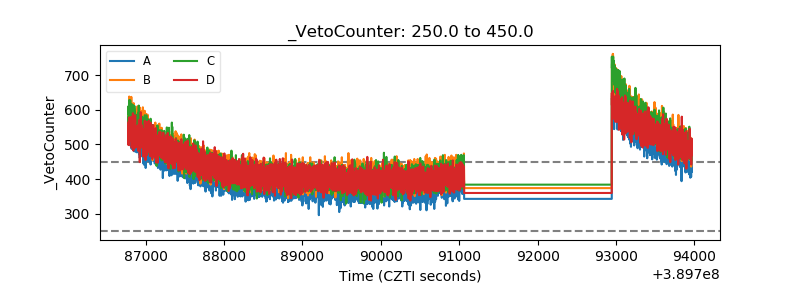 |