| Param | Original file | Final file |
|---|---|---|
| Filename | modeM0/AS1A09_143T10_9000005130cztM0_level2_bc.evt | modeM0/AS1A09_143T10_9000005130cztM0_level2_quad_clean.evt |
| Size (bytes) | 337,216,320 | 128,928,960 |
| Size | 321.6 MB | 123.0 MB |
| Events in quadrant A | 1,879,251 | 874,616 |
| Events in quadrant B | 2,208,346 | 866,578 |
| Events in quadrant C | 2,175,925 | 840,303 |
| Events in quadrant D | 3,419,386 | 789,703 |
| Mode M0 | |||
|---|---|---|---|
| Quadrant | BADHDUFLAG | Total packets | Discarded packets |
| A | 0 | 16157 | 0 |
| B | 0 | 17820 | 0 |
| C | 0 | 16894 | 0 |
| D | 0 | 22596 | 0 |
| Mode SS | |||
|---|---|---|---|
| Quadrant | BADHDUFLAG | Total packets | Discarded packets |
| A | 0 | 158 | 0 |
| B | 0 | 158 | 0 |
| C | 0 | 158 | 0 |
| D | 0 | 158 | 0 |
| Mode M9 | |||
|---|---|---|---|
| Quadrant | BADHDUFLAG | Total packets | Discarded packets |
| A | 0 | 37 | 0 |
| B | 0 | 37 | 0 |
| C | 0 | 37 | 0 |
| D | 0 | 37 | 0 |
| Quadrant | Total seconds | Saturated seconds | Saturation percentage |
|---|---|---|---|
| A | 7673 | 8 | 0.104262% |
| B | 7673 | 152 | 1.980972% |
| C | 7673 | 115 | 1.498762% |
| D | 7673 | 453 | 5.903819% |
Noise dominated data is calculated using 1-second bins in cleaned event files. If a bin has >2000 counts, and if more than 50% of those come from <1% of pixels, then it is considered to be noise-dominated and hence unusable.
| Quadrant | # 1 sec bins | Bins with >0 counts | Bins with >2000 counts | High rate bins dominated by noise | Noise dominated (total time) | Noise dominated (detector-on time) | Marked lightcurve |
|---|---|---|---|---|---|---|---|
| A | 11320 | 7675 | 0 | 0 | 0.00% | 0.00% | 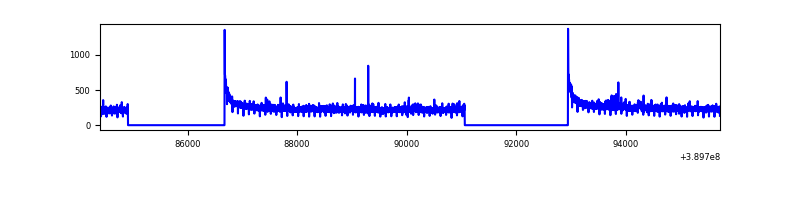 |
| B | 11320 | 7673 | 1 | 1 | 0.01% | 0.01% | 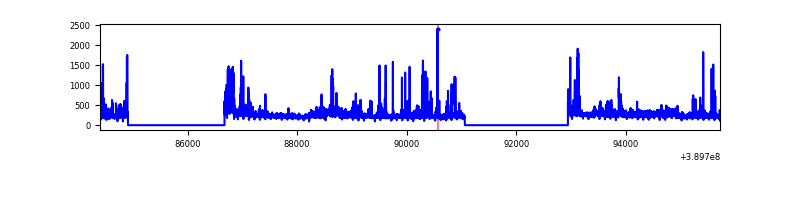 |
| C | 11320 | 7673 | 7 | 7 | 0.06% | 0.09% | 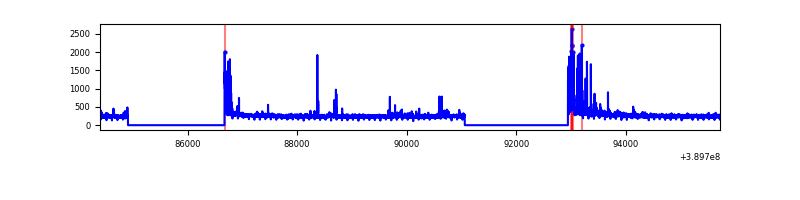 |
| D | 11320 | 7673 | 5 | 5 | 0.04% | 0.07% | 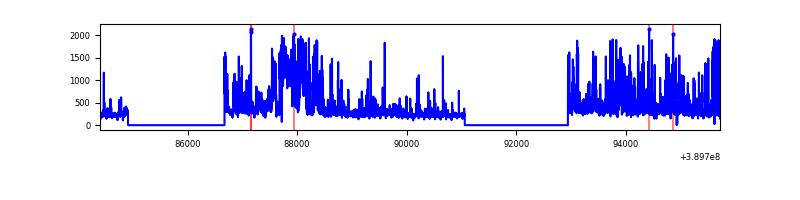 |
Top three noisy pixels from each quadrant. If the there are fewer than three noisy pixels in the level2.evt file, extra rows are filled as -1
| Pixel properties | Quadrant properties | ||||||
|---|---|---|---|---|---|---|---|
| Quadrant | DetID | PixID | Counts | Sigma | Mean | Median | Sigma |
| A | 10 | 83 | 192178 | 2013.51 | 423 | 416 | 95.2 |
| A | 13 | 6 | 16532 | 169.22 | 423 | 416 | 95.2 |
| A | 8 | 144 | 14489 | 147.77 | 423 | 416 | 95.2 |
| B | 5 | 172 | 215918 | 2568.99 | 417 | 409 | 83.9 |
| B | 0 | 190 | 129732 | 1541.6 | 417 | 409 | 83.9 |
| B | 5 | 255 | 92818 | 1101.56 | 417 | 409 | 83.9 |
| C | 15 | 214 | 305563 | 3269.38 | 403 | 400 | 93.3 |
| C | 0 | 10 | 191489 | 2047.24 | 403 | 400 | 93.3 |
| C | 15 | 208 | 93487 | 997.29 | 403 | 400 | 93.3 |
| D | 14 | 52 | 1081581 | 11172.05 | 405 | 393 | 96.8 |
| D | 13 | 249 | 115236 | 1186.69 | 405 | 393 | 96.8 |
| D | 8 | 195 | 100677 | 1036.25 | 405 | 393 | 96.8 |
Histogram calculated using DETX and DETY for each event in the final _common_clean file
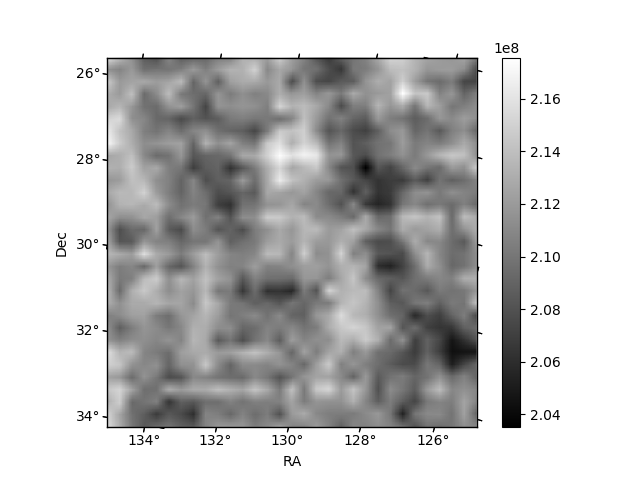
| Quadrant A | 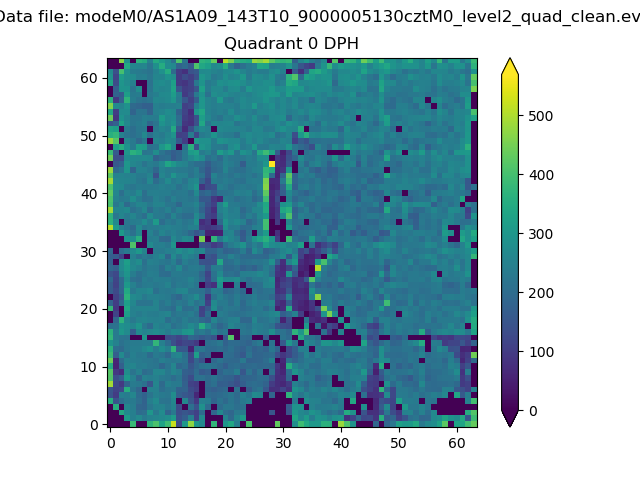 |
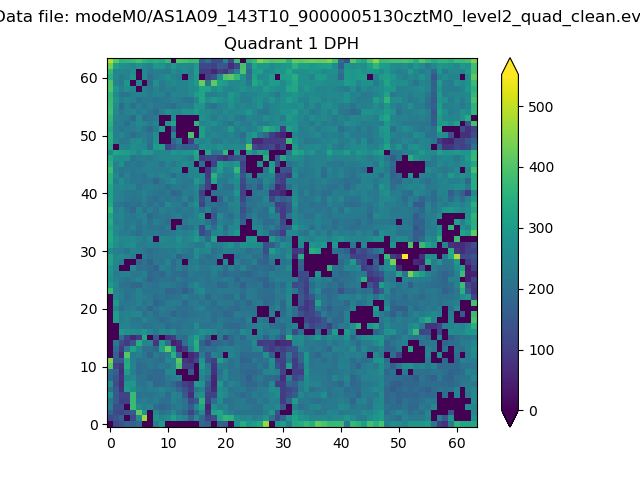 |
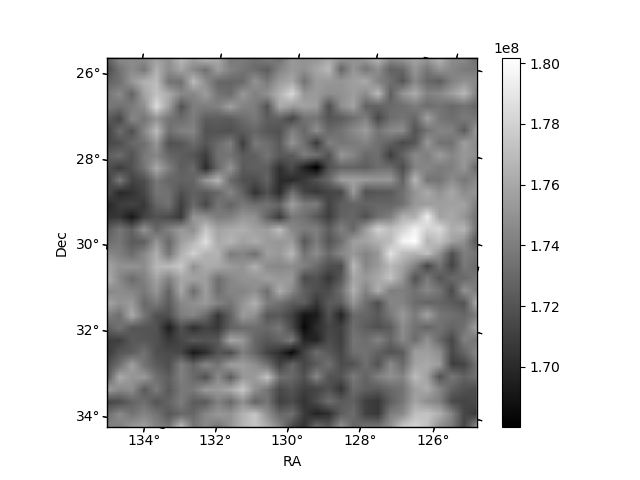
Quadrant B |
|---|---|---|---|
| Quadrant D | 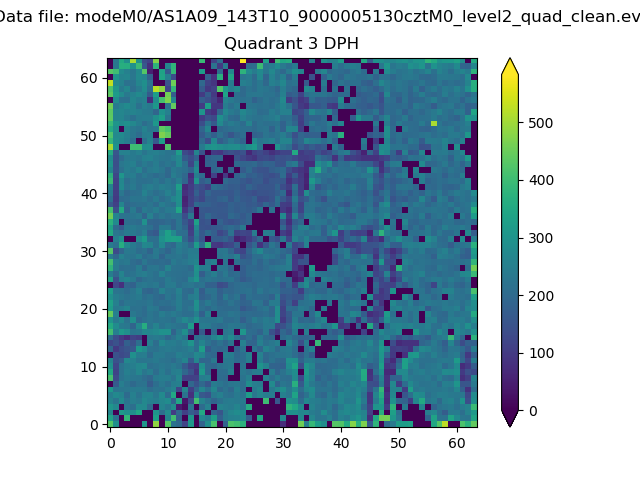 |
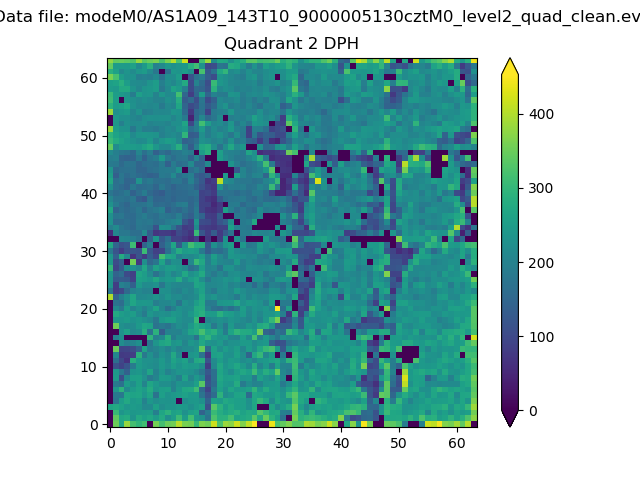 |
Quadrant C |
| Plot type | Count rate plots | Images |
|---|---|---|
| Comparison with Poisson distribution Blue bars denote a histogram of data divided into 1 sec bins. Red curve is a Poisson curve with rate = median count rate of data. |
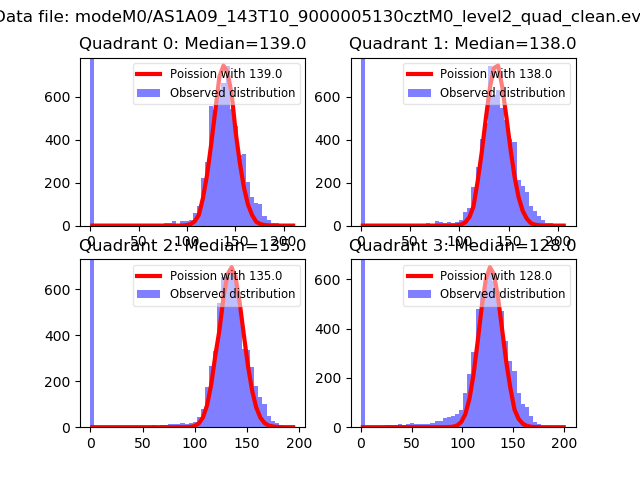 |
 |
| Quadrant-wise count rates Data is divided into 100 sec bins |
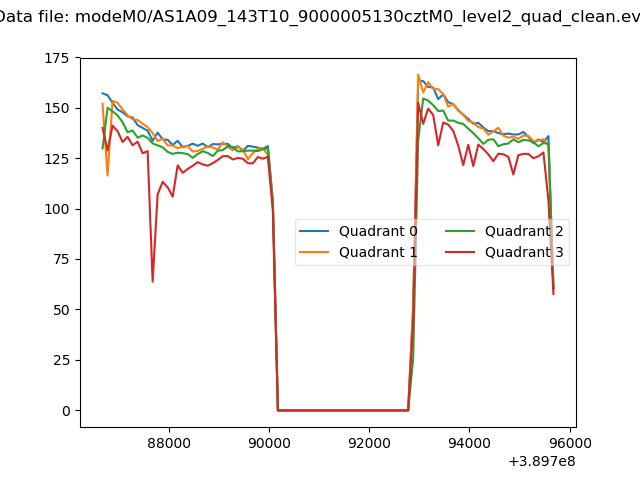 |
|
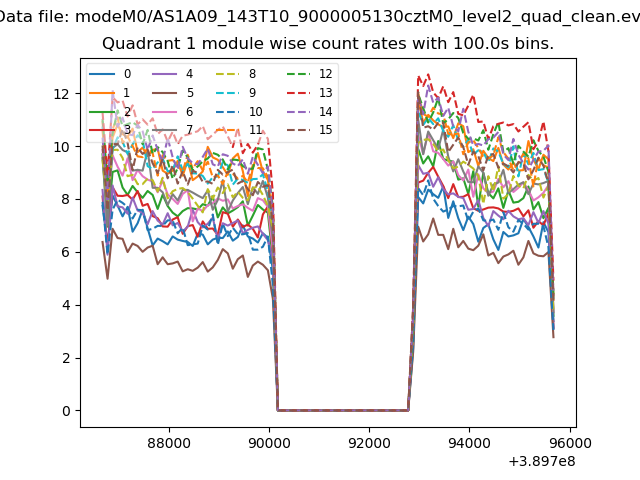
| Module-wise count rates for Quadrant A Data is divided into 100 sec bins |
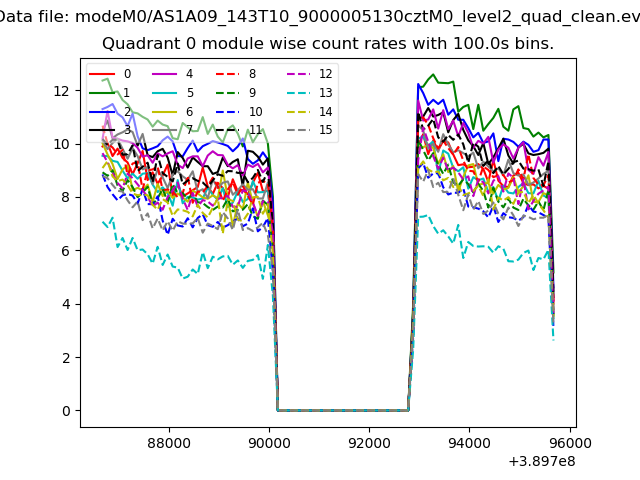 |
 |
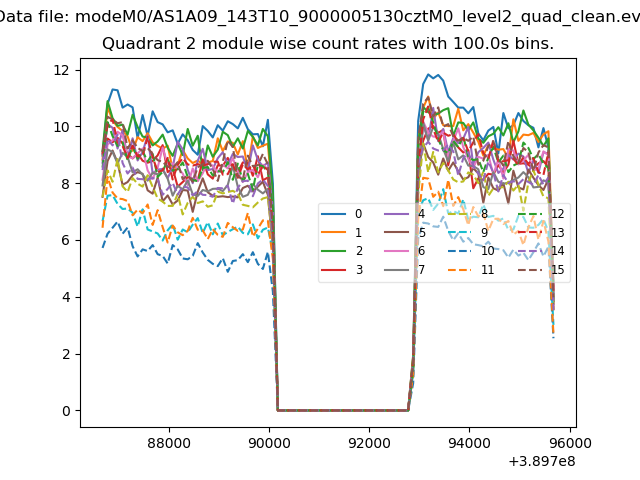
| Module-wise count rates for Quadrant B Data is divided into 100 sec bins |
 |
 |
| Module-wise count rates for Quadrant C Data is divided into 100 sec bins |
 |
 |
| Module-wise count rates for Quadrant D Data is divided into 100 sec bins |
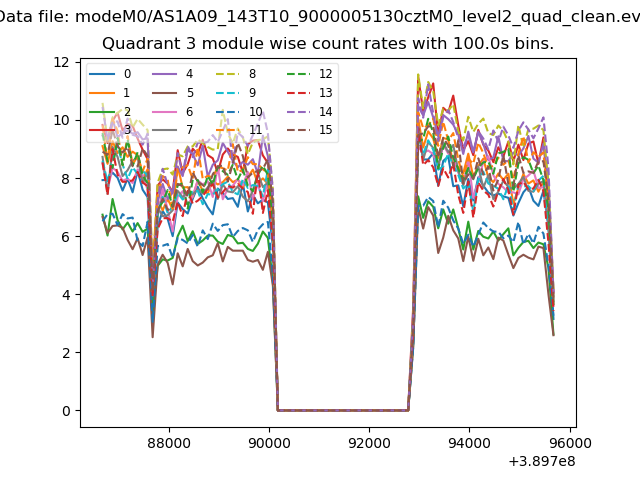 |
 |
| Parameter | Plot |
|---|---|
| CZT HV Monitor | 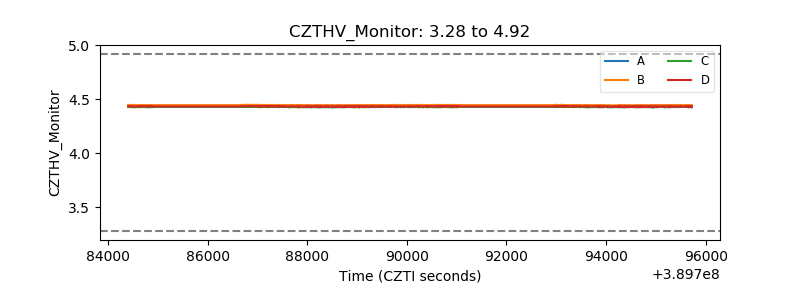 |
| D_VDD | 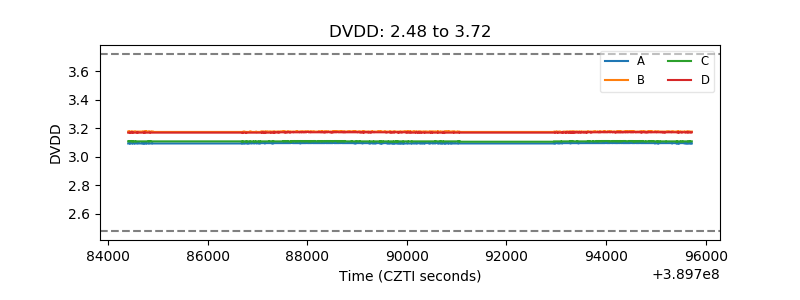 |
| Temperature 1 | 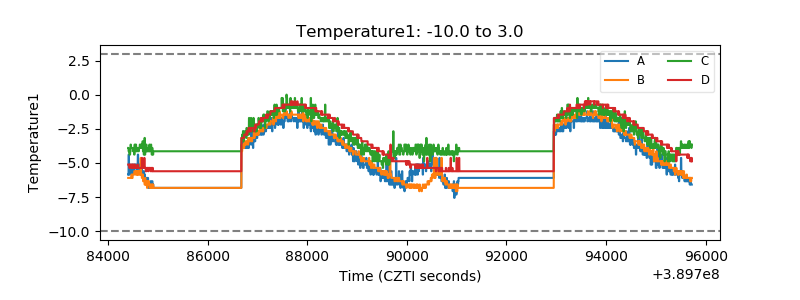 |
| Veto HV Monitor | 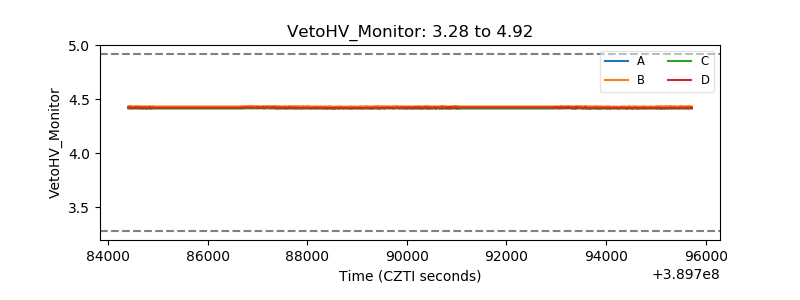 |
| Veto LLD | 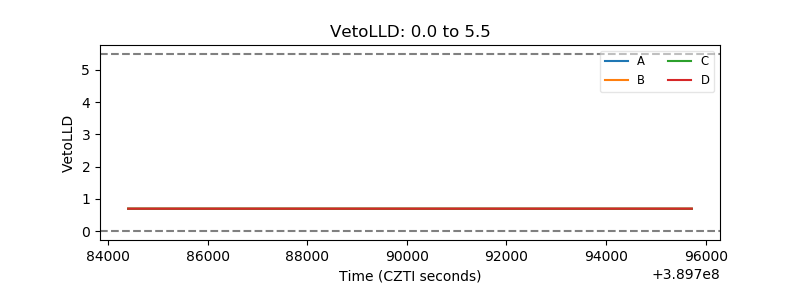 |
| Alpha Counter | 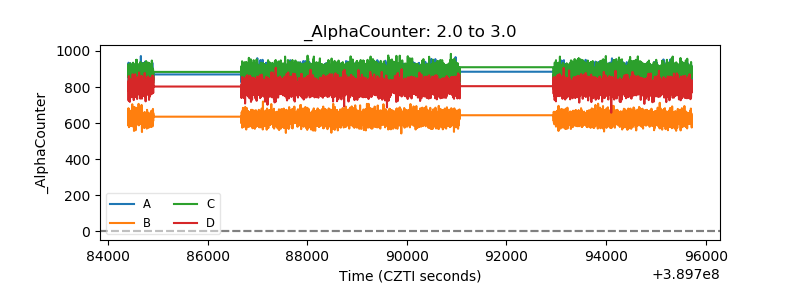 |
| _CPM_Rate | 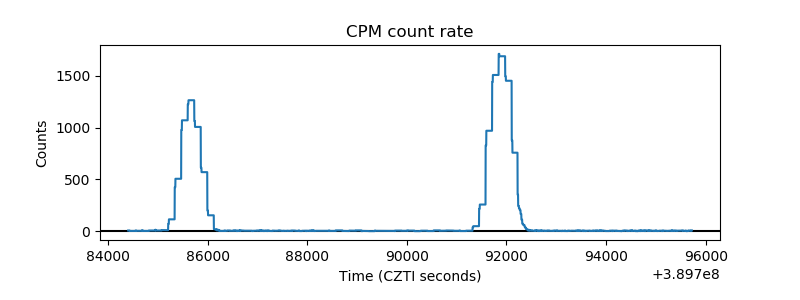 |
| CZT Counter | 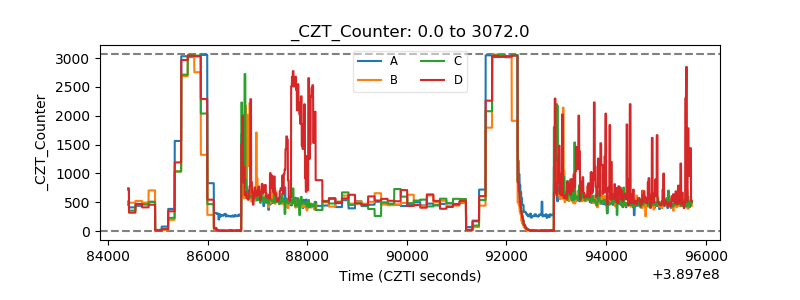 |
| +2.5 Volts monitor | 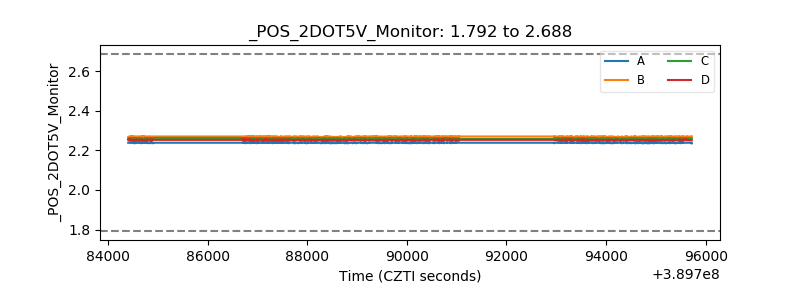 |
| +5 Volts monitor | 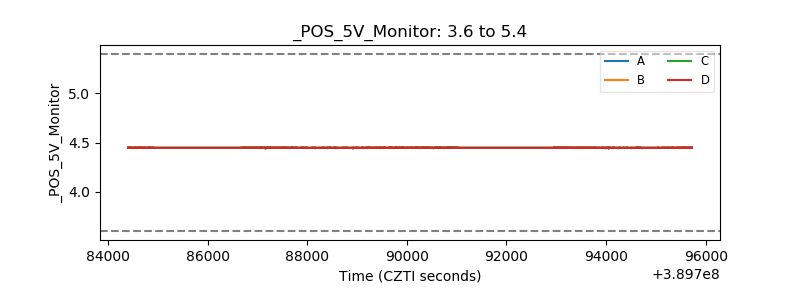 |
| _ROLL_ROT | 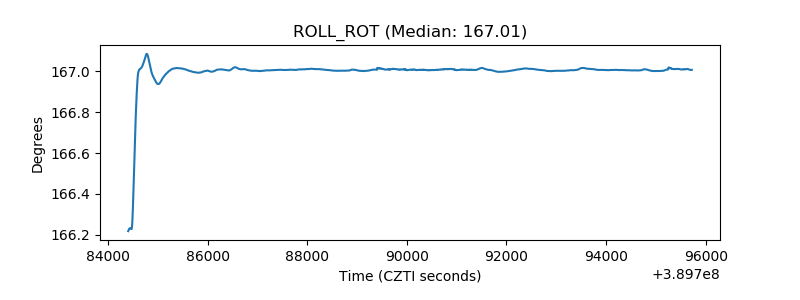 |
| _Roll_DEC | 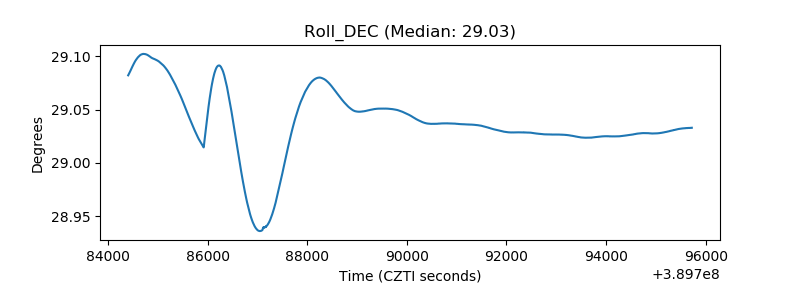 |
| _Roll_RA | 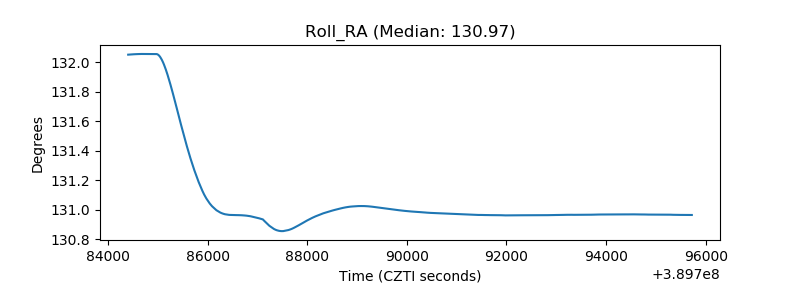 |
| Veto Counter |  |