| Param | Original file | Final file |
|---|---|---|
| Filename | modeM0/AS1A09_142T06_9000005132_35755cztM0_level2.evt | modeM0/AS1A09_142T06_9000005132_35755cztM0_level2_quad_clean.evt |
| Size (bytes) | 379,955,520 | 85,720,320 |
| Size | 362.4 MB | 81.7 MB |
| Events in quadrant A | 2,517,899 | 573,772 |
| Events in quadrant B | 2,673,069 | 576,022 |
| Events in quadrant C | 2,796,420 | 563,313 |
| Events in quadrant D | 3,186,915 | 539,612 |
| Mode M0 | |||
|---|---|---|---|
| Quadrant | BADHDUFLAG | Total packets | Discarded packets |
| A | 0 | 10512 | 3 |
| B | 0 | 10979 | 2 |
| C | 0 | 11057 | 2 |
| D | 0 | 12702 | 2 |
| Mode SS | |||
|---|---|---|---|
| Quadrant | BADHDUFLAG | Total packets | Discarded packets |
| A | 0 | 100 | 0 |
| B | 0 | 100 | 0 |
| C | 0 | 100 | 0 |
| D | 0 | 100 | 0 |
| Mode M9 | |||
|---|---|---|---|
| Quadrant | BADHDUFLAG | Total packets | Discarded packets |
| A | 0 | 27 | 0 |
| B | 0 | 27 | 0 |
| C | 0 | 27 | 0 |
| D | 0 | 28 | 0 |
| Quadrant | Total seconds | Saturated seconds | Saturation percentage |
|---|---|---|---|
| A | 4890 | 23 | 0.470348% |
| B | 4890 | 28 | 0.572597% |
| C | 4890 | 122 | 2.494888% |
| D | 4890 | 171 | 3.496933% |
Noise dominated data is calculated using 1-second bins in cleaned event files. If a bin has >2000 counts, and if more than 50% of those come from <1% of pixels, then it is considered to be noise-dominated and hence unusable.
| Quadrant | # 1 sec bins | Bins with >0 counts | Bins with >2000 counts | High rate bins dominated by noise | Noise dominated (total time) | Noise dominated (detector-on time) | Marked lightcurve |
|---|---|---|---|---|---|---|---|
| A | 7012 | 4891 | 17 | 17 | 0.24% | 0.35% | 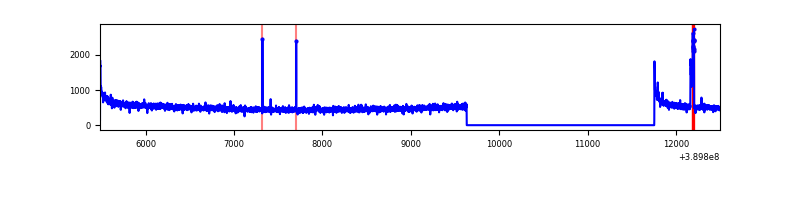 |
| B | 7012 | 4891 | 18 | 18 | 0.26% | 0.37% | 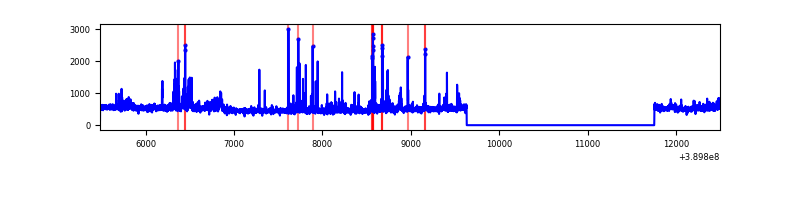 |
| C | 7012 | 4891 | 106 | 106 | 1.51% | 2.17% | 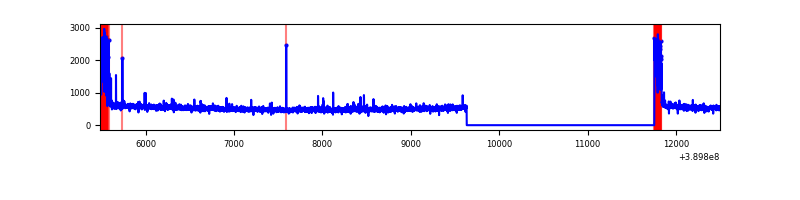 |
| D | 7012 | 4891 | 153 | 153 | 2.18% | 3.13% | 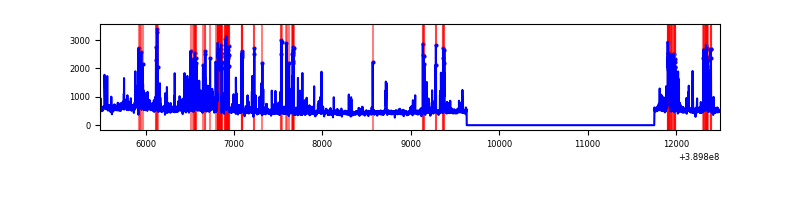 |
Top three noisy pixels from each quadrant. If the there are fewer than three noisy pixels in the level2.evt file, extra rows are filled as -1
| Pixel properties | Quadrant properties | ||||||
|---|---|---|---|---|---|---|---|
| Quadrant | DetID | PixID | Counts | Sigma | Mean | Median | Sigma |
| A | 10 | 83 | 151890 | 1278.04 | 592 | 582 | 118.4 |
| A | 8 | 192 | 62266 | 521.02 | 592 | 582 | 118.4 |
| A | 13 | 6 | 9914 | 78.82 | 592 | 582 | 118.4 |
| B | 5 | 172 | 138131 | 1258.26 | 586 | 570 | 109.3 |
| B | 4 | 232 | 103375 | 940.35 | 586 | 570 | 109.3 |
| B | 0 | 190 | 53106 | 480.54 | 586 | 570 | 109.3 |
| C | 0 | 10 | 308046 | 2314.28 | 580 | 583 | 132.9 |
| C | 15 | 214 | 206828 | 1552.41 | 580 | 583 | 132.9 |
| C | 15 | 208 | 12116 | 86.81 | 580 | 583 | 132.9 |
| D | 13 | 249 | 545236 | 3887.98 | 579 | 565 | 140.1 |
| D | 2 | 153 | 106923 | 759.21 | 579 | 565 | 140.1 |
| D | 8 | 195 | 79639 | 564.45 | 579 | 565 | 140.1 |
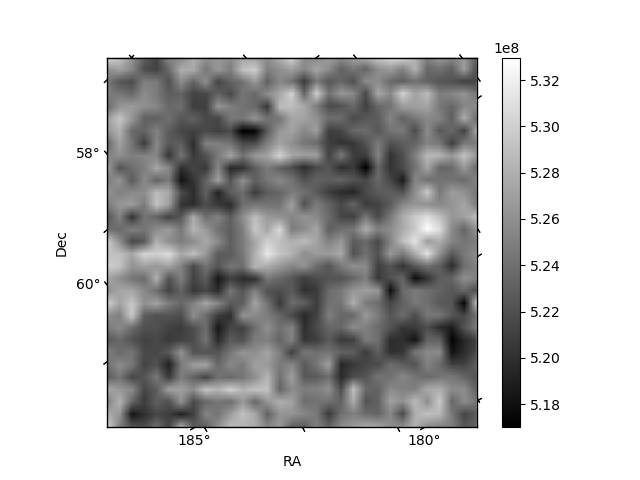
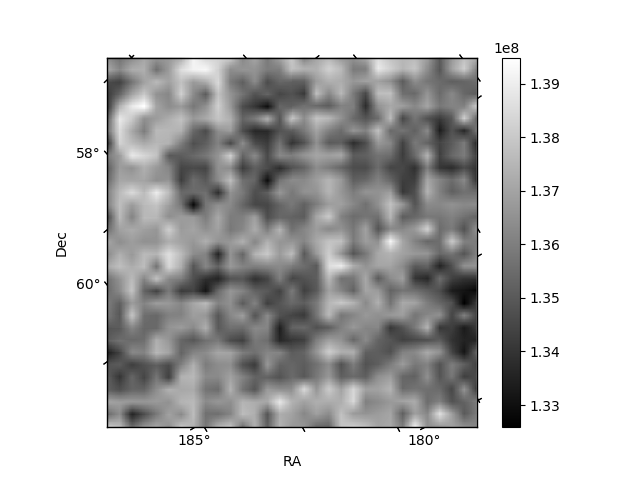
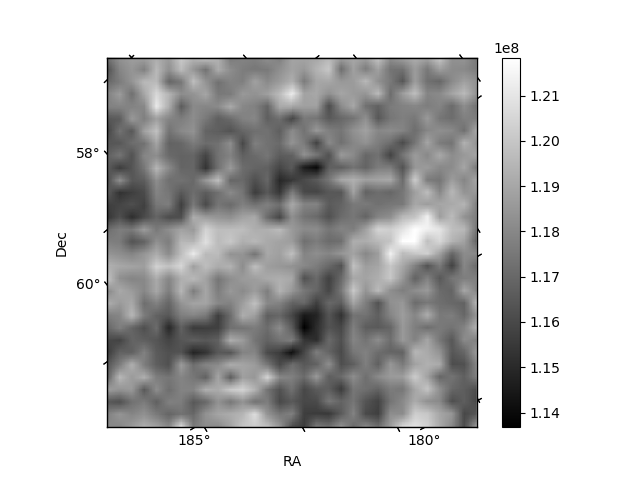
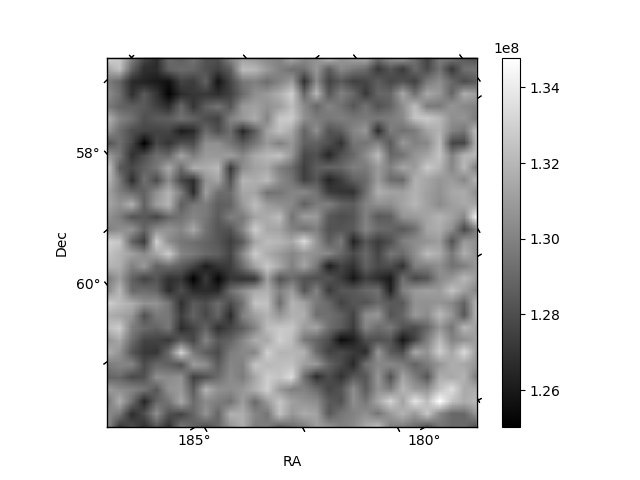
Histogram calculated using DETX and DETY for each event in the final _common_clean file
| Quadrant A | 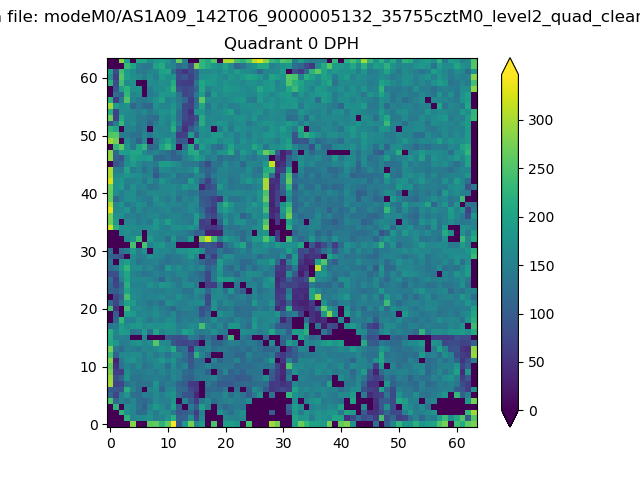 |
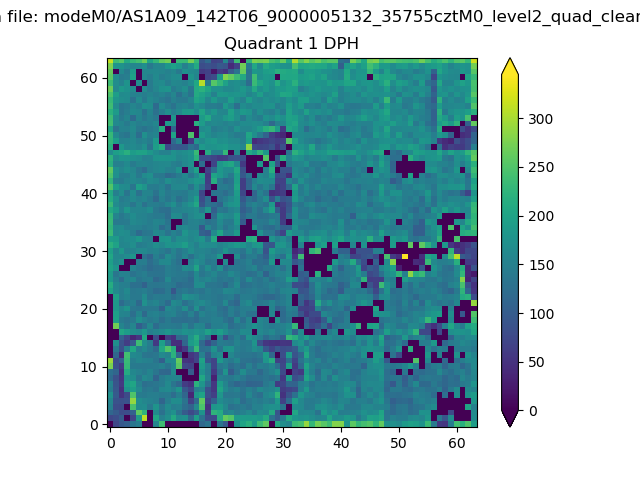 |
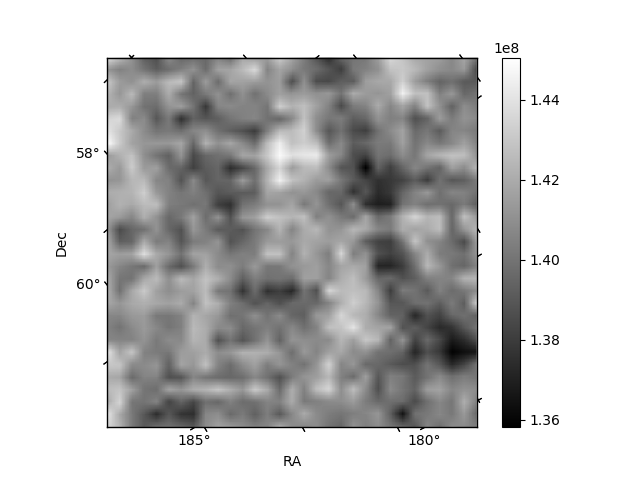
Quadrant B |
|---|---|---|---|
| Quadrant D | 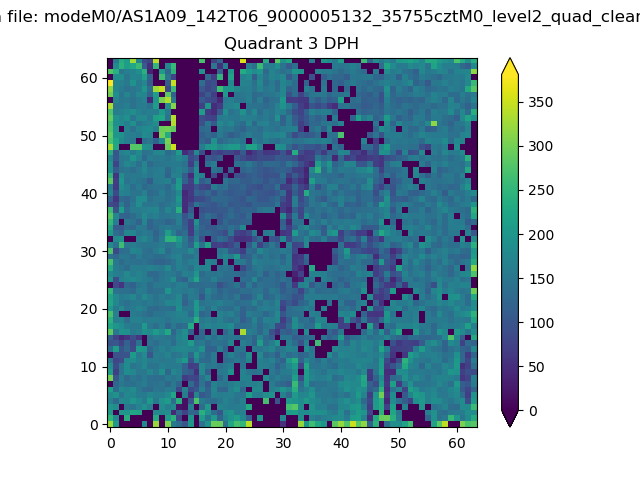 |
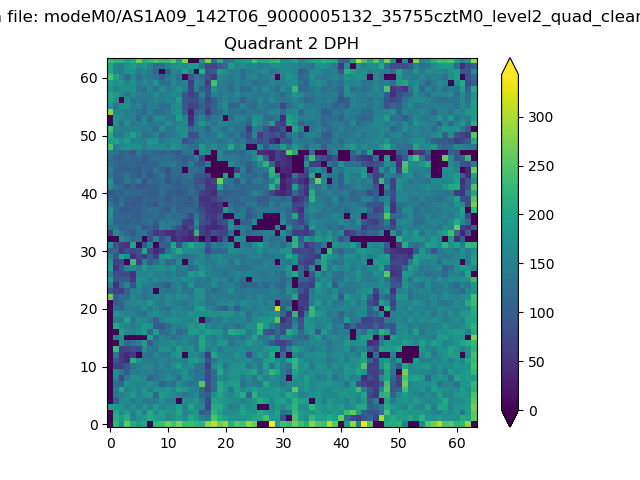 |
Quadrant C |
| Plot type | Count rate plots | Images |
|---|---|---|
| Comparison with Poisson distribution Blue bars denote a histogram of data divided into 1 sec bins. Red curve is a Poisson curve with rate = median count rate of data. |
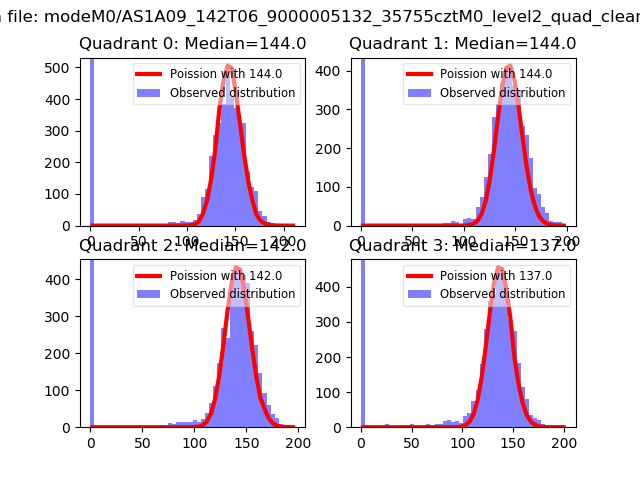 |
 |
| Quadrant-wise count rates Data is divided into 100 sec bins |
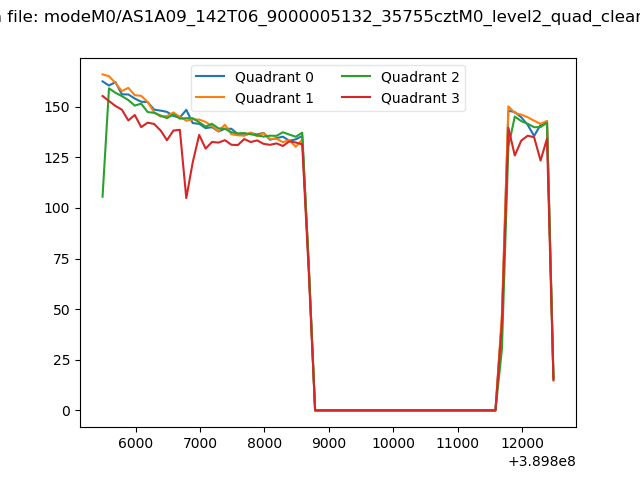 |
|
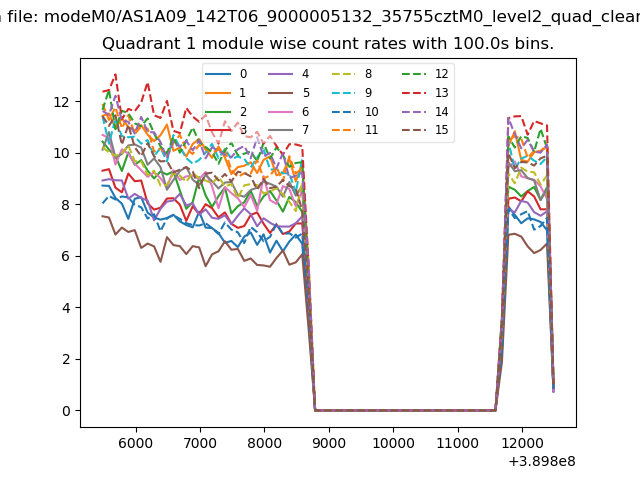
| Module-wise count rates for Quadrant A Data is divided into 100 sec bins |
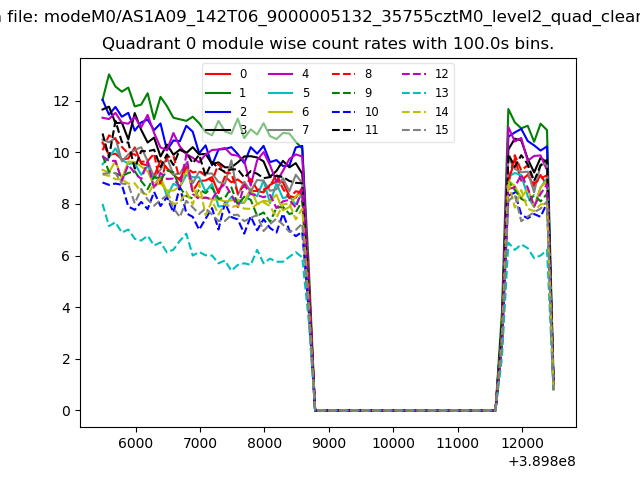 |
 |
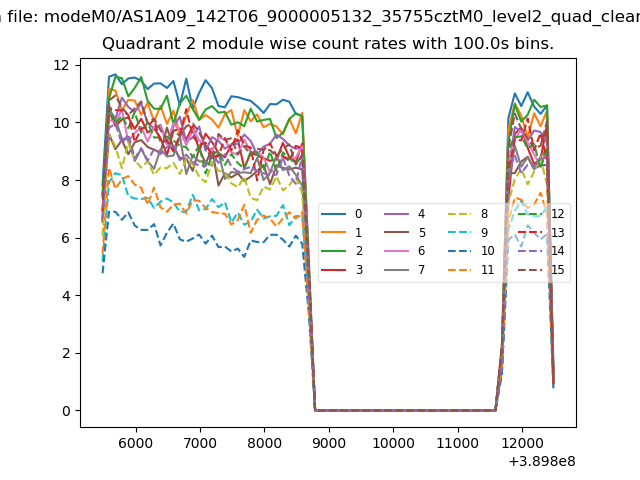
| Module-wise count rates for Quadrant B Data is divided into 100 sec bins |
 |
 |
| Module-wise count rates for Quadrant C Data is divided into 100 sec bins |
 |
 |
| Module-wise count rates for Quadrant D Data is divided into 100 sec bins |
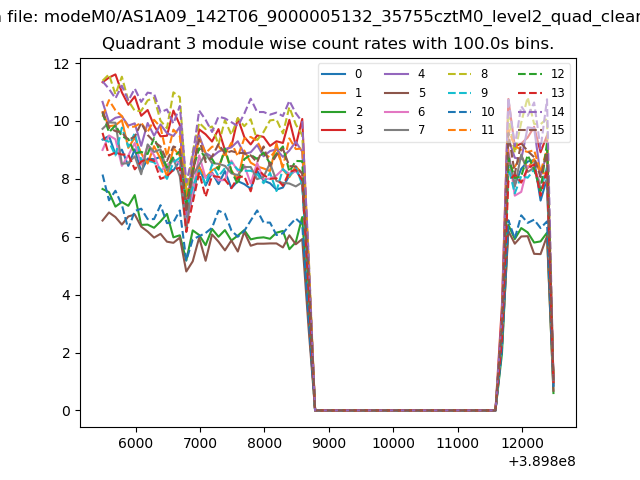 |
 |
| Parameter | Plot |
|---|---|
| CZT HV Monitor | 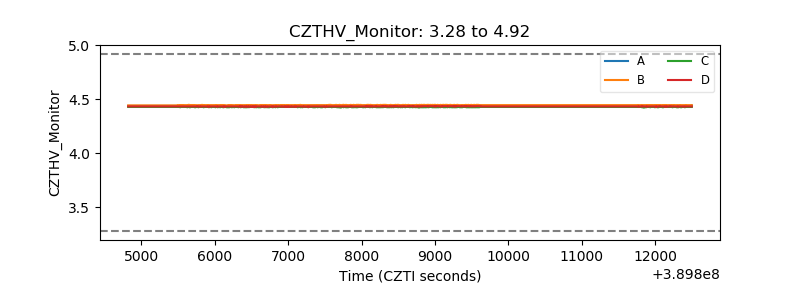 |
| D_VDD | 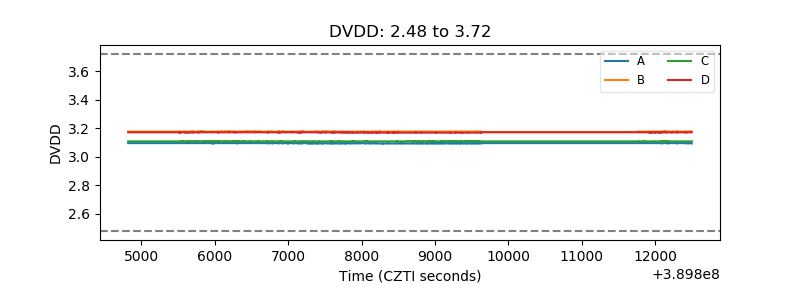 |
| Temperature 1 | 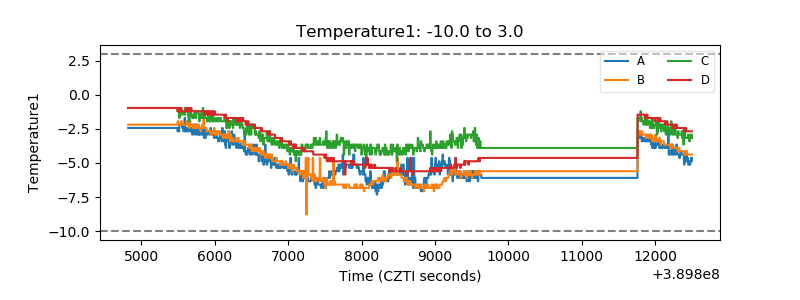 |
| Veto HV Monitor | 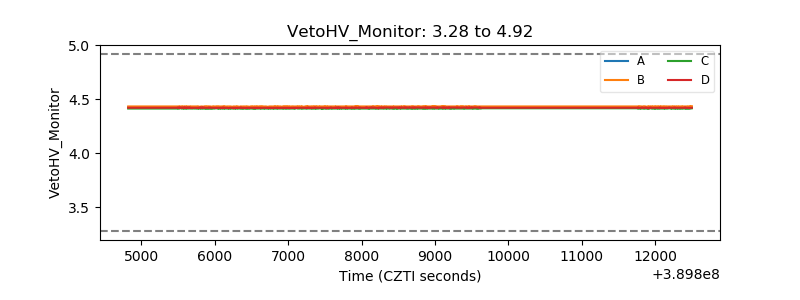 |
| Veto LLD | 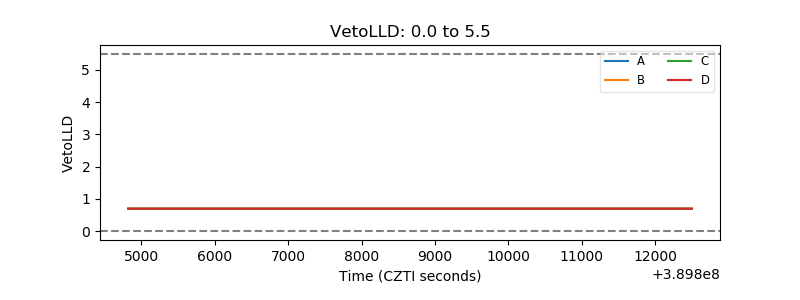 |
| Alpha Counter | 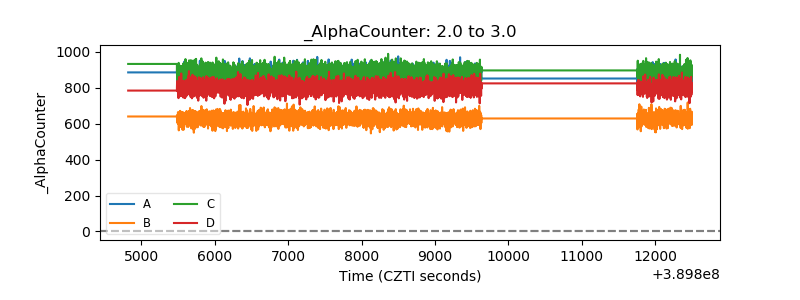 |
| _CPM_Rate | 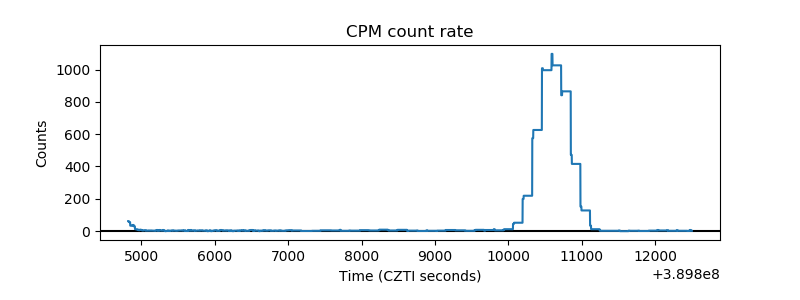 |
| CZT Counter | 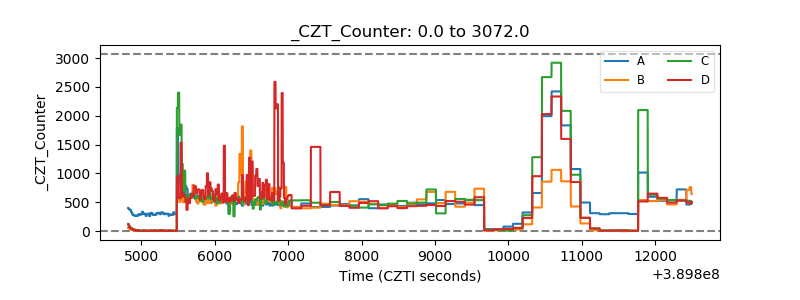 |
| +2.5 Volts monitor | 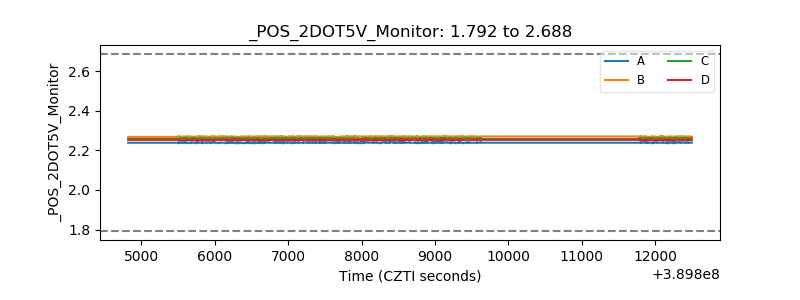 |
| +5 Volts monitor | 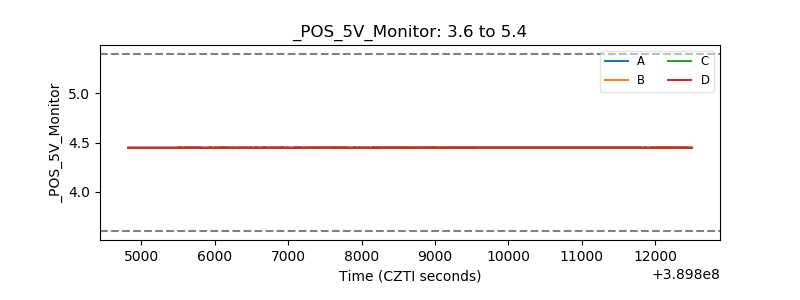 |
| _ROLL_ROT | 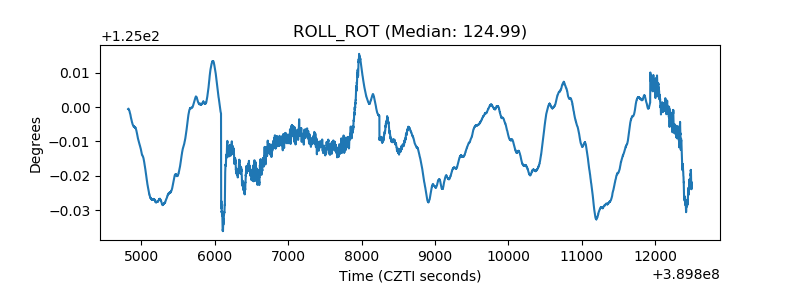 |
| _Roll_DEC | 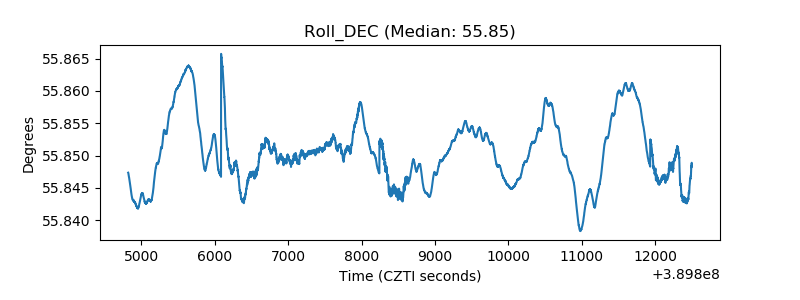 |
| _Roll_RA | 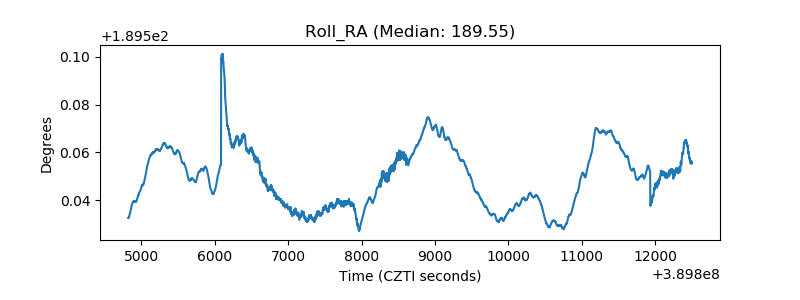 |
| Veto Counter | 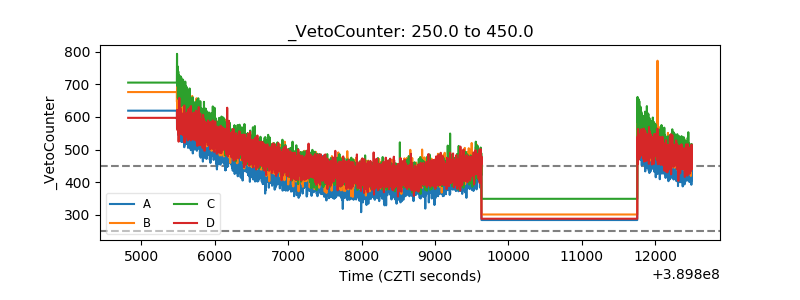 |