| Param | Original file | Final file |
|---|---|---|
| Filename | modeM0/AS1A09_142T06_9000005132_35754cztM0_level2.evt | modeM0/AS1A09_142T06_9000005132_35754cztM0_level2_quad_clean.evt |
| Size (bytes) | 427,849,920 | 98,213,760 |
| Size | 408.0 MB | 93.7 MB |
| Events in quadrant A | 3,056,997 | 664,037 |
| Events in quadrant B | 3,178,914 | 671,392 |
| Events in quadrant C | 2,833,520 | 660,191 |
| Events in quadrant D | 3,544,818 | 624,641 |
| Mode M0 | |||
|---|---|---|---|
| Quadrant | BADHDUFLAG | Total packets | Discarded packets |
| A | 0 | 12199 | 2 |
| B | 0 | 12623 | 1 |
| C | 0 | 11250 | 1 |
| D | 0 | 13877 | 1 |
| Mode SS | |||
|---|---|---|---|
| Quadrant | BADHDUFLAG | Total packets | Discarded packets |
| A | 0 | 102 | 0 |
| B | 0 | 102 | 0 |
| C | 0 | 102 | 0 |
| D | 0 | 102 | 0 |
| Mode M9 | |||
|---|---|---|---|
| Quadrant | BADHDUFLAG | Total packets | Discarded packets |
| A | 0 | 21 | 0 |
| B | 0 | 21 | 0 |
| C | 0 | 21 | 0 |
| D | 0 | 21 | 0 |
| Quadrant | Total seconds | Saturated seconds | Saturation percentage |
|---|---|---|---|
| A | 5054 | 238 | 4.709141% |
| B | 5054 | 131 | 2.592006% |
| C | 5054 | 76 | 1.503759% |
| D | 5054 | 202 | 3.996834% |
Noise dominated data is calculated using 1-second bins in cleaned event files. If a bin has >2000 counts, and if more than 50% of those come from <1% of pixels, then it is considered to be noise-dominated and hence unusable.
| Quadrant | # 1 sec bins | Bins with >0 counts | Bins with >2000 counts | High rate bins dominated by noise | Noise dominated (total time) | Noise dominated (detector-on time) | Marked lightcurve |
|---|---|---|---|---|---|---|---|
| A | 7147 | 5055 | 230 | 230 | 3.22% | 4.55% | 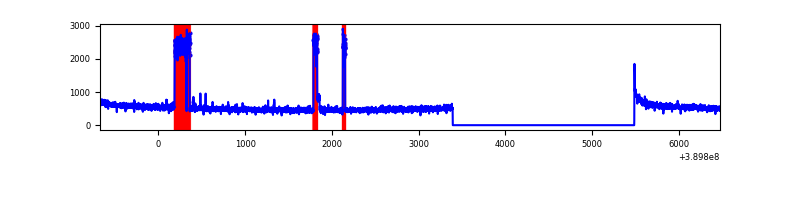 |
| B | 7147 | 5055 | 103 | 103 | 1.44% | 2.04% | 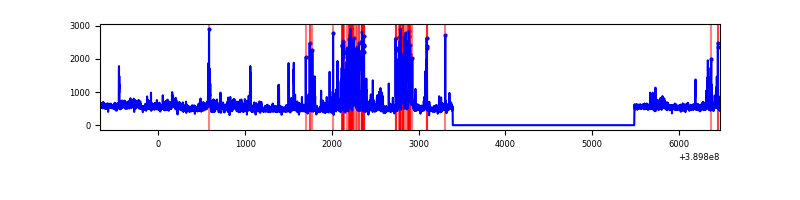 |
| C | 7147 | 5055 | 63 | 63 | 0.88% | 1.25% | 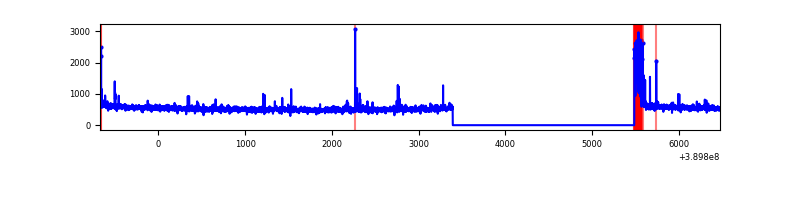 |
| D | 7147 | 5055 | 189 | 189 | 2.64% | 3.74% | 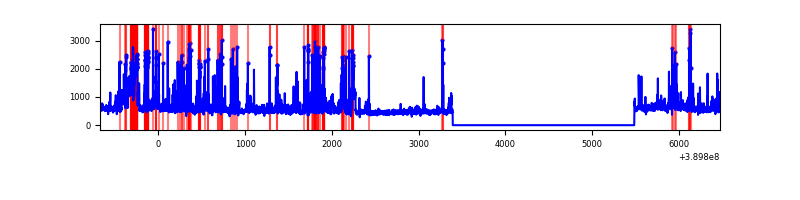 |
Top three noisy pixels from each quadrant. If the there are fewer than three noisy pixels in the level2.evt file, extra rows are filled as -1
| Pixel properties | Quadrant properties | ||||||
|---|---|---|---|---|---|---|---|
| Quadrant | DetID | PixID | Counts | Sigma | Mean | Median | Sigma |
| A | 8 | 192 | 508806 | 4146.07 | 624 | 614 | 122.6 |
| A | 10 | 83 | 130210 | 1057.31 | 624 | 614 | 122.6 |
| A | 13 | 254 | 6869 | 51.03 | 624 | 614 | 122.6 |
| B | 5 | 172 | 448462 | 3899.54 | 619 | 605 | 114.8 |
| B | 0 | 190 | 98774 | 854.77 | 619 | 605 | 114.8 |
| B | 4 | 232 | 62486 | 538.81 | 619 | 605 | 114.8 |
| C | 15 | 214 | 213854 | 1508.67 | 616 | 621 | 141.3 |
| C | 0 | 10 | 206808 | 1458.82 | 616 | 621 | 141.3 |
| C | 2 | 16 | 6548 | 41.93 | 616 | 621 | 141.3 |
| D | 13 | 249 | 326811 | 2160.71 | 616 | 601 | 151.0 |
| D | 14 | 52 | 288791 | 1908.88 | 616 | 601 | 151.0 |
| D | 13 | 13 | 142902 | 942.56 | 616 | 601 | 151.0 |
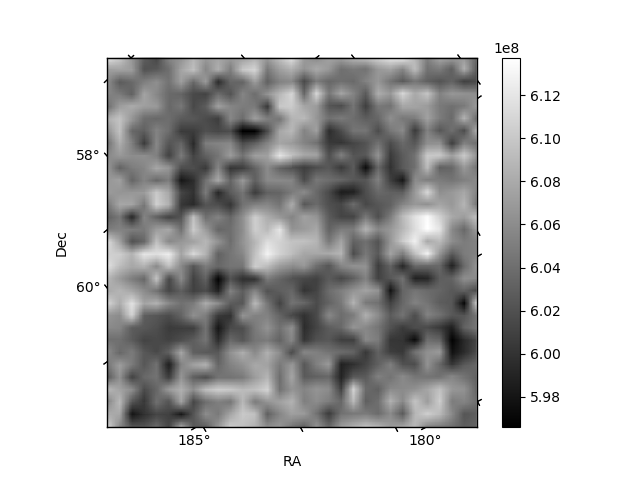
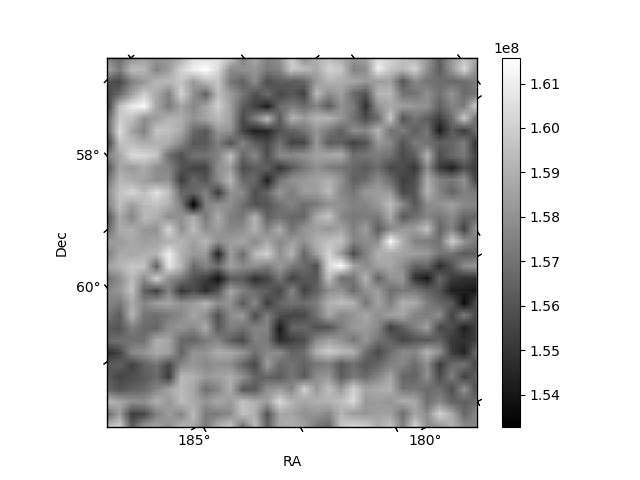
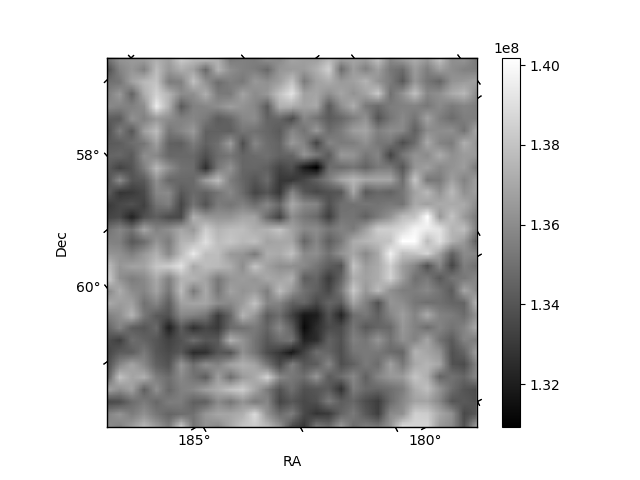
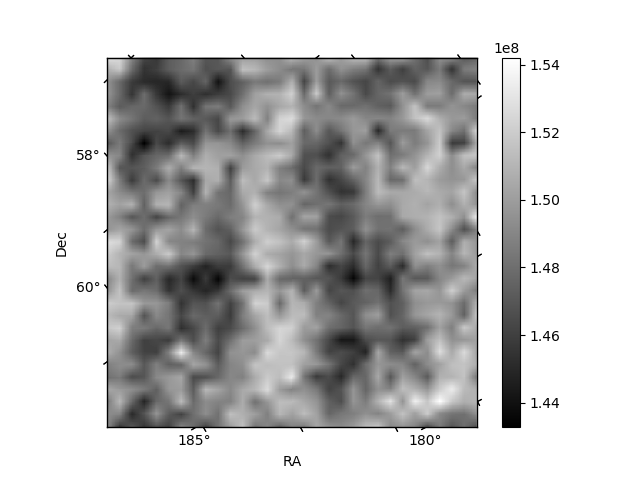
Histogram calculated using DETX and DETY for each event in the final _common_clean file
| Quadrant A | 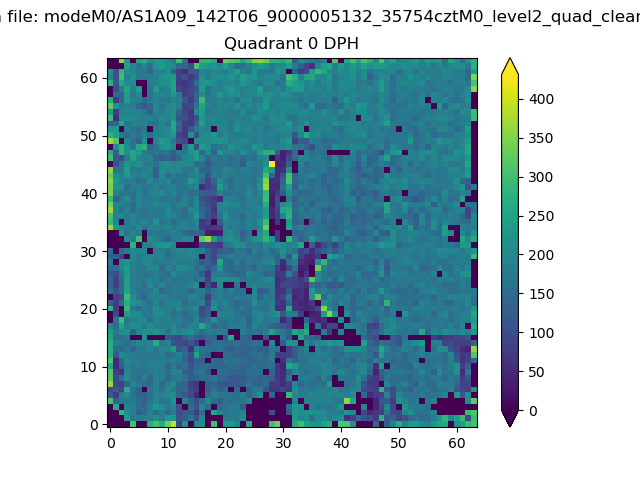 |
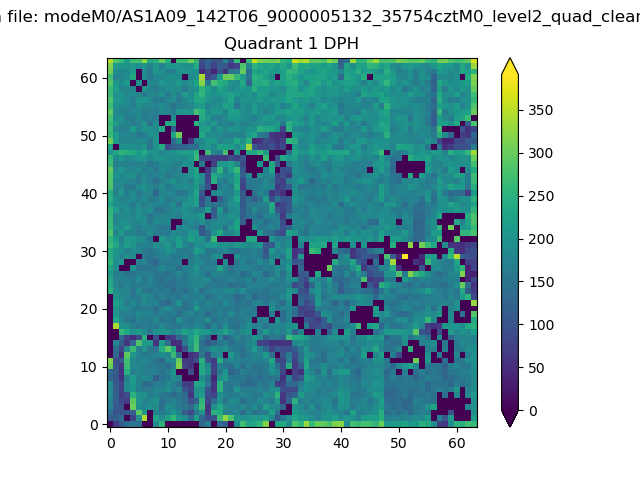 |
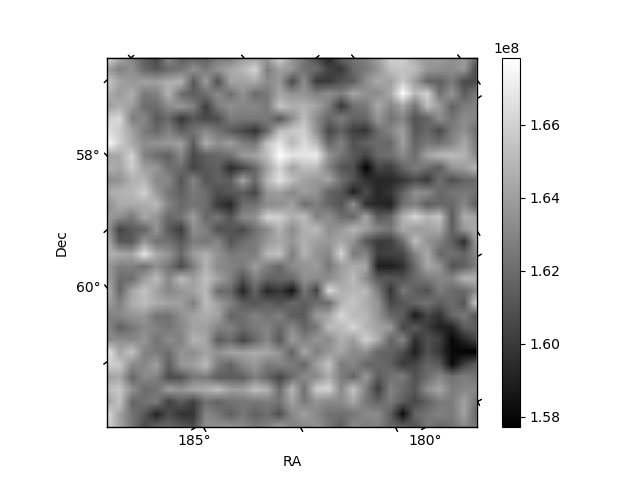
Quadrant B |
|---|---|---|---|
| Quadrant D | 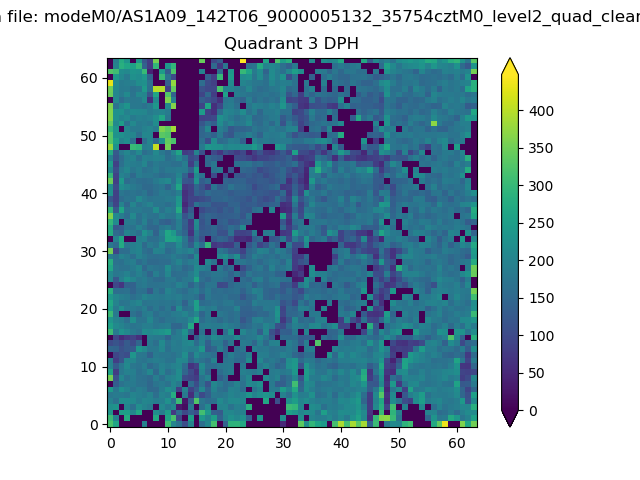 |
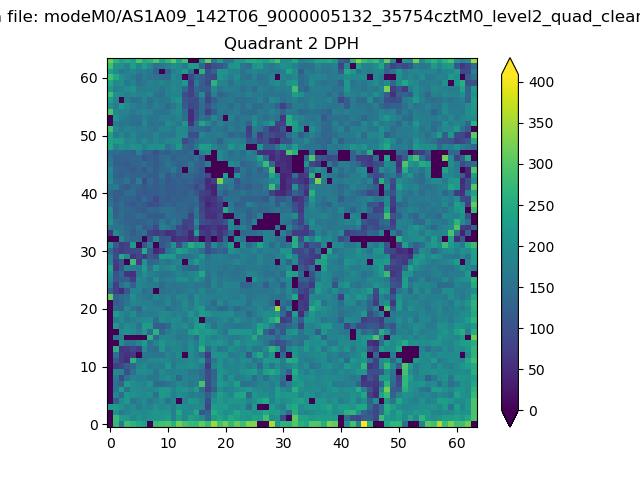 |
Quadrant C |
| Plot type | Count rate plots | Images |
|---|---|---|
| Comparison with Poisson distribution Blue bars denote a histogram of data divided into 1 sec bins. Red curve is a Poisson curve with rate = median count rate of data. |
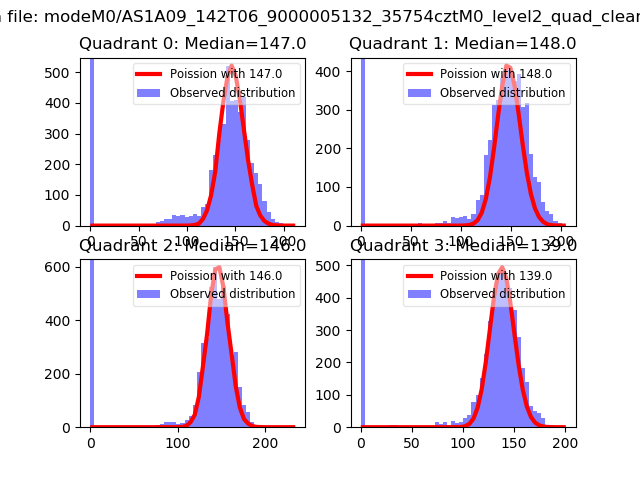 |
 |
| Quadrant-wise count rates Data is divided into 100 sec bins |
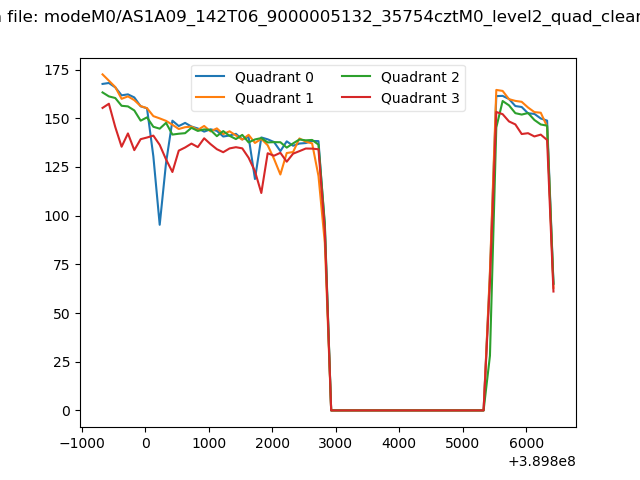 |
|
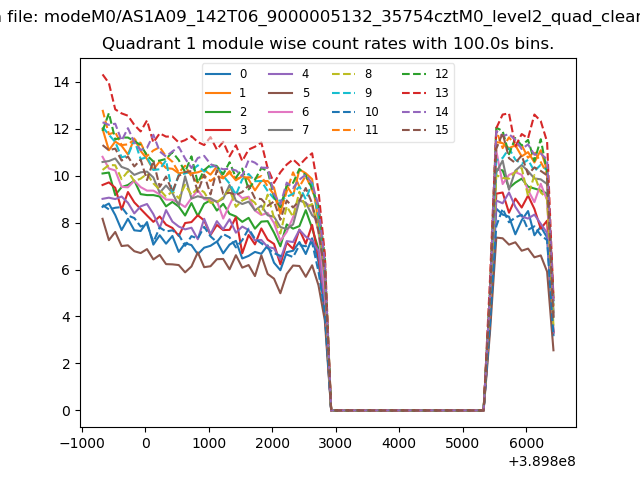
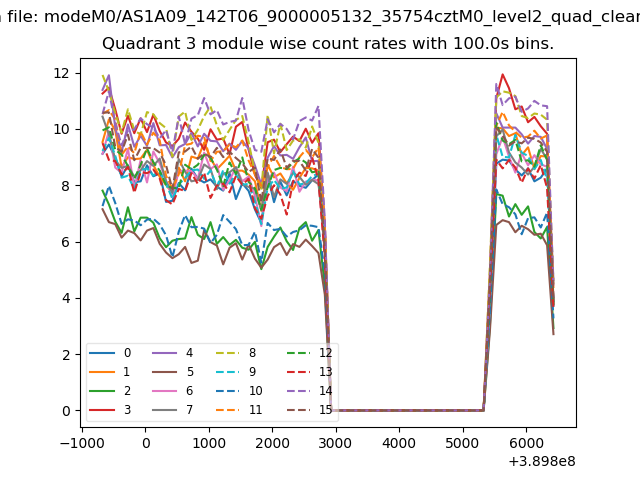
| Module-wise count rates for Quadrant A Data is divided into 100 sec bins |
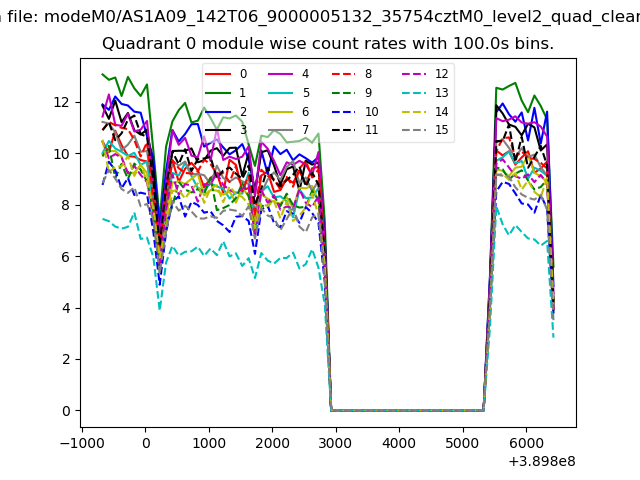 |
 |
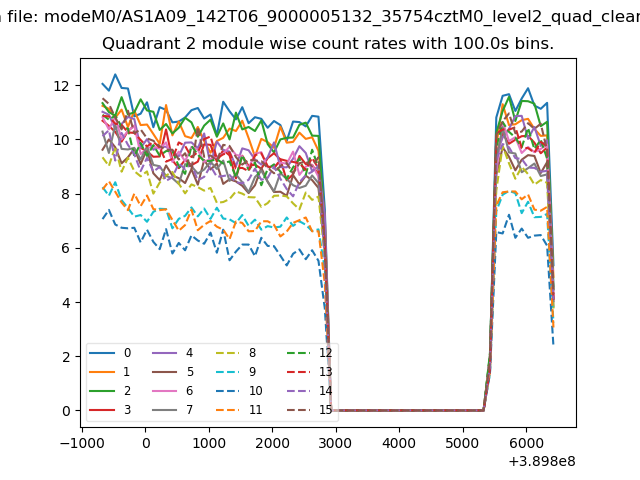
| Module-wise count rates for Quadrant B Data is divided into 100 sec bins |
 |
 |
| Module-wise count rates for Quadrant C Data is divided into 100 sec bins |
 |
 |
| Module-wise count rates for Quadrant D Data is divided into 100 sec bins |
 |
 |
| Parameter | Plot |
|---|---|
| CZT HV Monitor | 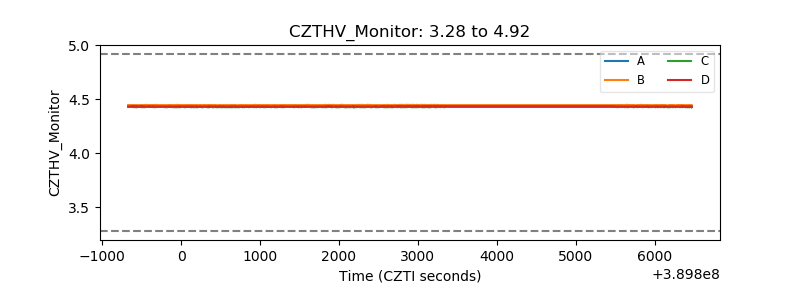 |
| D_VDD | 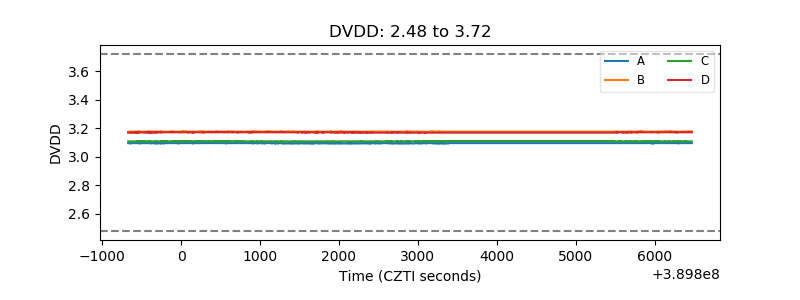 |
| Temperature 1 | 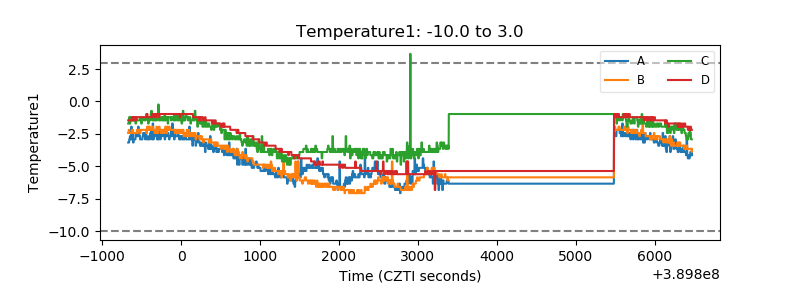 |
| Veto HV Monitor | 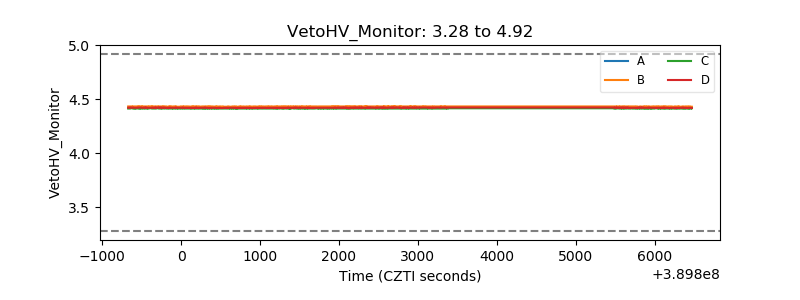 |
| Veto LLD | 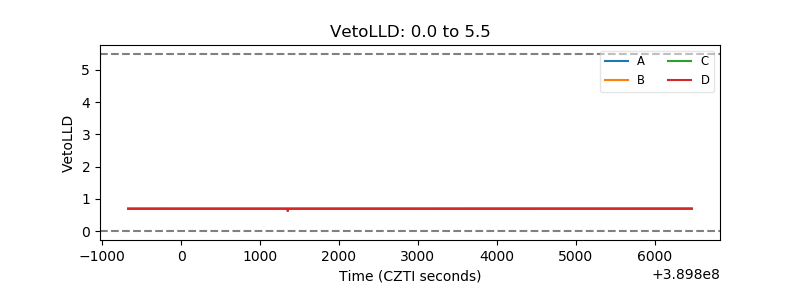 |
| Alpha Counter | 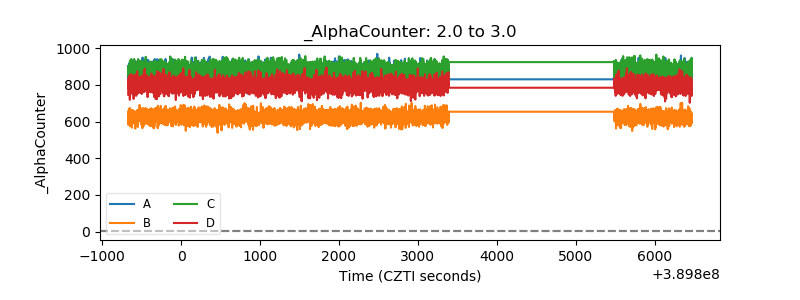 |
| _CPM_Rate | 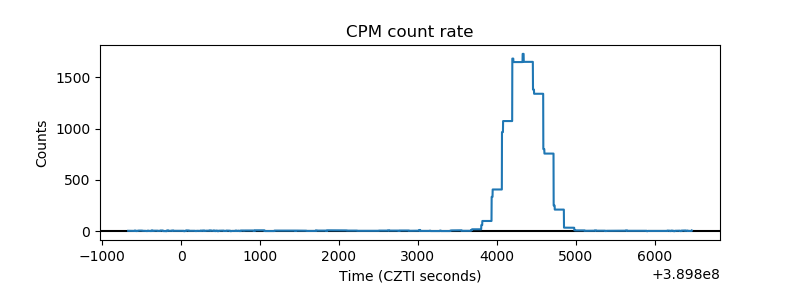 |
| CZT Counter | 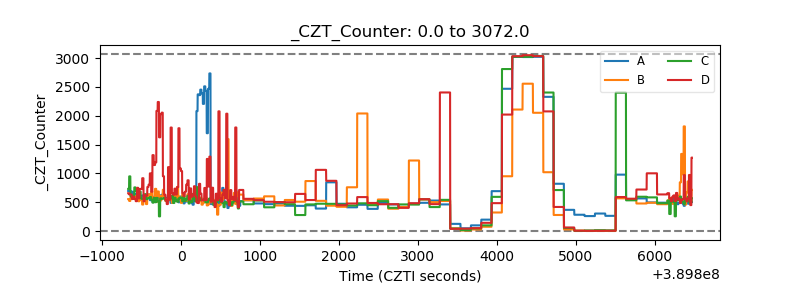 |
| +2.5 Volts monitor | 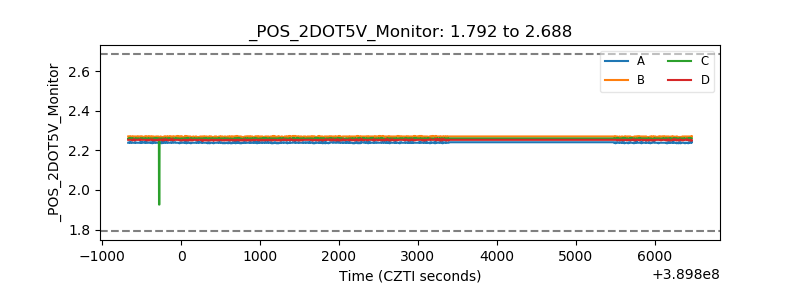 |
| +5 Volts monitor | 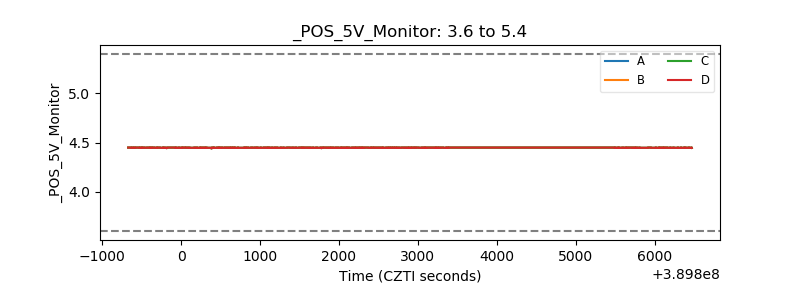 |
| _ROLL_ROT | 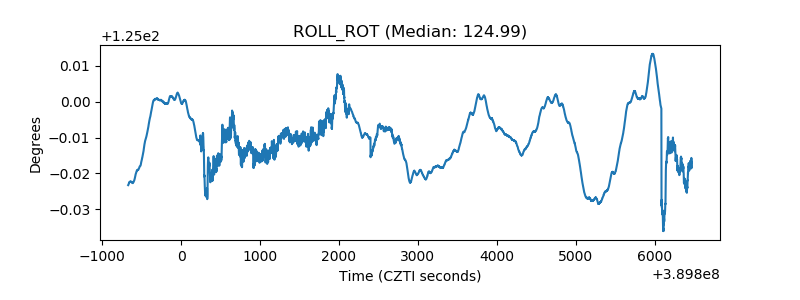 |
| _Roll_DEC | 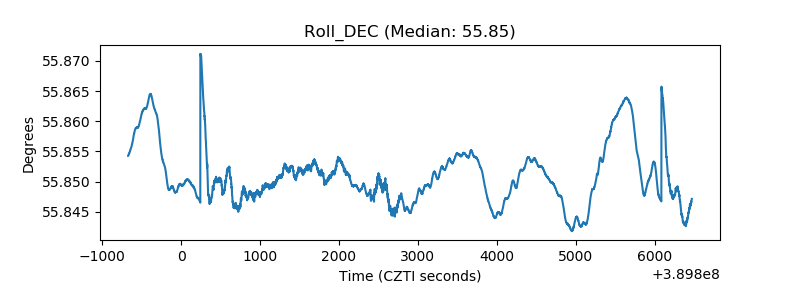 |
| _Roll_RA | 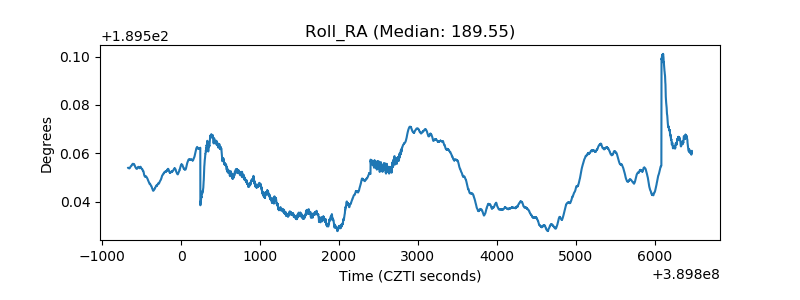 |
| Veto Counter | 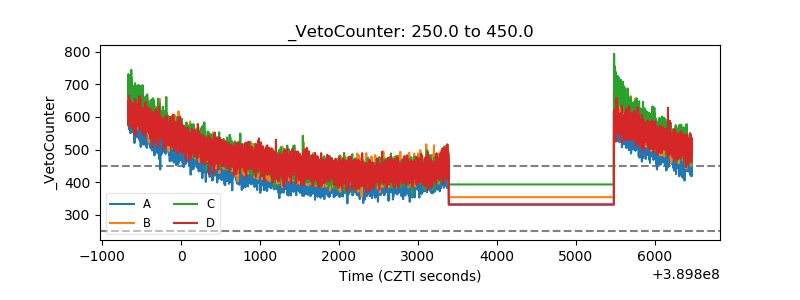 |