| Param | Original file | Final file |
|---|---|---|
| Filename | modeM0/AS1A09_142T06_9000005132_35753cztM0_level2.evt | modeM0/AS1A09_142T06_9000005132_35753cztM0_level2_quad_clean.evt |
| Size (bytes) | 159,505,920 | 37,347,840 |
| Size | 152.1 MB | 35.6 MB |
| Events in quadrant A | 1,121,891 | 253,456 |
| Events in quadrant B | 1,052,730 | 258,147 |
| Events in quadrant C | 1,162,532 | 244,885 |
| Events in quadrant D | 1,364,661 | 238,320 |
| Mode M0 | |||
|---|---|---|---|
| Quadrant | BADHDUFLAG | Total packets | Discarded packets |
| A | 0 | 4509 | 2 |
| B | 0 | 4293 | 1 |
| C | 0 | 4538 | 1 |
| D | 0 | 5284 | 1 |
| Mode SS | |||
|---|---|---|---|
| Quadrant | BADHDUFLAG | Total packets | Discarded packets |
| A | 0 | 40 | 0 |
| B | 0 | 40 | 0 |
| C | 0 | 40 | 0 |
| D | 0 | 40 | 0 |
| Mode M9 | |||
|---|---|---|---|
| Quadrant | BADHDUFLAG | Total packets | Discarded packets |
| A | 0 | 20 | 0 |
| B | 0 | 20 | 0 |
| C | 0 | 20 | 0 |
| D | 0 | 20 | 0 |
| Quadrant | Total seconds | Saturated seconds | Saturation percentage |
|---|---|---|---|
| A | 1859 | 67 | 3.604088% |
| B | 1859 | 7 | 0.376547% |
| C | 1859 | 72 | 3.873050% |
| D | 1859 | 89 | 4.787520% |
Noise dominated data is calculated using 1-second bins in cleaned event files. If a bin has >2000 counts, and if more than 50% of those come from <1% of pixels, then it is considered to be noise-dominated and hence unusable.
| Quadrant | # 1 sec bins | Bins with >0 counts | Bins with >2000 counts | High rate bins dominated by noise | Noise dominated (total time) | Noise dominated (detector-on time) | Marked lightcurve |
|---|---|---|---|---|---|---|---|
| A | 3860 | 1859 | 58 | 58 | 1.50% | 3.12% | 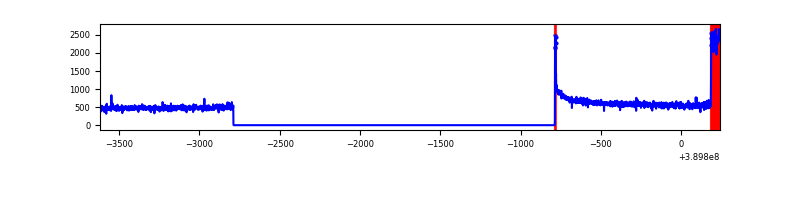 |
| B | 3861 | 1860 | 1 | 1 | 0.03% | 0.05% | 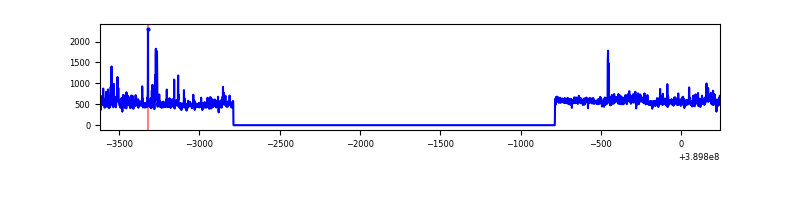 |
| C | 3861 | 1860 | 64 | 64 | 1.66% | 3.44% | 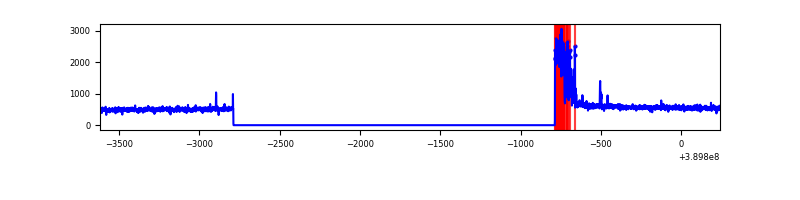 |
| D | 3861 | 1860 | 86 | 86 | 2.23% | 4.62% | 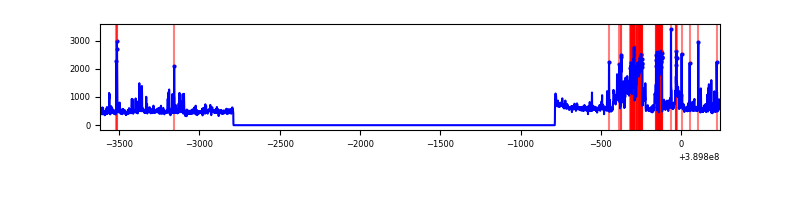 |
Top three noisy pixels from each quadrant. If the there are fewer than three noisy pixels in the level2.evt file, extra rows are filled as -1
| Pixel properties | Quadrant properties | ||||||
|---|---|---|---|---|---|---|---|
| Quadrant | DetID | PixID | Counts | Sigma | Mean | Median | Sigma |
| A | 8 | 192 | 118113 | 2379.38 | 241 | 236 | 49.5 |
| A | 10 | 83 | 65550 | 1318.38 | 241 | 236 | 49.5 |
| A | 13 | 6 | 4820 | 92.53 | 241 | 236 | 49.5 |
| B | 5 | 172 | 30046 | 632.21 | 238 | 232 | 47.2 |
| B | 0 | 189 | 27727 | 583.04 | 238 | 232 | 47.2 |
| B | 0 | 197 | 23492 | 493.23 | 238 | 232 | 47.2 |
| C | 0 | 10 | 178418 | 3309.13 | 229 | 231 | 53.8 |
| C | 15 | 214 | 79782 | 1477.35 | 229 | 231 | 53.8 |
| C | 2 | 16 | 5039 | 89.29 | 229 | 231 | 53.8 |
| D | 14 | 52 | 287403 | 4984.37 | 232 | 226 | 57.6 |
| D | 13 | 249 | 46700 | 806.62 | 232 | 226 | 57.6 |
| D | 13 | 13 | 38538 | 664.96 | 232 | 226 | 57.6 |
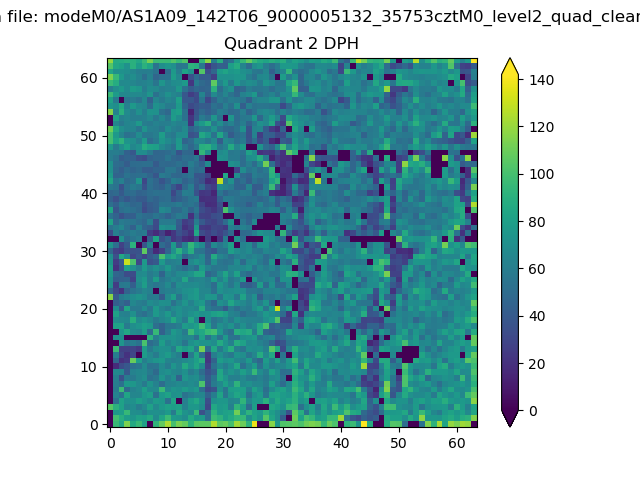
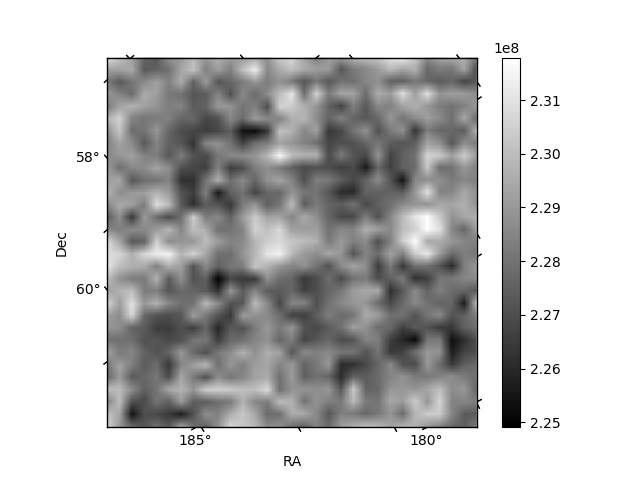
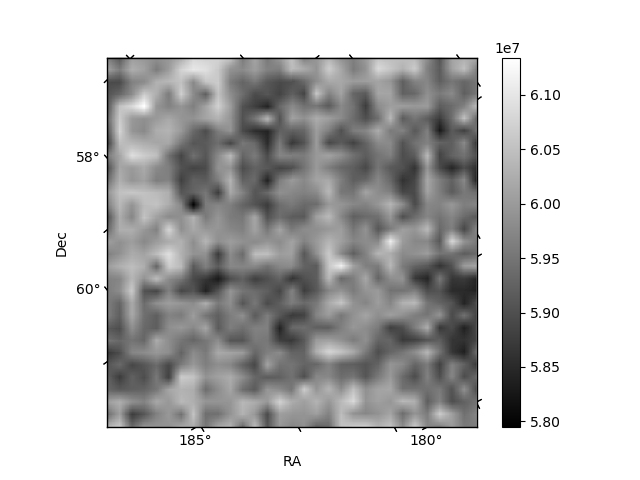
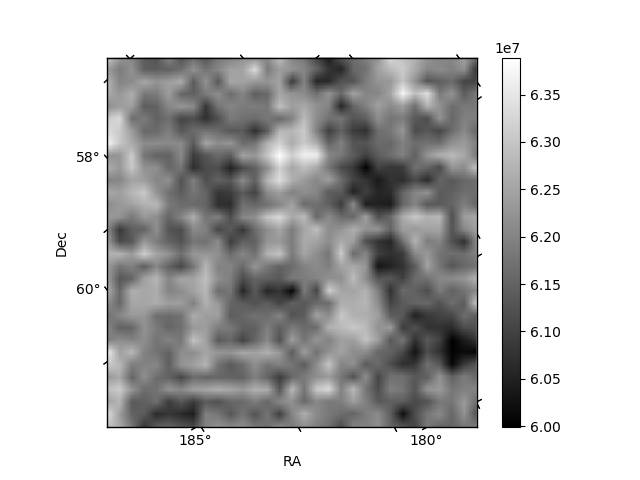
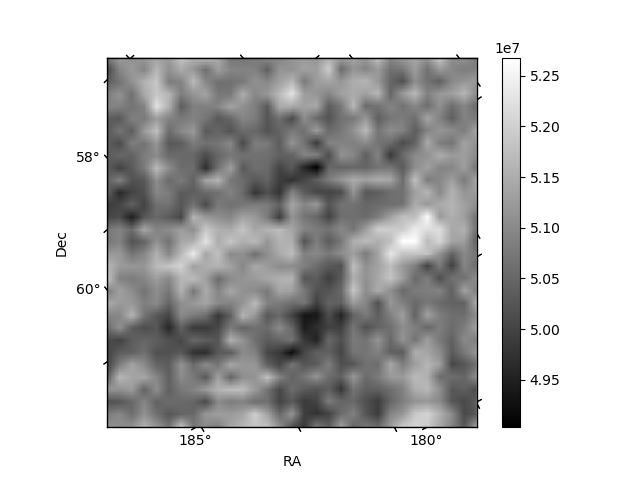
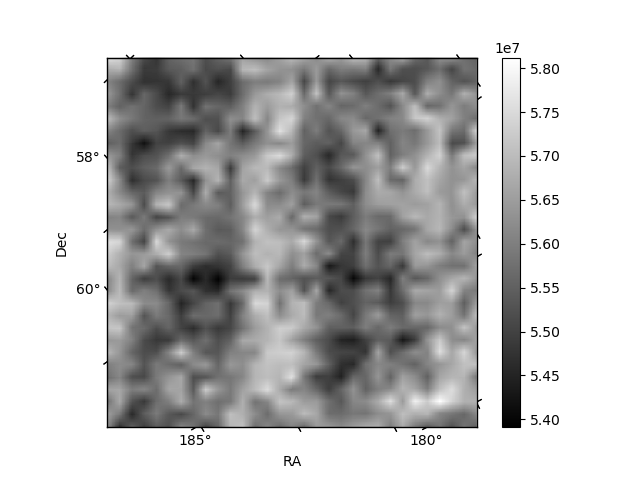
Histogram calculated using DETX and DETY for each event in the final _common_clean file
| Quadrant A | 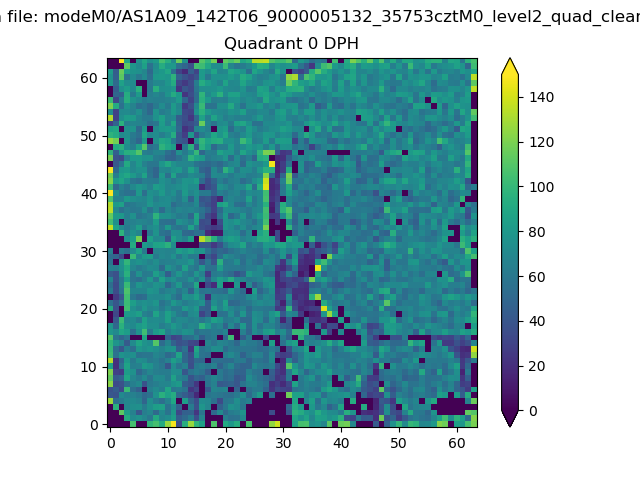 |
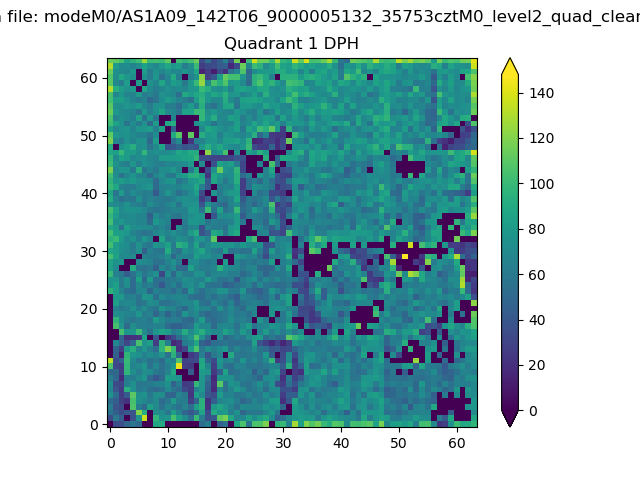 |
Quadrant B |
|---|---|---|---|
| Quadrant D | 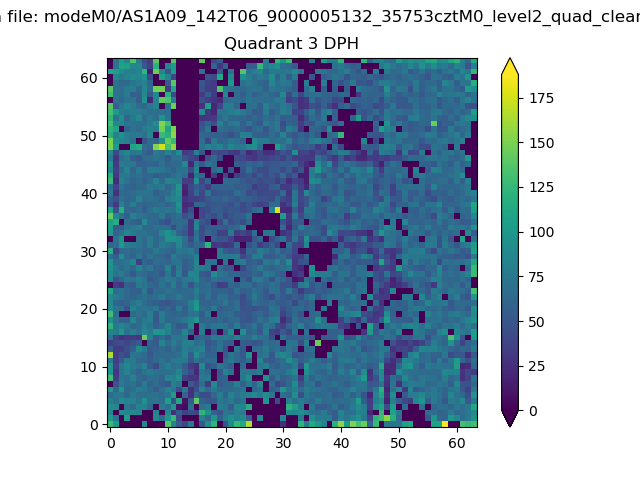 |
 |
Quadrant C |
| Plot type | Count rate plots | Images |
|---|---|---|
| Comparison with Poisson distribution Blue bars denote a histogram of data divided into 1 sec bins. Red curve is a Poisson curve with rate = median count rate of data. |
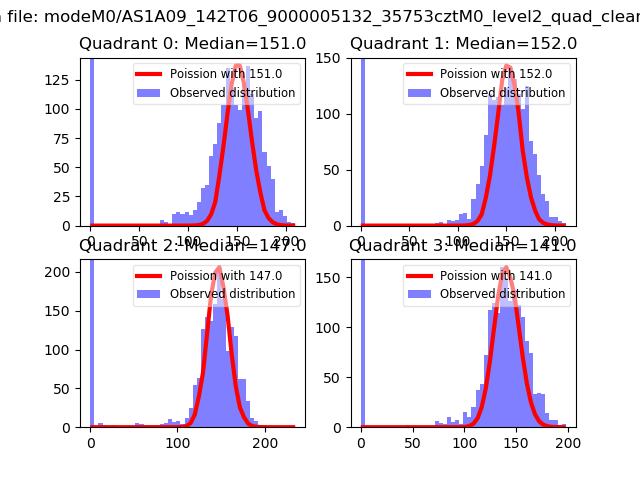 |
 |
| Quadrant-wise count rates Data is divided into 100 sec bins |
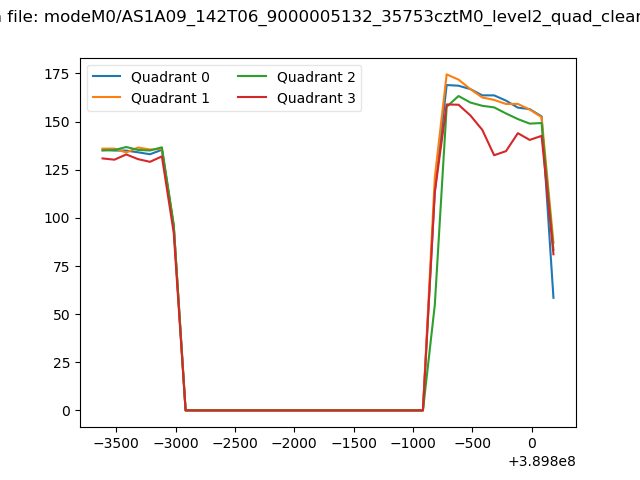 |
|
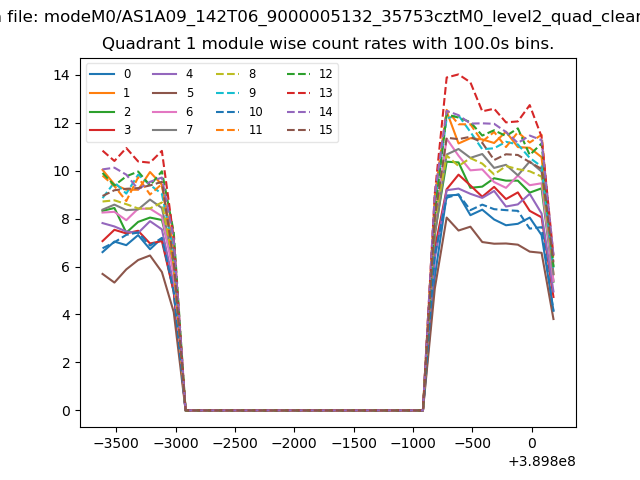
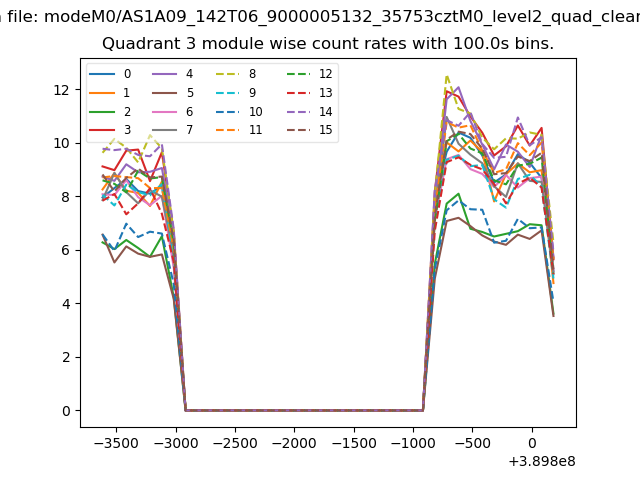
| Module-wise count rates for Quadrant A Data is divided into 100 sec bins |
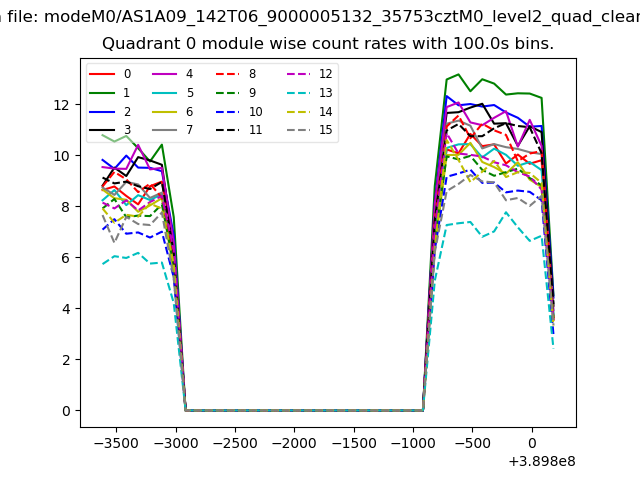 |
 |
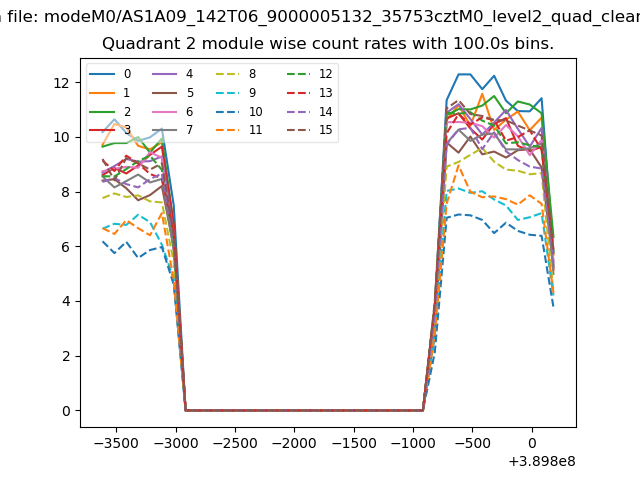
| Module-wise count rates for Quadrant B Data is divided into 100 sec bins |
 |
 |
| Module-wise count rates for Quadrant C Data is divided into 100 sec bins |
 |
 |
| Module-wise count rates for Quadrant D Data is divided into 100 sec bins |
 |
 |
| Parameter | Plot |
|---|---|
| CZT HV Monitor | 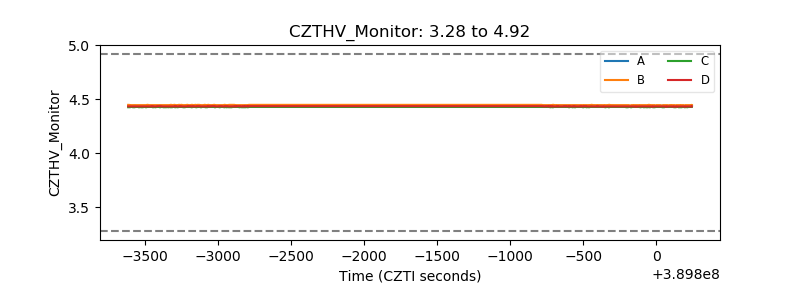 |
| D_VDD | 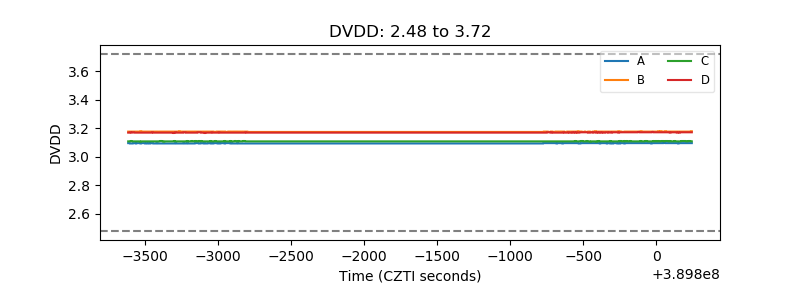 |
| Temperature 1 | 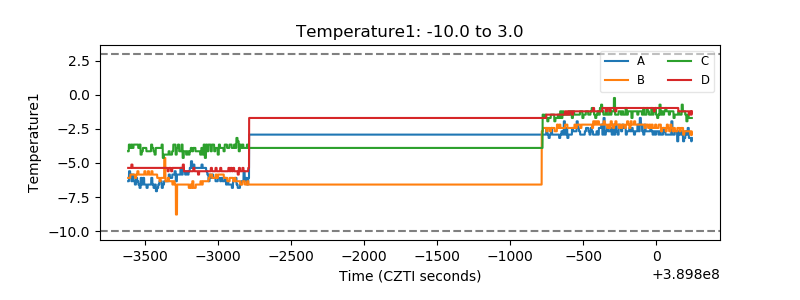 |
| Veto HV Monitor | 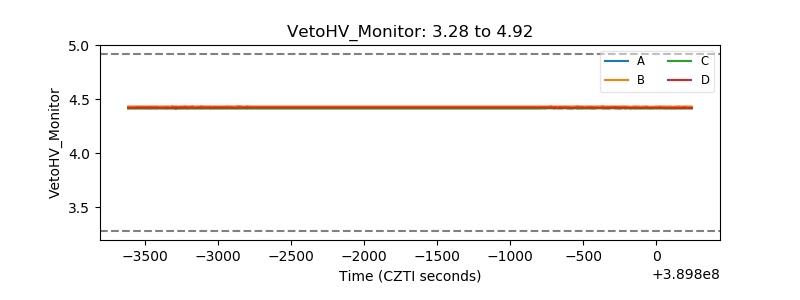 |
| Veto LLD | 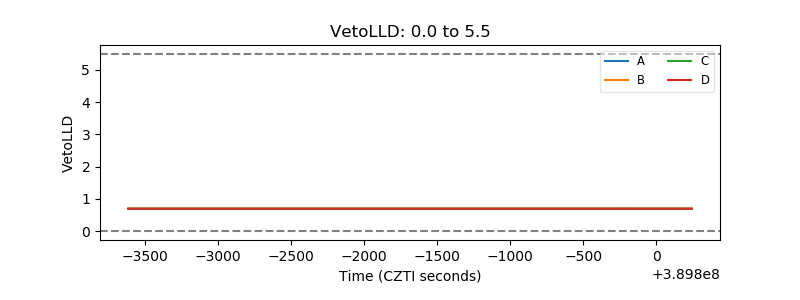 |
| Alpha Counter | 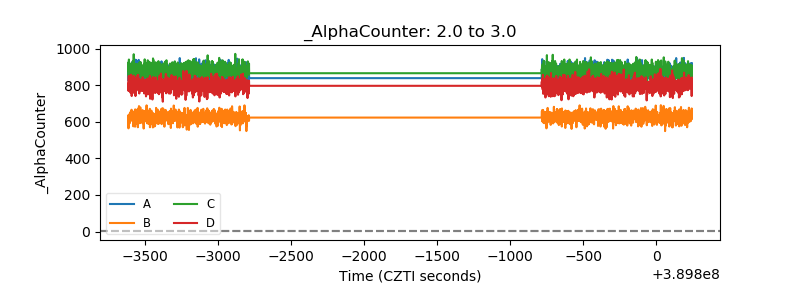 |
| _CPM_Rate | 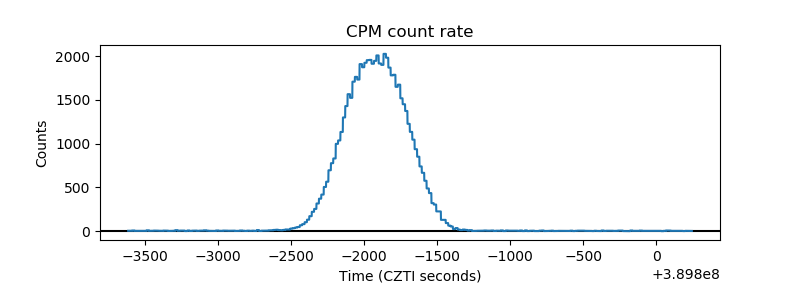 |
| CZT Counter | 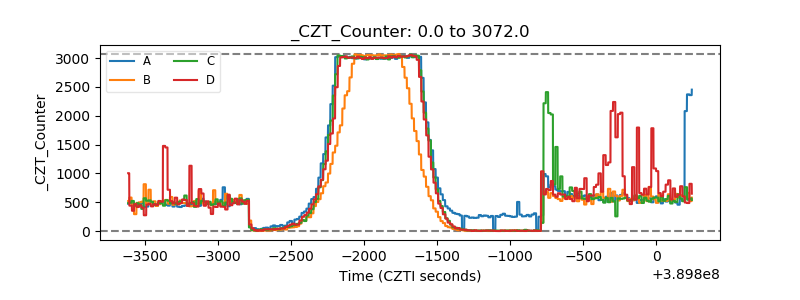 |
| +2.5 Volts monitor | 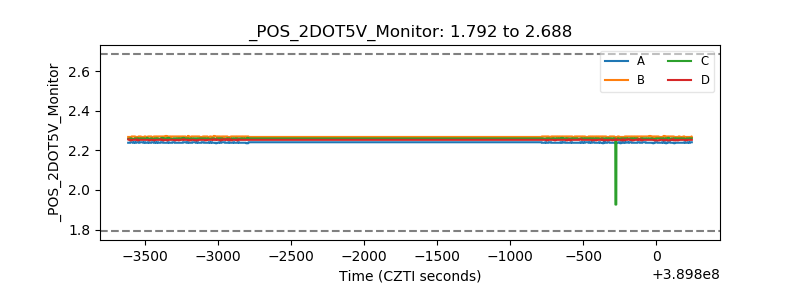 |
| +5 Volts monitor | 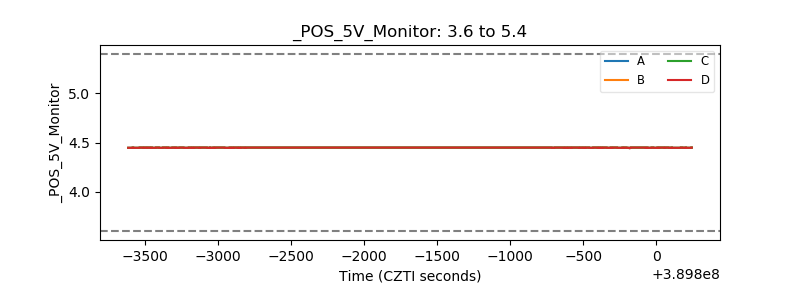 |
| _ROLL_ROT | 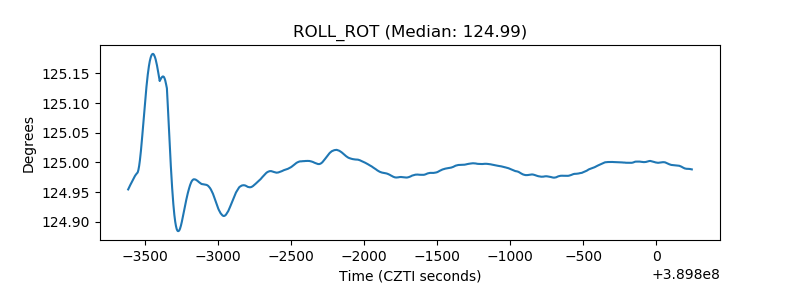 |
| _Roll_DEC | 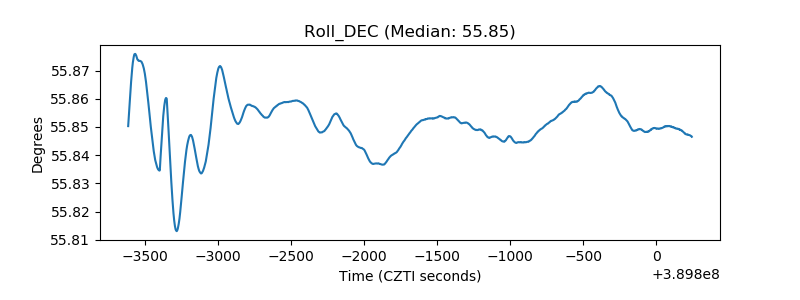 |
| _Roll_RA | 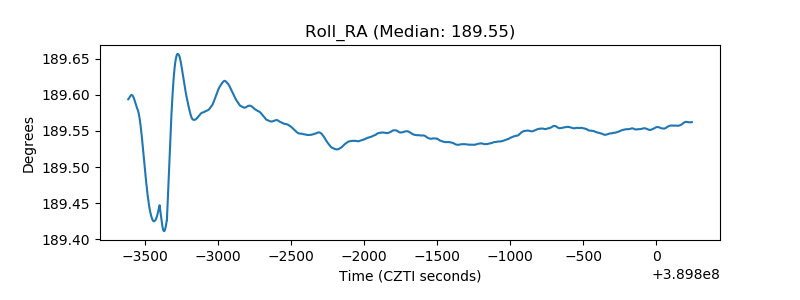 |
| Veto Counter | 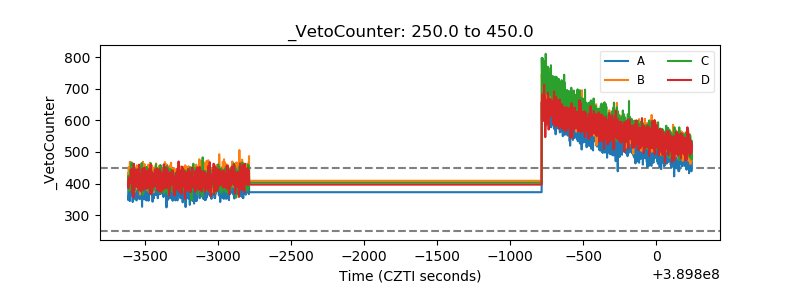 |