| Param | Original file | Final file |
|---|---|---|
| Filename | modeM0/AS1A09_142T06_9000005132cztM0_level2_bc.evt | modeM0/AS1A09_142T06_9000005132cztM0_level2_quad_clean.evt |
| Size (bytes) | 833,909,760 | 284,529,600 |
| Size | 795.3 MB | 271.3 MB |
| Events in quadrant A | 5,597,851 | 1,855,969 |
| Events in quadrant B | 6,204,749 | 1,876,107 |
| Events in quadrant C | 5,204,019 | 1,854,314 |
| Events in quadrant D | 6,991,817 | 1,765,099 |
| Mode M0 | |||
|---|---|---|---|
| Quadrant | BADHDUFLAG | Total packets | Discarded packets |
| A | 0 | 42002 | 0 |
| B | 0 | 47127 | 0 |
| C | 0 | 40053 | 0 |
| D | 0 | 47739 | 0 |
| Mode SS | |||
|---|---|---|---|
| Quadrant | BADHDUFLAG | Total packets | Discarded packets |
| A | 0 | 378 | 0 |
| B | 0 | 378 | 0 |
| C | 0 | 378 | 0 |
| D | 0 | 378 | 0 |
| Mode M9 | |||
|---|---|---|---|
| Quadrant | BADHDUFLAG | Total packets | Discarded packets |
| A | 0 | 102 | 0 |
| B | 0 | 102 | 0 |
| C | 0 | 102 | 0 |
| D | 0 | 102 | 0 |
| Quadrant | Total seconds | Saturated seconds | Saturation percentage |
|---|---|---|---|
| A | 18375 | 481 | 2.617687% |
| B | 18375 | 999 | 5.436735% |
| C | 18375 | 296 | 1.610884% |
| D | 18375 | 715 | 3.891156% |
Noise dominated data is calculated using 1-second bins in cleaned event files. If a bin has >2000 counts, and if more than 50% of those come from <1% of pixels, then it is considered to be noise-dominated and hence unusable.
| Quadrant | # 1 sec bins | Bins with >0 counts | Bins with >2000 counts | High rate bins dominated by noise | Noise dominated (total time) | Noise dominated (detector-on time) | Marked lightcurve |
|---|---|---|---|---|---|---|---|
| A | 28566 | 18380 | 317 | 317 | 1.11% | 1.72% | 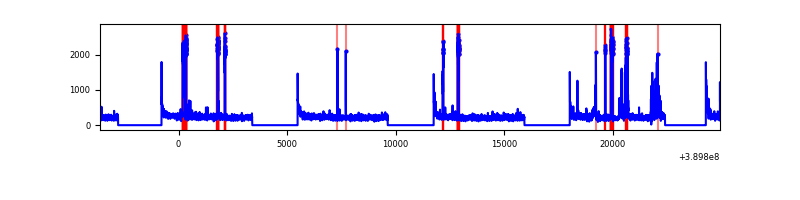 |
| B | 28566 | 18374 | 12 | 12 | 0.04% | 0.07% | 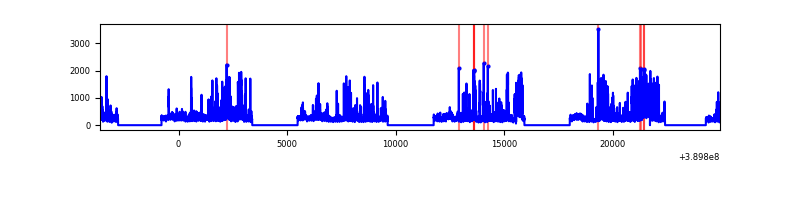 |
| C | 28566 | 18375 | 9 | 9 | 0.03% | 0.05% | 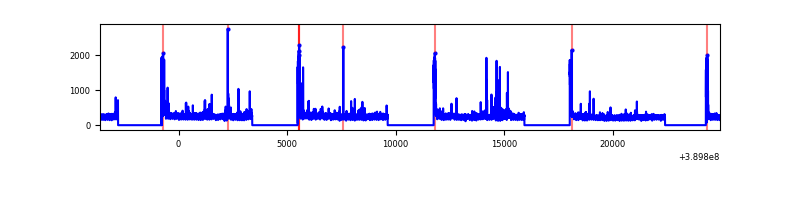 |
| D | 28566 | 18374 | 213 | 213 | 0.75% | 1.16% | 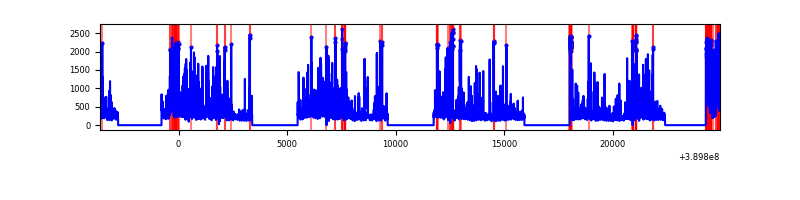 |
Top three noisy pixels from each quadrant. If the there are fewer than three noisy pixels in the level2.evt file, extra rows are filled as -1
| Pixel properties | Quadrant properties | ||||||
|---|---|---|---|---|---|---|---|
| Quadrant | DetID | PixID | Counts | Sigma | Mean | Median | Sigma |
| A | 8 | 192 | 902032 | 4123.37 | 993 | 981 | 218.5 |
| A | 10 | 83 | 436616 | 1993.54 | 993 | 981 | 218.5 |
| A | 15 | 223 | 268033 | 1222.08 | 993 | 981 | 218.5 |
| B | 5 | 172 | 1839324 | 9509.99 | 977 | 958 | 193.3 |
| B | 0 | 190 | 182113 | 937.13 | 977 | 958 | 193.3 |
| B | 4 | 232 | 128234 | 658.41 | 977 | 958 | 193.3 |
| C | 15 | 214 | 729325 | 3230.13 | 980 | 973 | 225.5 |
| C | 0 | 10 | 528563 | 2339.78 | 980 | 973 | 225.5 |
| C | 15 | 208 | 73148 | 320.09 | 980 | 973 | 225.5 |
| D | 13 | 249 | 768070 | 3298.63 | 983 | 957 | 232.6 |
| D | 1 | 52 | 729383 | 3132.27 | 983 | 957 | 232.6 |
| D | 14 | 52 | 310493 | 1331.02 | 983 | 957 | 232.6 |
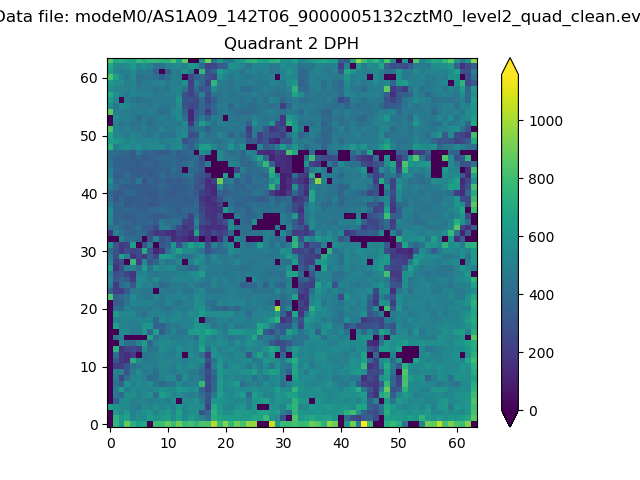
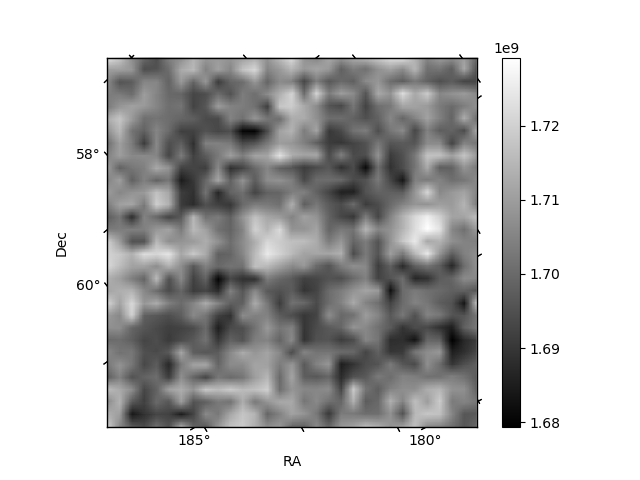
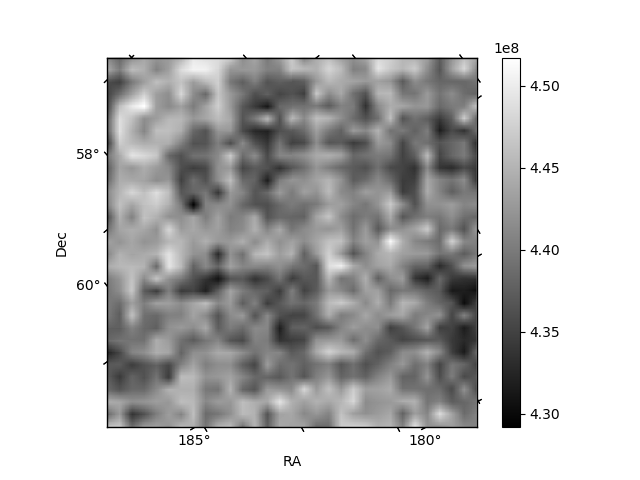
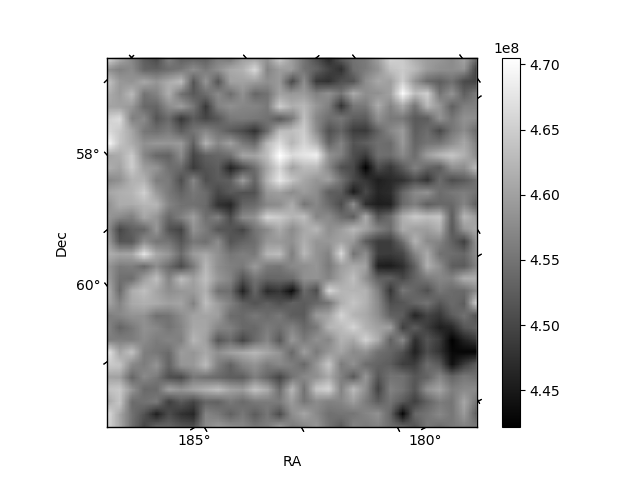
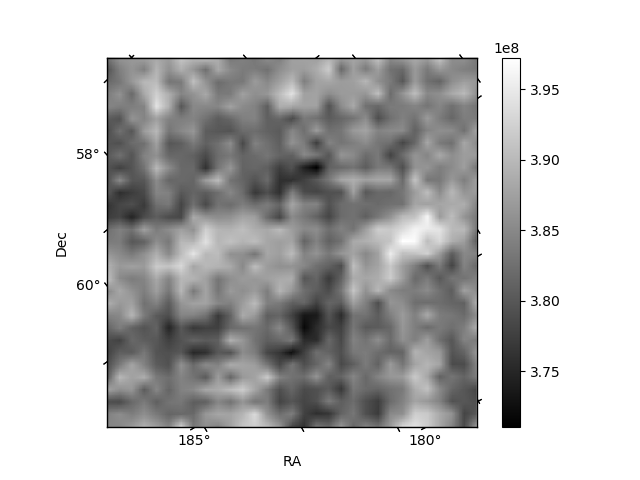
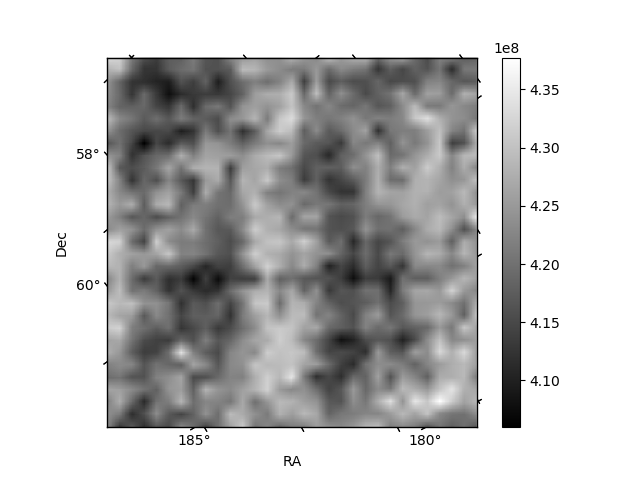
Histogram calculated using DETX and DETY for each event in the final _common_clean file
| Quadrant A | 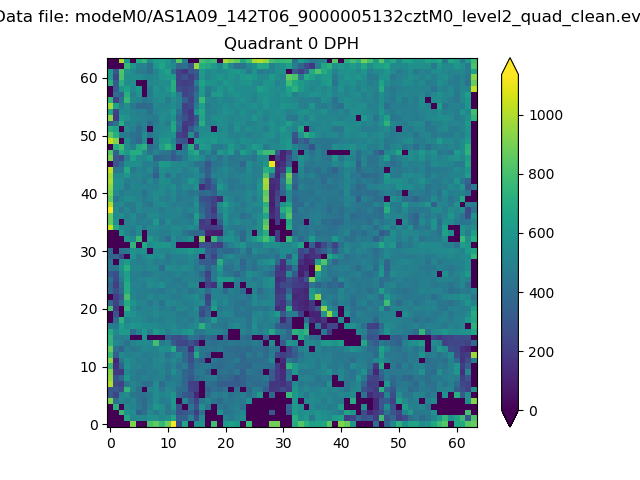 |
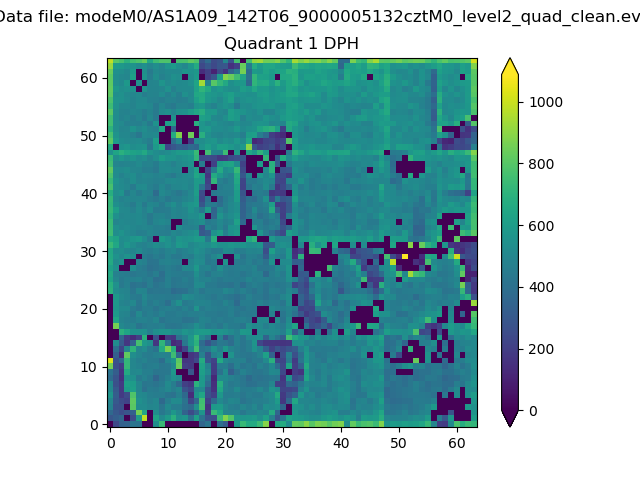 |
Quadrant B |
|---|---|---|---|
| Quadrant D | 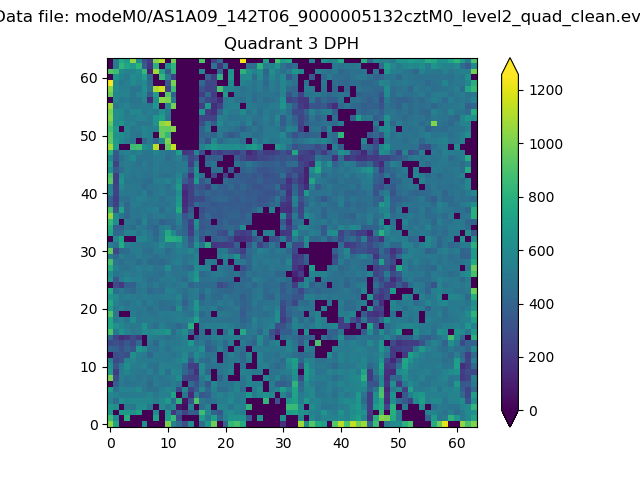 |
 |
Quadrant C |
| Plot type | Count rate plots | Images |
|---|---|---|
| Comparison with Poisson distribution Blue bars denote a histogram of data divided into 1 sec bins. Red curve is a Poisson curve with rate = median count rate of data. |
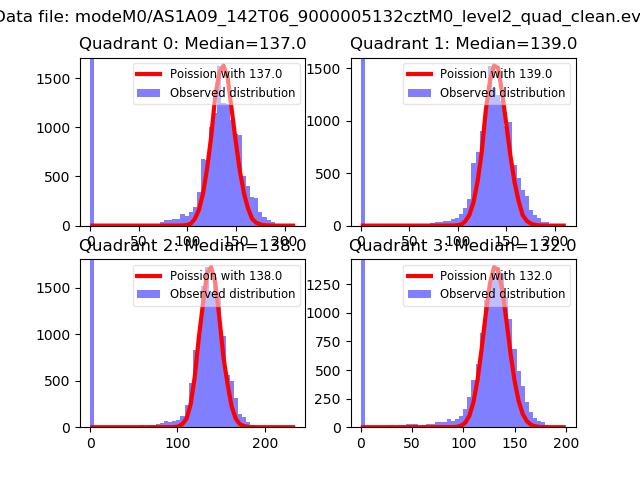 |
 |
| Quadrant-wise count rates Data is divided into 100 sec bins |
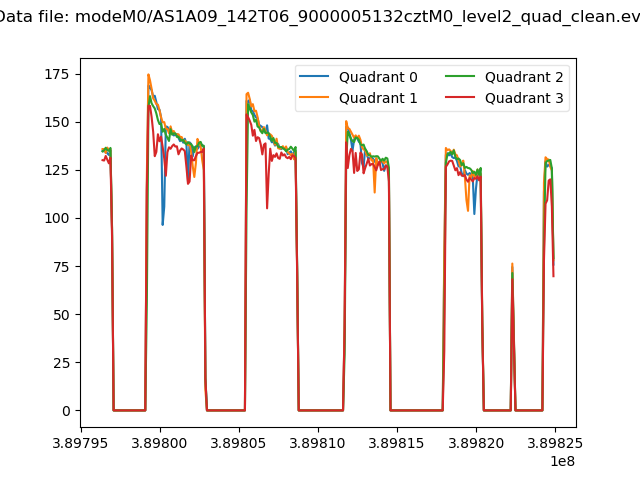 |
|
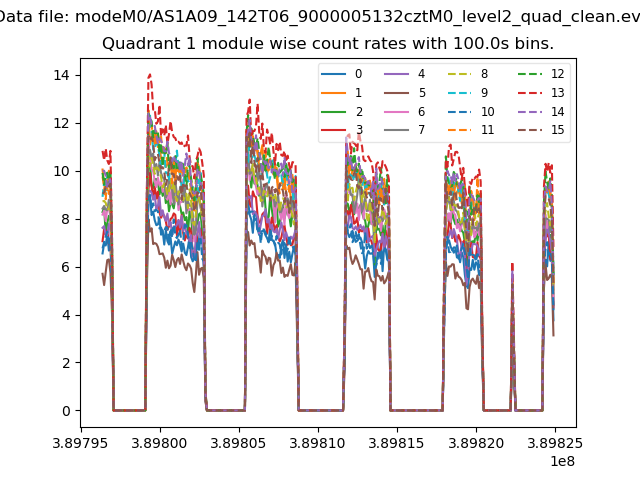
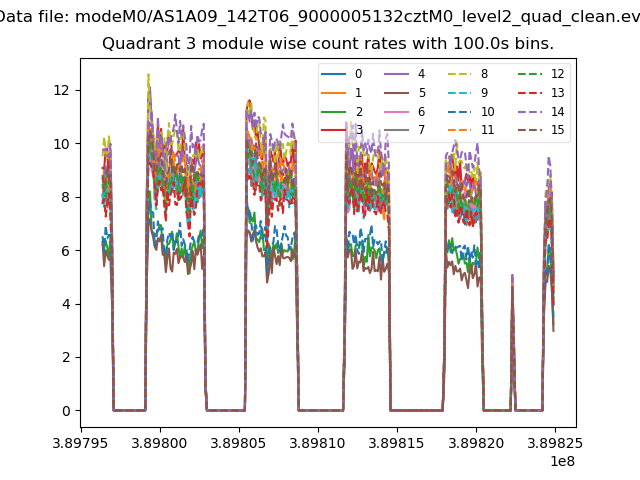
| Module-wise count rates for Quadrant A Data is divided into 100 sec bins |
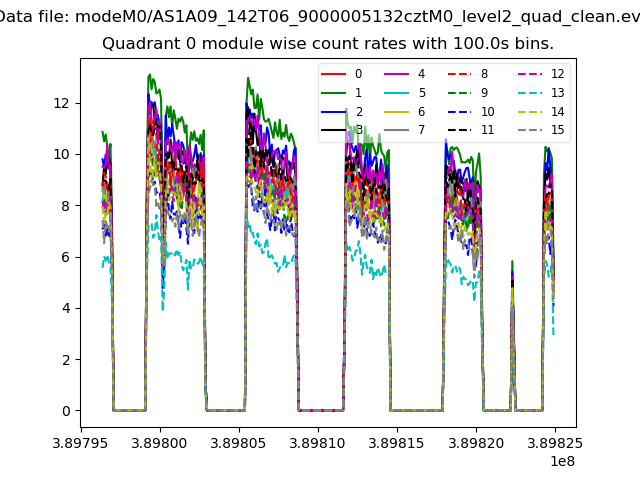 |
 |
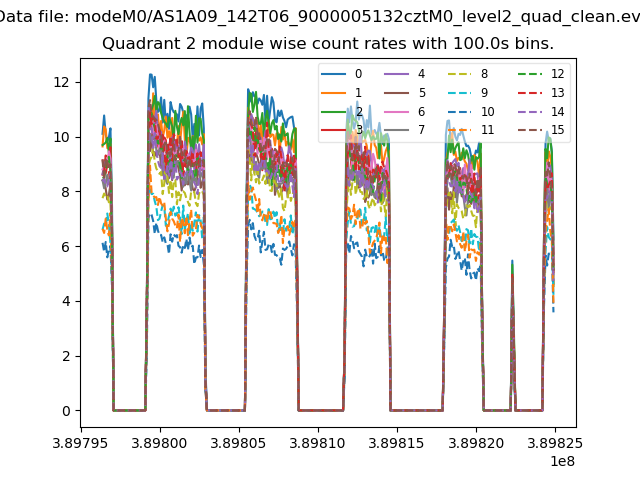
| Module-wise count rates for Quadrant B Data is divided into 100 sec bins |
 |
 |
| Module-wise count rates for Quadrant C Data is divided into 100 sec bins |
 |
 |
| Module-wise count rates for Quadrant D Data is divided into 100 sec bins |
 |
 |
| Parameter | Plot |
|---|---|
| CZT HV Monitor |  |
| D_VDD | 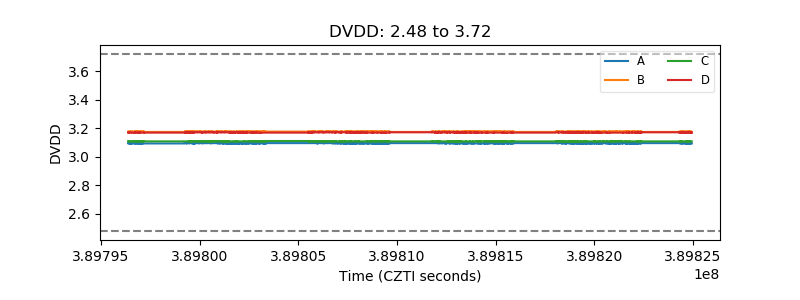 |
| Temperature 1 | 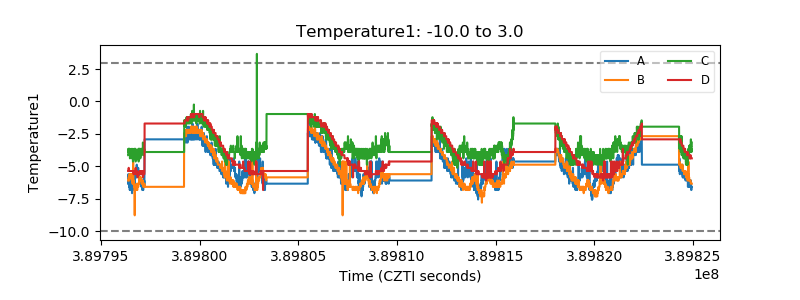 |
| Veto HV Monitor | 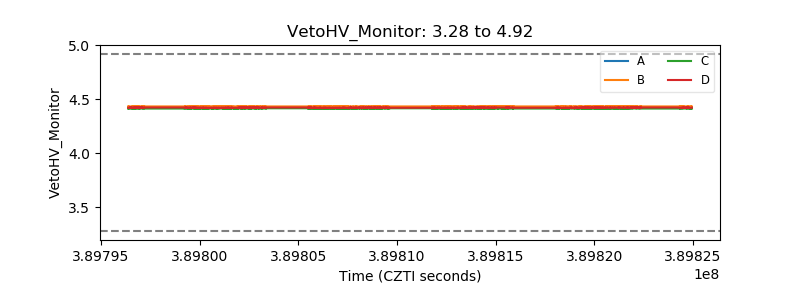 |
| Veto LLD | 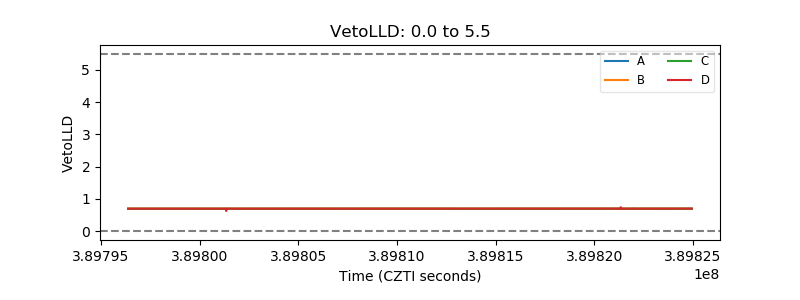 |
| Alpha Counter | 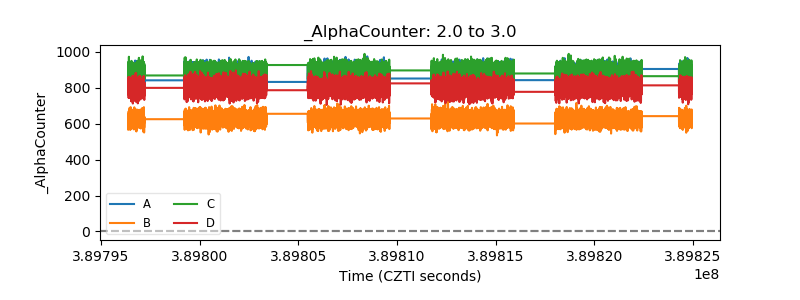 |
| _CPM_Rate | 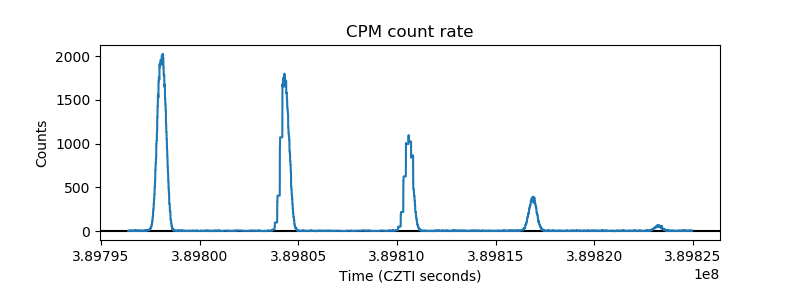 |
| CZT Counter | 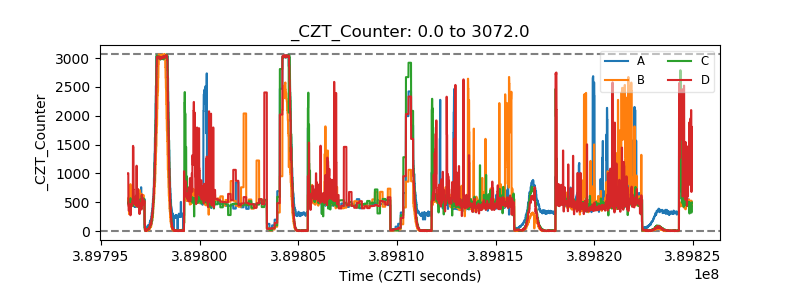 |
| +2.5 Volts monitor | 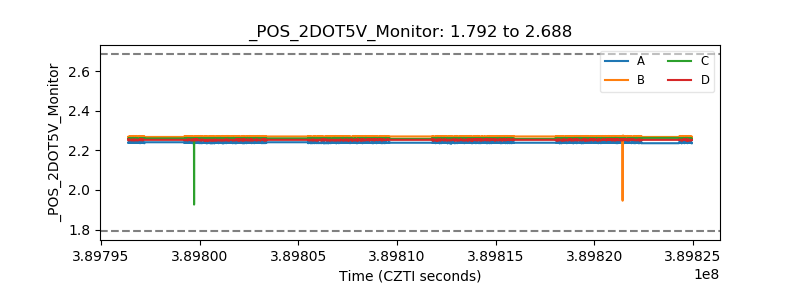 |
| +5 Volts monitor | 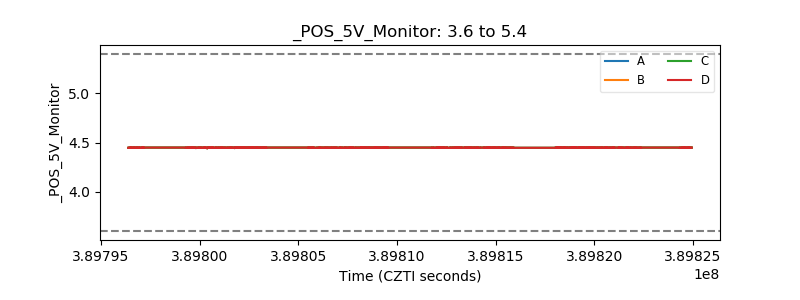 |
| _ROLL_ROT | 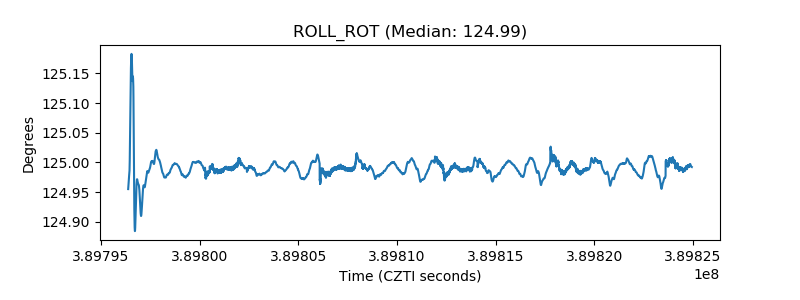 |
| _Roll_DEC | 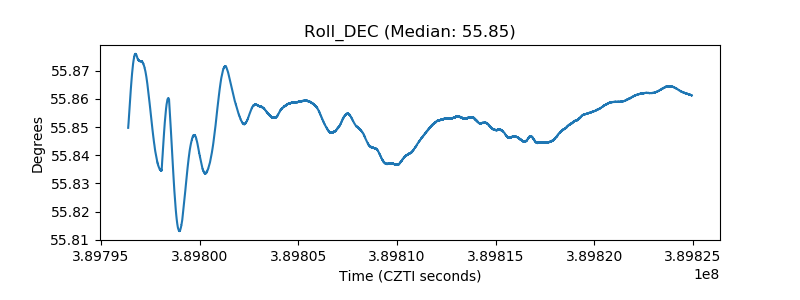 |
| _Roll_RA | 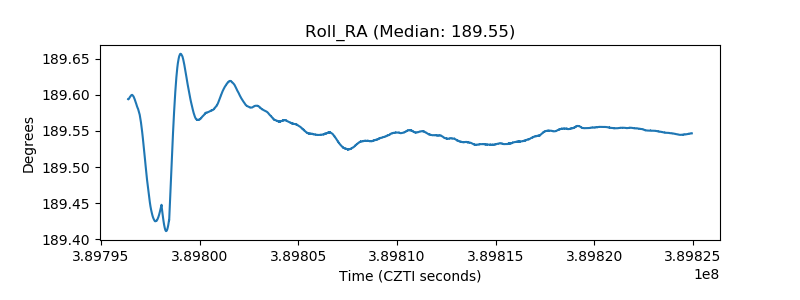 |
| Veto Counter | 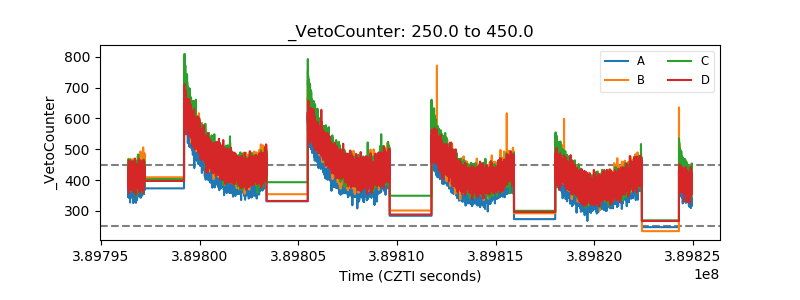 |