| Param | Original file | Final file |
|---|---|---|
| Filename | modeM0/AS1A09_029T07_9000005128_35748cztM0_level2.evt | modeM0/AS1A09_029T07_9000005128_35748cztM0_level2_quad_clean.evt |
| Size (bytes) | 1,143,256,320 | 213,586,560 |
| Size | 1.1 GB | 203.7 MB |
| Events in quadrant A | 7,558,637 | 1,368,547 |
| Events in quadrant B | 8,559,354 | 1,381,103 |
| Events in quadrant C | 8,519,955 | 1,349,118 |
| Events in quadrant D | 8,925,168 | 1,287,656 |
| Mode M9 | |||
|---|---|---|---|
| Quadrant | BADHDUFLAG | Total packets | Discarded packets |
| A | 0 | 46 | 0 |
| B | 0 | 46 | 0 |
| C | 0 | 46 | 0 |
| D | 0 | 47 | 0 |
| Mode M0 | |||
|---|---|---|---|
| Quadrant | BADHDUFLAG | Total packets | Discarded packets |
| A | 0 | 32377 | 5 |
| B | 0 | 35648 | 4 |
| C | 0 | 34828 | 4 |
| D | 0 | 36925 | 4 |
| Mode SS | |||
|---|---|---|---|
| Quadrant | BADHDUFLAG | Total packets | Discarded packets |
| A | 0 | 318 | 0 |
| B | 0 | 318 | 0 |
| C | 0 | 318 | 0 |
| D | 0 | 318 | 0 |
| Quadrant | Total seconds | Saturated seconds | Saturation percentage |
|---|---|---|---|
| A | 15699 | 14 | 0.089178% |
| B | 15699 | 220 | 1.401363% |
| C | 15699 | 226 | 1.439582% |
| D | 15699 | 249 | 1.586088% |
Noise dominated data is calculated using 1-second bins in cleaned event files. If a bin has >2000 counts, and if more than 50% of those come from <1% of pixels, then it is considered to be noise-dominated and hence unusable.
| Quadrant | # 1 sec bins | Bins with >0 counts | Bins with >2000 counts | High rate bins dominated by noise | Noise dominated (total time) | Noise dominated (detector-on time) | Marked lightcurve |
|---|---|---|---|---|---|---|---|
| A | 19880 | 15702 | 2 | 2 | 0.01% | 0.01% | 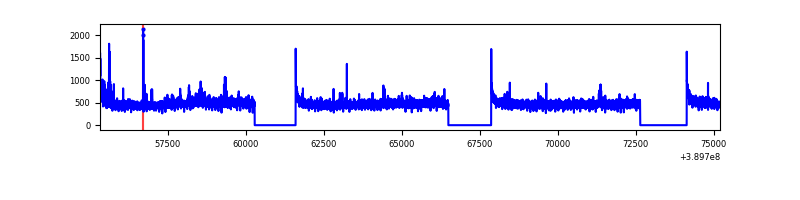 |
| B | 19880 | 15702 | 136 | 136 | 0.68% | 0.87% | 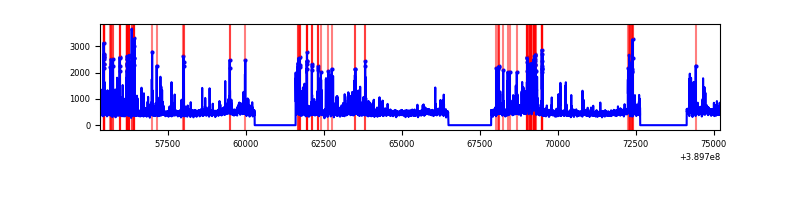 |
| C | 19880 | 15702 | 220 | 220 | 1.11% | 1.40% | 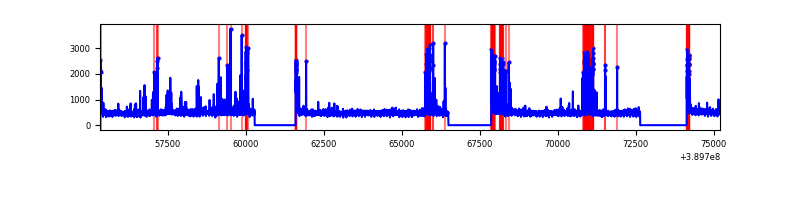 |
| D | 19880 | 15702 | 247 | 247 | 1.24% | 1.57% | 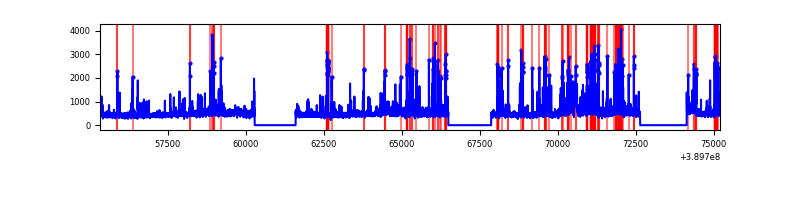 |
Top three noisy pixels from each quadrant. If the there are fewer than three noisy pixels in the level2.evt file, extra rows are filled as -1
| Pixel properties | Quadrant properties | ||||||
|---|---|---|---|---|---|---|---|
| Quadrant | DetID | PixID | Counts | Sigma | Mean | Median | Sigma |
| A | 10 | 83 | 381512 | 1049.54 | 1798 | 1759 | 361.8 |
| A | 15 | 169 | 94137 | 255.31 | 1798 | 1759 | 361.8 |
| A | 8 | 192 | 59086 | 158.44 | 1798 | 1759 | 361.8 |
| B | 5 | 172 | 1116679 | 3294.73 | 1775 | 1726 | 338.4 |
| B | 5 | 255 | 141456 | 412.91 | 1775 | 1726 | 338.4 |
| B | 0 | 189 | 106547 | 309.75 | 1775 | 1726 | 338.4 |
| C | 15 | 214 | 663070 | 1654.09 | 1725 | 1733 | 399.8 |
| C | 1 | 23 | 645278 | 1609.59 | 1725 | 1733 | 399.8 |
| C | 0 | 10 | 301725 | 750.32 | 1725 | 1733 | 399.8 |
| D | 14 | 52 | 649328 | 1538.08 | 1732 | 1683 | 421.1 |
| D | 13 | 249 | 484615 | 1146.9 | 1732 | 1683 | 421.1 |
| D | 8 | 195 | 252734 | 596.22 | 1732 | 1683 | 421.1 |
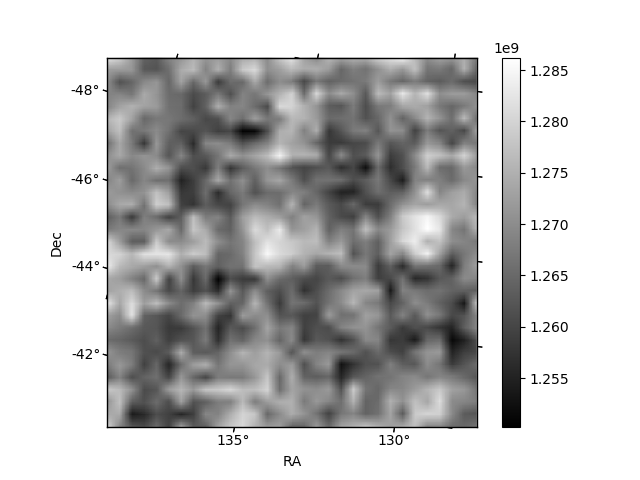
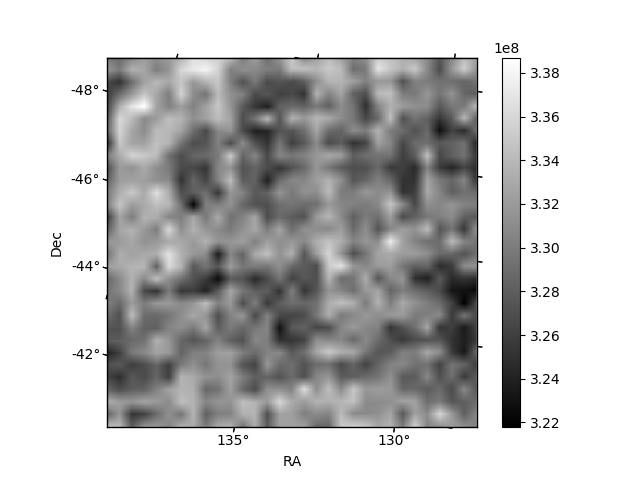
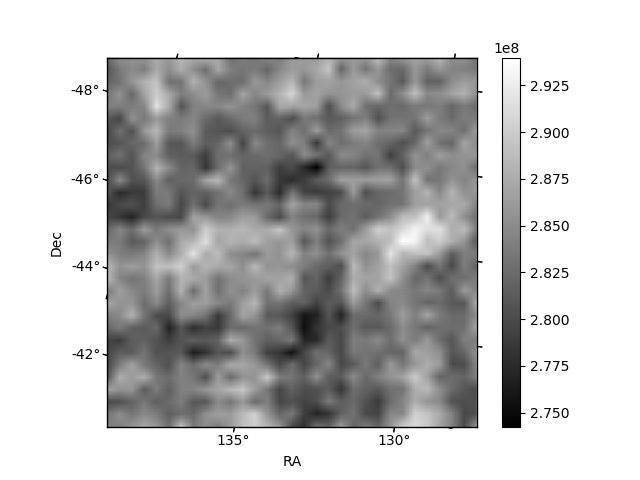
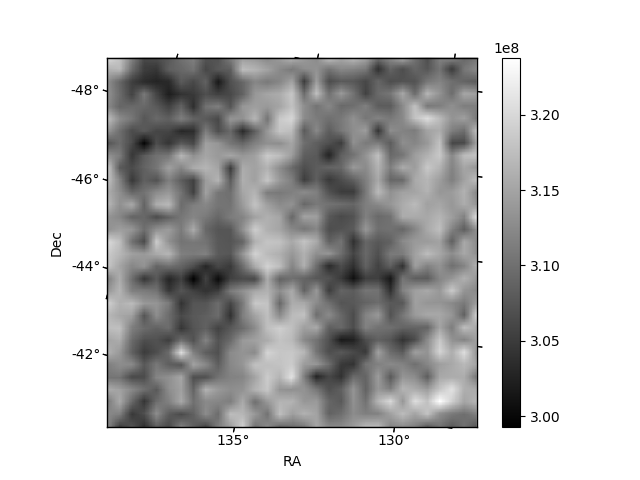
Histogram calculated using DETX and DETY for each event in the final _common_clean file
| Quadrant A | 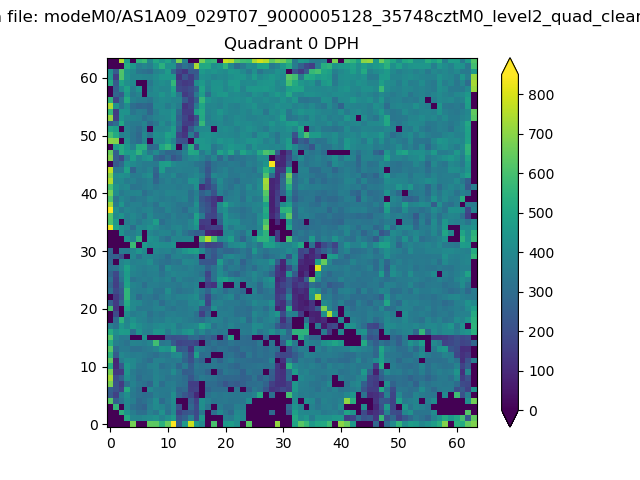 |
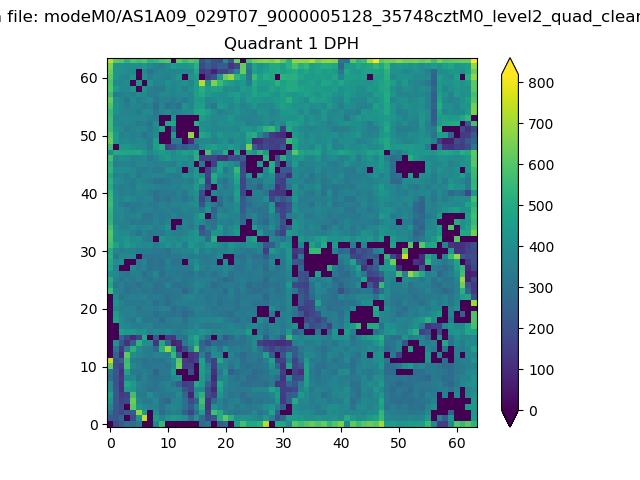 |
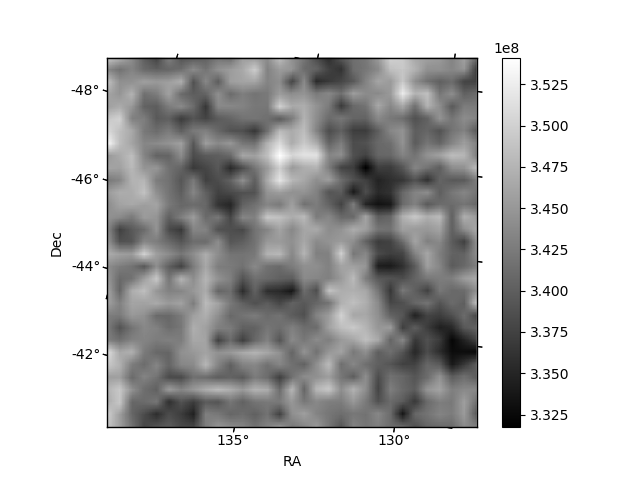
Quadrant B |
|---|---|---|---|
| Quadrant D | 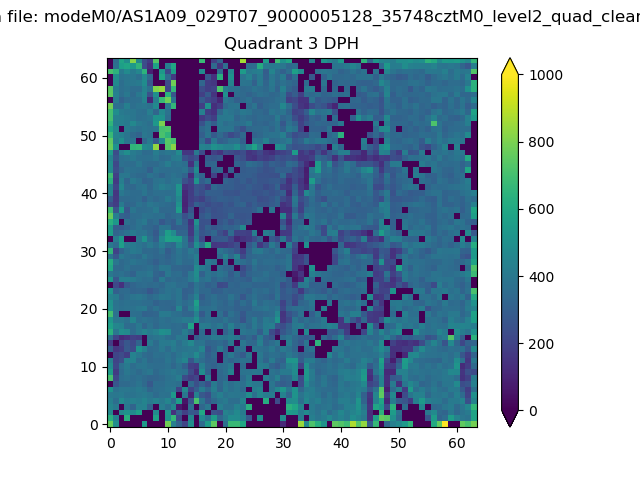 |
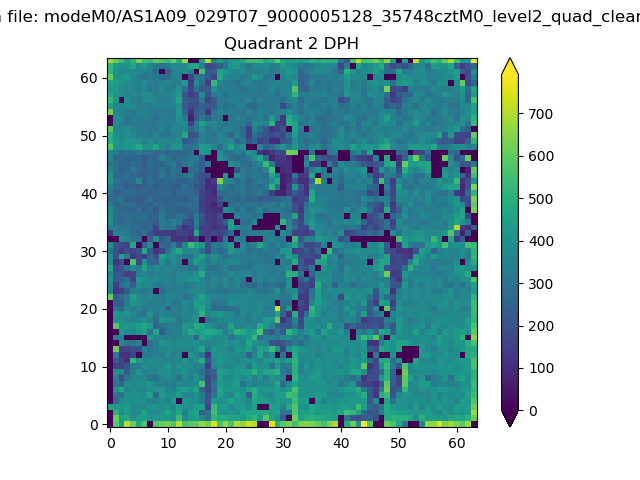 |
Quadrant C |
| Plot type | Count rate plots | Images |
|---|---|---|
| Comparison with Poisson distribution Blue bars denote a histogram of data divided into 1 sec bins. Red curve is a Poisson curve with rate = median count rate of data. |
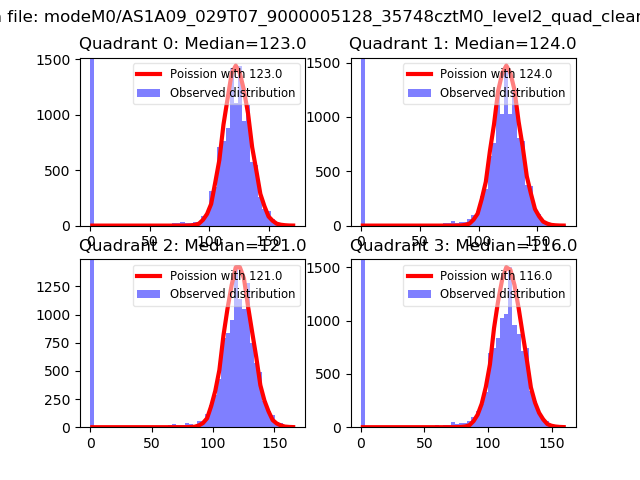 |
 |
| Quadrant-wise count rates Data is divided into 100 sec bins |
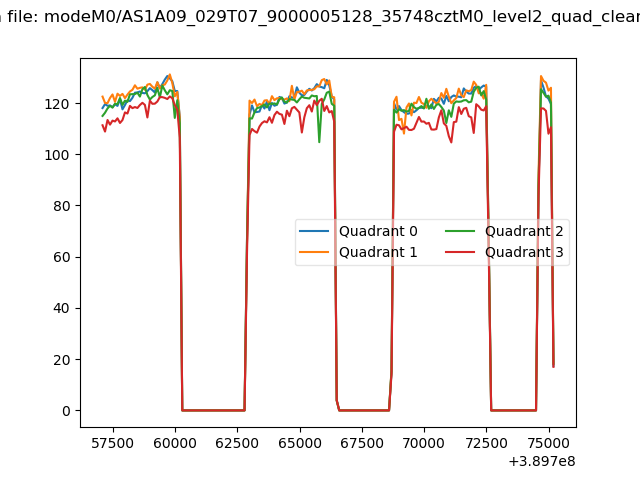 |
|
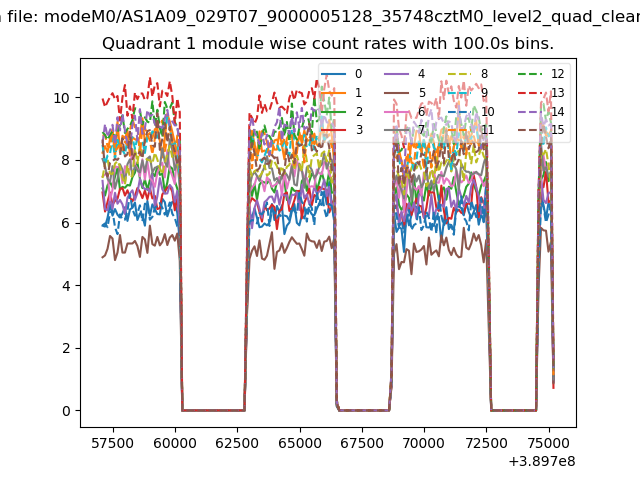
| Module-wise count rates for Quadrant A Data is divided into 100 sec bins |
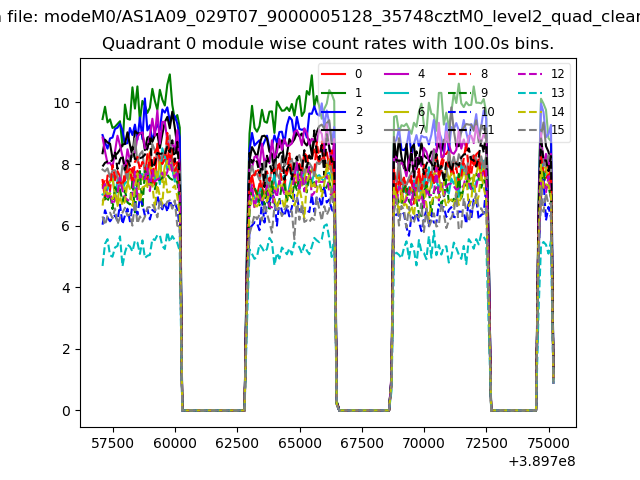 |
 |
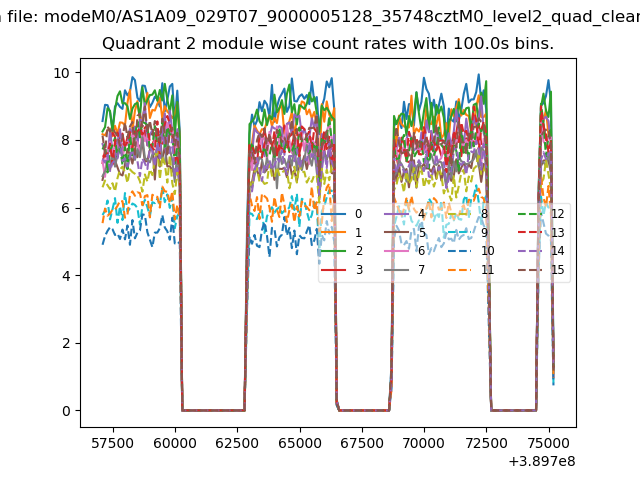
| Module-wise count rates for Quadrant B Data is divided into 100 sec bins |
 |
 |
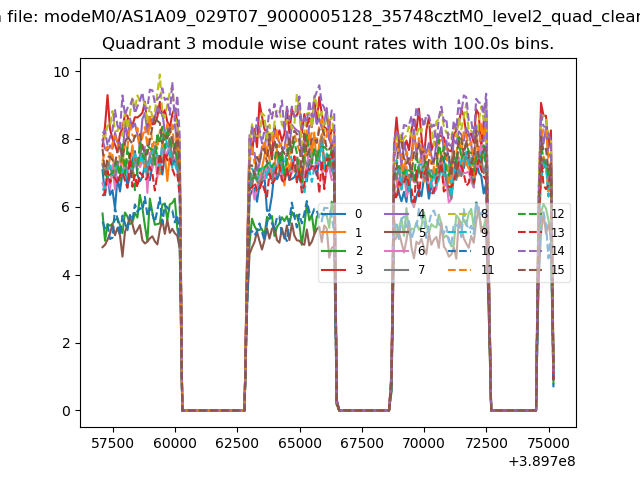
| Module-wise count rates for Quadrant C Data is divided into 100 sec bins |
 |
 |
| Module-wise count rates for Quadrant D Data is divided into 100 sec bins |
 |
 |
| Parameter | Plot |
|---|---|
| CZT HV Monitor | 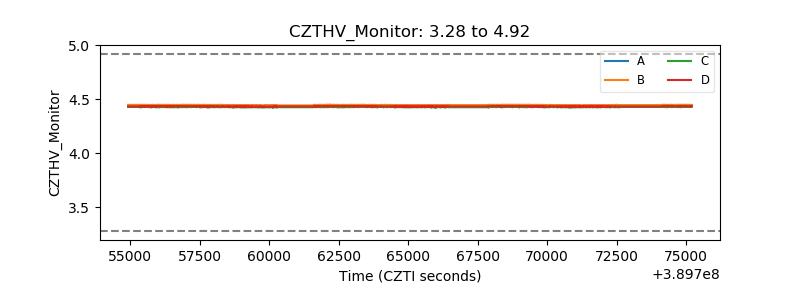 |
| D_VDD | 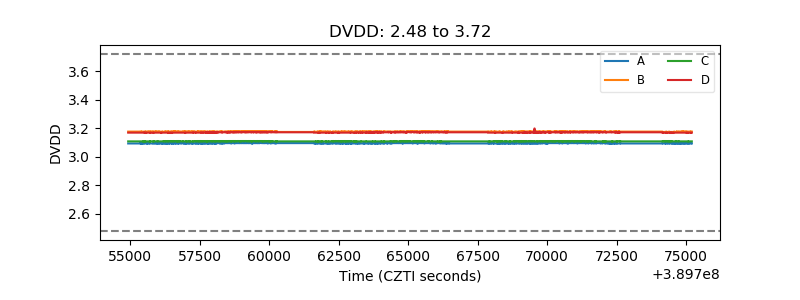 |
| Temperature 1 | 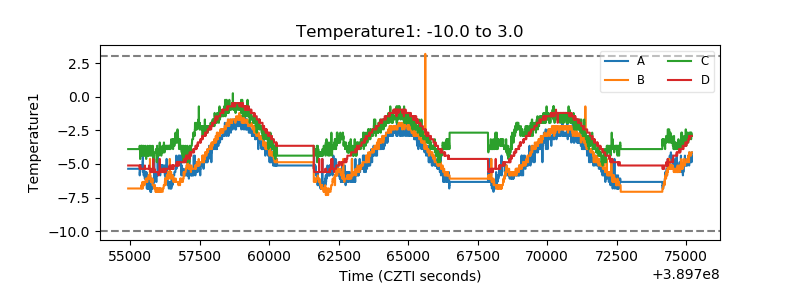 |
| Veto HV Monitor | 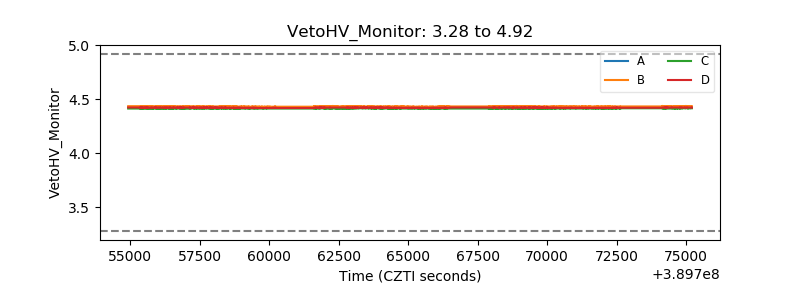 |
| Veto LLD | 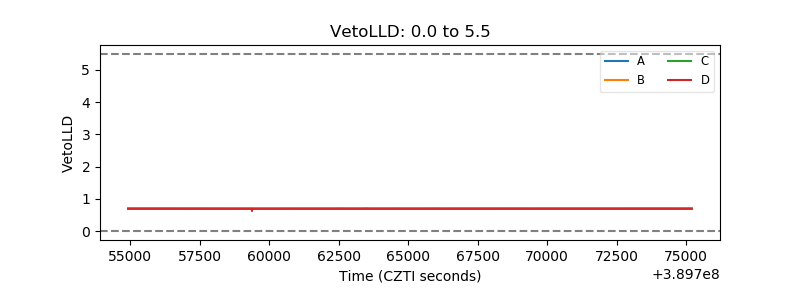 |
| Alpha Counter | 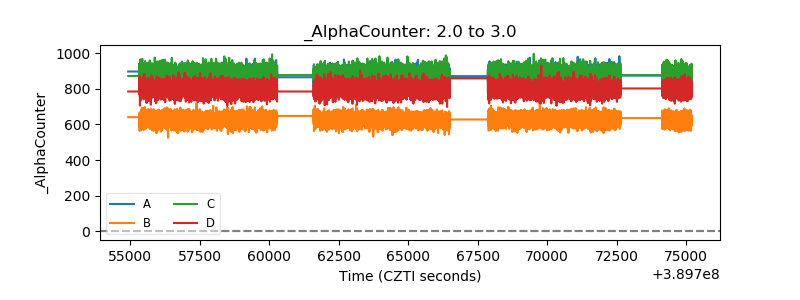 |
| _CPM_Rate | 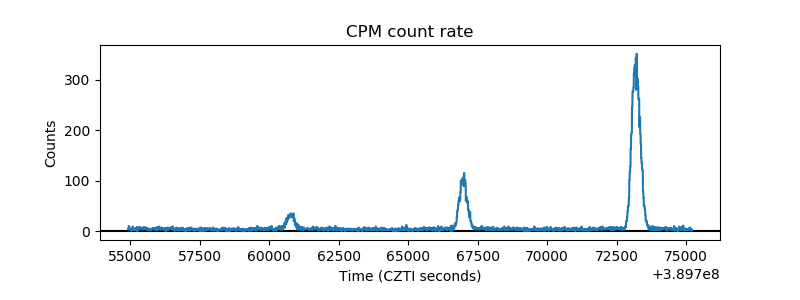 |
| CZT Counter | 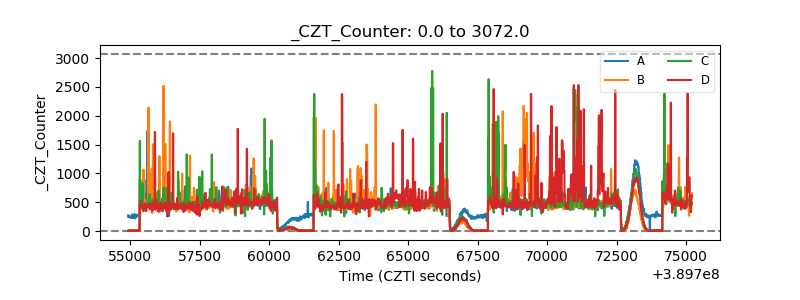 |
| +2.5 Volts monitor | 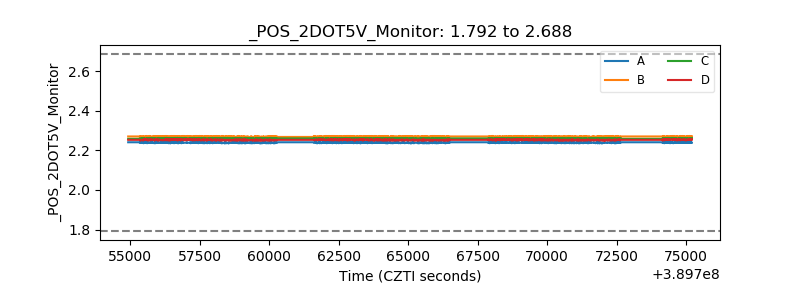 |
| +5 Volts monitor | 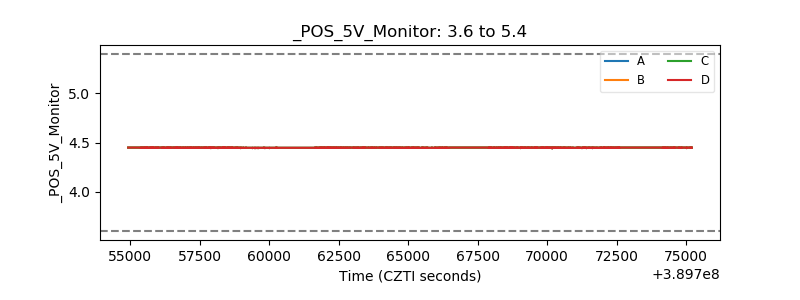 |
| _ROLL_ROT | 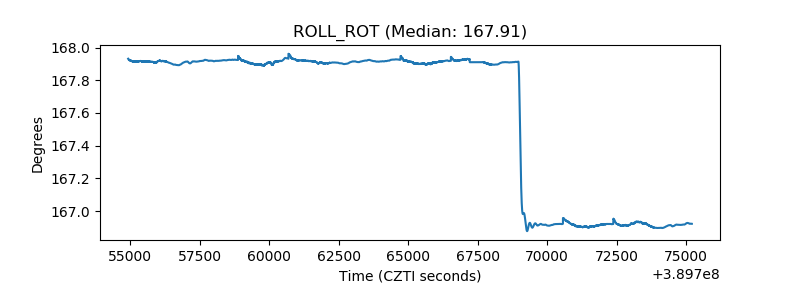 |
| _Roll_DEC | 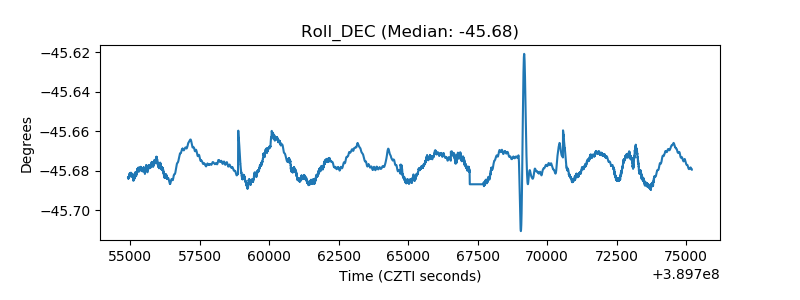 |
| _Roll_RA | 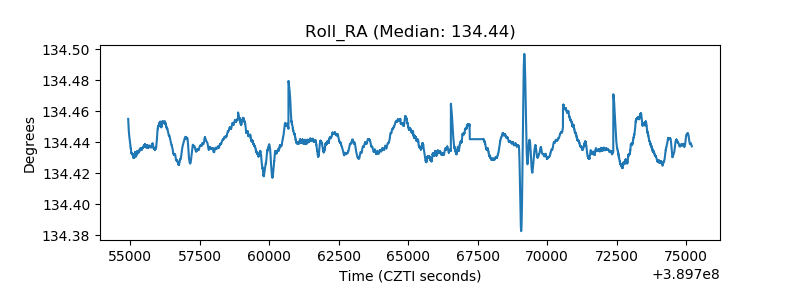 |
| Veto Counter | 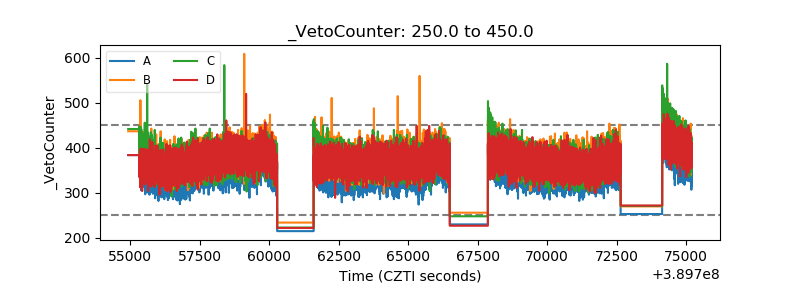 |