| Param | Original file | Final file |
|---|---|---|
| Filename | modeM0/AS1A09_029T07_9000005128_35744cztM0_level2.evt | modeM0/AS1A09_029T07_9000005128_35744cztM0_level2_quad_clean.evt |
| Size (bytes) | 431,340,480 | 65,208,960 |
| Size | 411.4 MB | 62.2 MB |
| Events in quadrant A | 2,947,200 | 397,975 |
| Events in quadrant B | 3,501,452 | 401,635 |
| Events in quadrant C | 2,987,313 | 399,153 |
| Events in quadrant D | 3,237,549 | 374,567 |
| Mode M9 | |||
|---|---|---|---|
| Quadrant | BADHDUFLAG | Total packets | Discarded packets |
| A | 0 | 28 | 0 |
| B | 0 | 28 | 0 |
| C | 0 | 28 | 0 |
| D | 0 | 29 | 0 |
| Mode M0 | |||
|---|---|---|---|
| Quadrant | BADHDUFLAG | Total packets | Discarded packets |
| A | 0 | 12463 | 3 |
| B | 0 | 14198 | 2 |
| C | 0 | 12478 | 2 |
| D | 0 | 13720 | 2 |
| Mode SS | |||
|---|---|---|---|
| Quadrant | BADHDUFLAG | Total packets | Discarded packets |
| A | 0 | 116 | 0 |
| B | 0 | 116 | 0 |
| C | 0 | 116 | 0 |
| D | 0 | 116 | 0 |
| Quadrant | Total seconds | Saturated seconds | Saturation percentage |
|---|---|---|---|
| A | 5735 | 119 | 2.074978% |
| B | 5735 | 209 | 3.644289% |
| C | 5735 | 42 | 0.732345% |
| D | 5735 | 182 | 3.173496% |
Noise dominated data is calculated using 1-second bins in cleaned event files. If a bin has >2000 counts, and if more than 50% of those come from <1% of pixels, then it is considered to be noise-dominated and hence unusable.
| Quadrant | # 1 sec bins | Bins with >0 counts | Bins with >2000 counts | High rate bins dominated by noise | Noise dominated (total time) | Noise dominated (detector-on time) | Marked lightcurve |
|---|---|---|---|---|---|---|---|
| A | 7136 | 5736 | 98 | 98 | 1.37% | 1.71% | 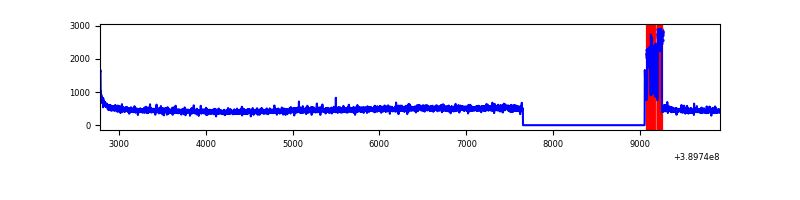 |
| B | 7136 | 5736 | 163 | 163 | 2.28% | 2.84% | 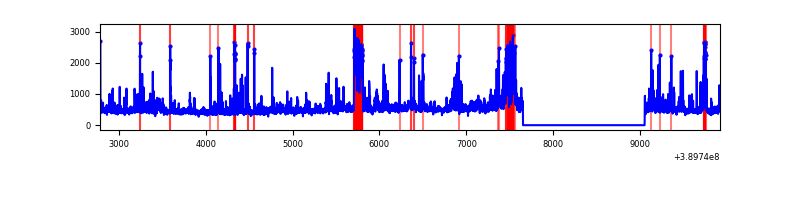 |
| C | 7136 | 5736 | 38 | 38 | 0.53% | 0.66% | 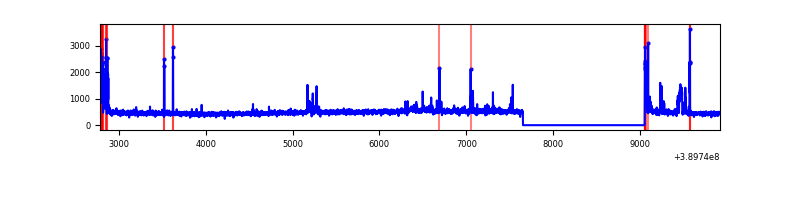 |
| D | 7136 | 5736 | 161 | 161 | 2.26% | 2.81% | 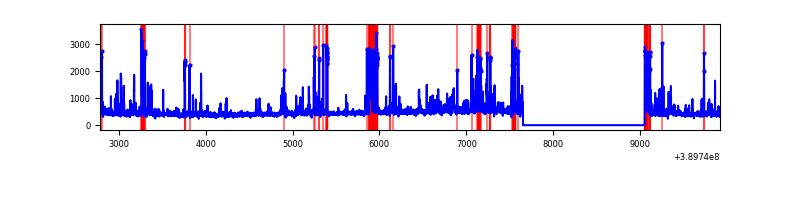 |
Top three noisy pixels from each quadrant. If the there are fewer than three noisy pixels in the level2.evt file, extra rows are filled as -1
| Pixel properties | Quadrant properties | ||||||
|---|---|---|---|---|---|---|---|
| Quadrant | DetID | PixID | Counts | Sigma | Mean | Median | Sigma |
| A | 15 | 169 | 288098 | 2204.61 | 641 | 629 | 130.4 |
| A | 10 | 83 | 151802 | 1159.35 | 641 | 629 | 130.4 |
| A | 13 | 6 | 12353 | 89.91 | 641 | 629 | 130.4 |
| B | 5 | 172 | 575656 | 4632.12 | 635 | 616 | 124.1 |
| B | 0 | 189 | 155279 | 1245.86 | 635 | 616 | 124.1 |
| B | 5 | 31 | 133642 | 1071.56 | 635 | 616 | 124.1 |
| C | 15 | 214 | 242340 | 1668.7 | 624 | 629 | 144.8 |
| C | 0 | 10 | 142879 | 982.05 | 624 | 629 | 144.8 |
| C | 15 | 208 | 103041 | 707.02 | 624 | 629 | 144.8 |
| D | 13 | 249 | 578402 | 3815.34 | 616 | 597 | 151.4 |
| D | 2 | 153 | 40049 | 260.51 | 616 | 597 | 151.4 |
| D | 12 | 17 | 35823 | 232.6 | 616 | 597 | 151.4 |
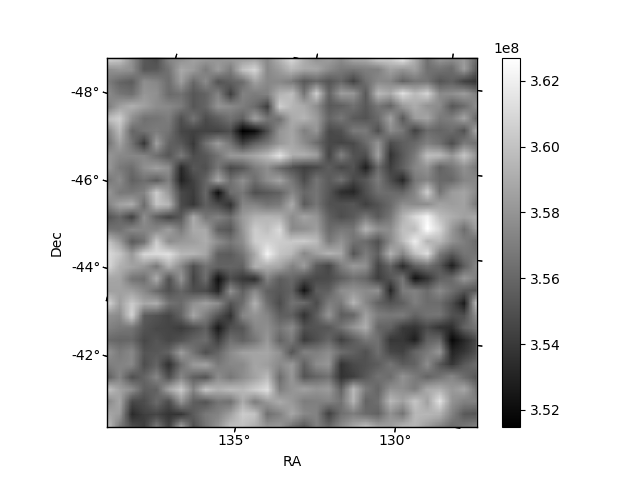
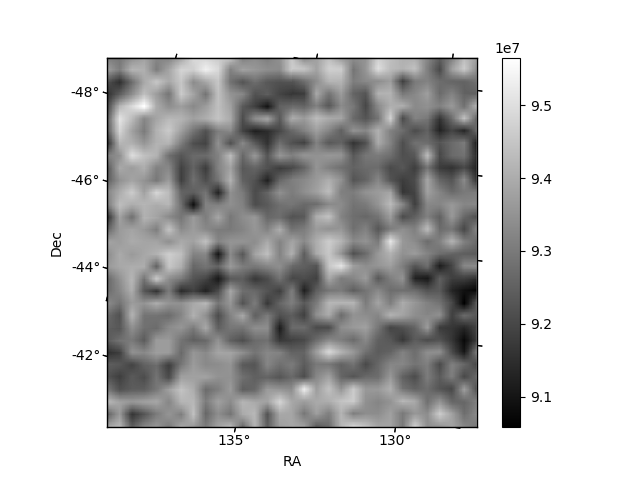
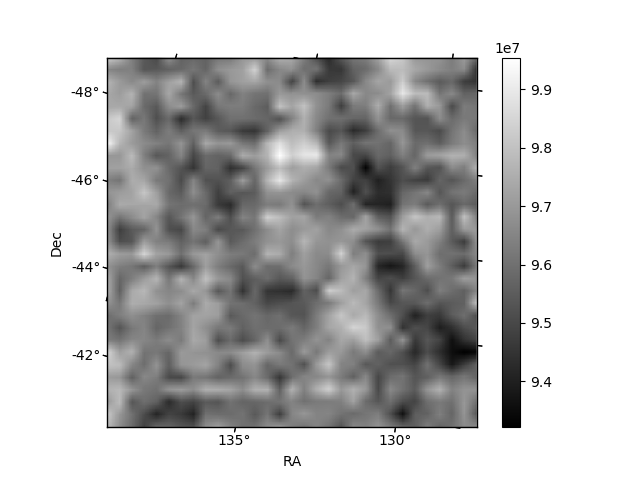
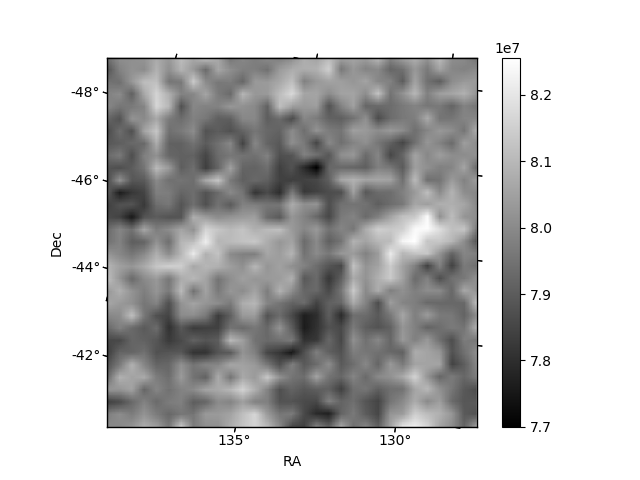
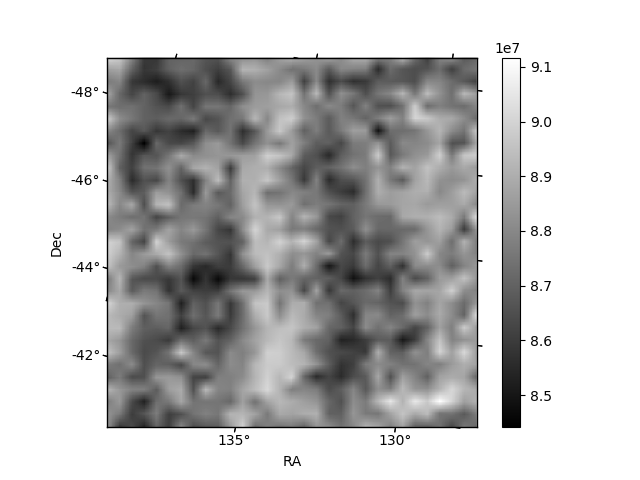
Histogram calculated using DETX and DETY for each event in the final _common_clean file
| Quadrant A | 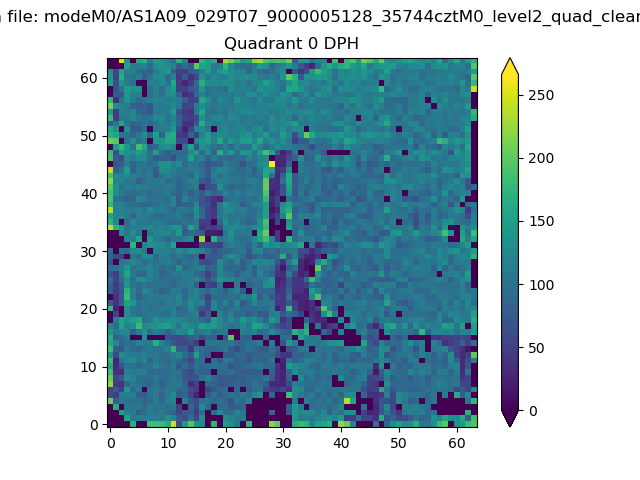 |
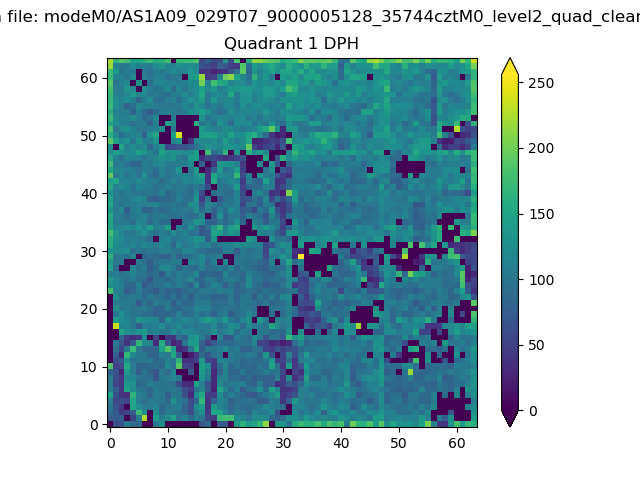 |
Quadrant B |
|---|---|---|---|
| Quadrant D | 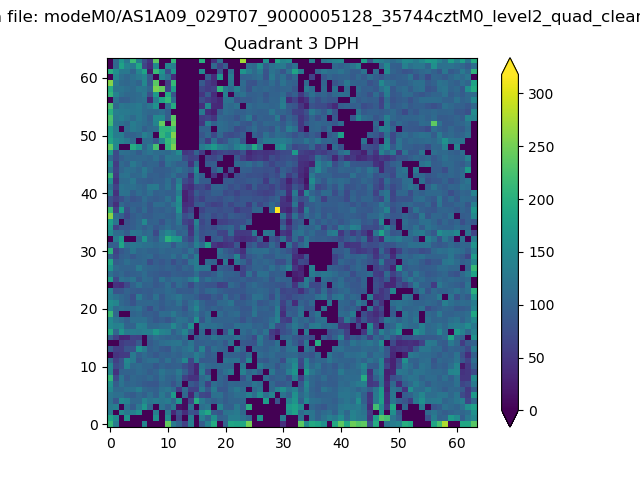 |
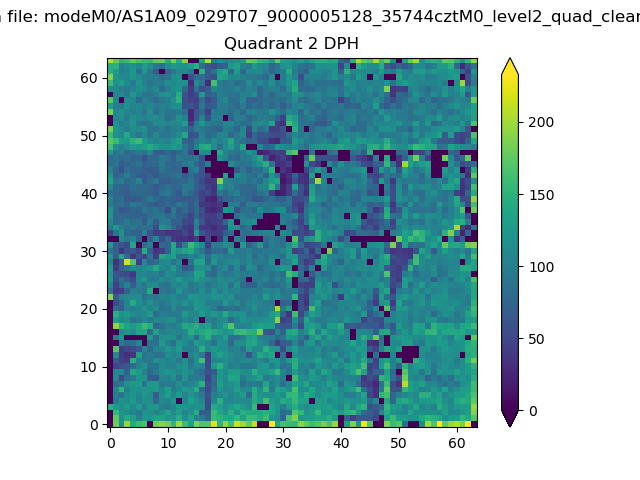 |
Quadrant C |
| Plot type | Count rate plots | Images |
|---|---|---|
| Comparison with Poisson distribution Blue bars denote a histogram of data divided into 1 sec bins. Red curve is a Poisson curve with rate = median count rate of data. |
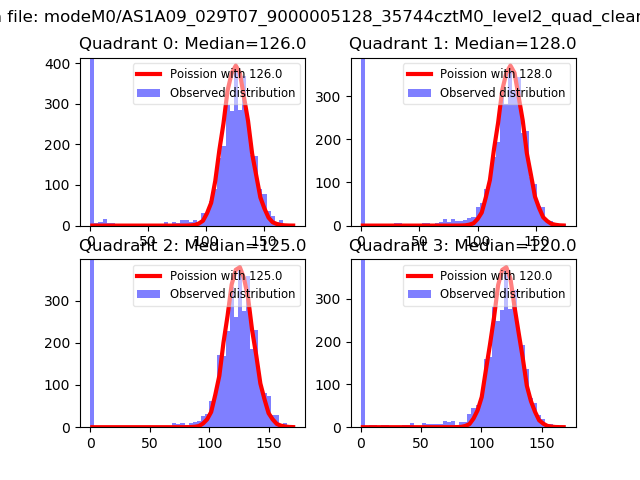 |
 |
| Quadrant-wise count rates Data is divided into 100 sec bins |
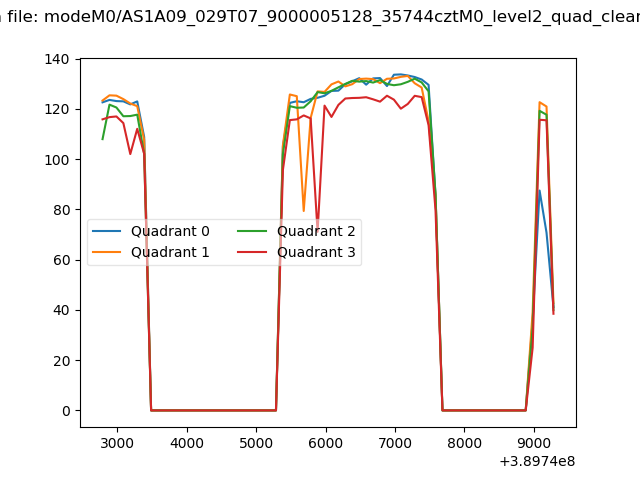 |
|
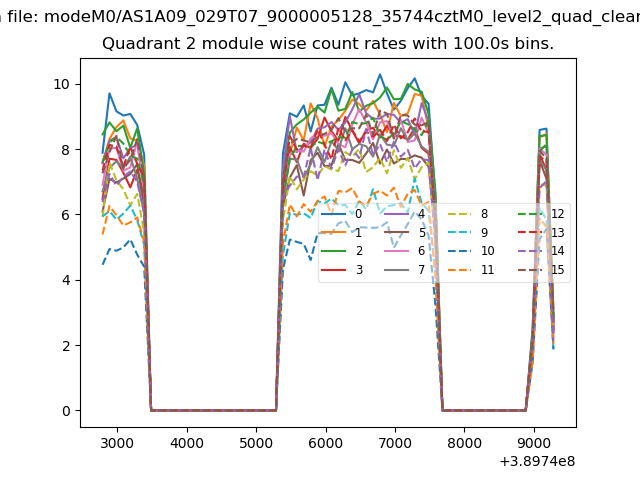
| Module-wise count rates for Quadrant A Data is divided into 100 sec bins |
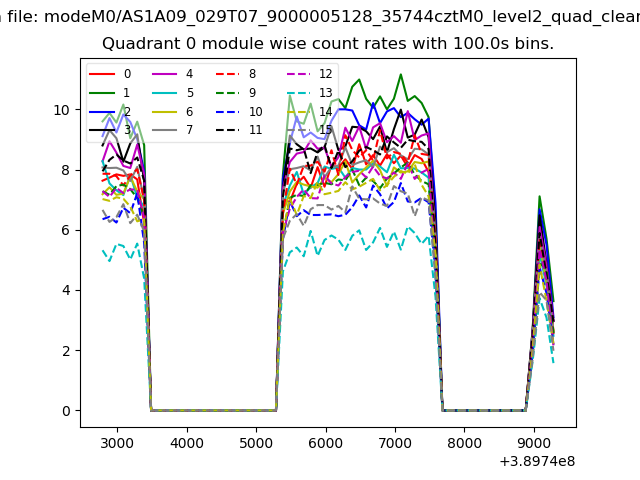 |
 |
| Module-wise count rates for Quadrant B Data is divided into 100 sec bins |
 |
 |
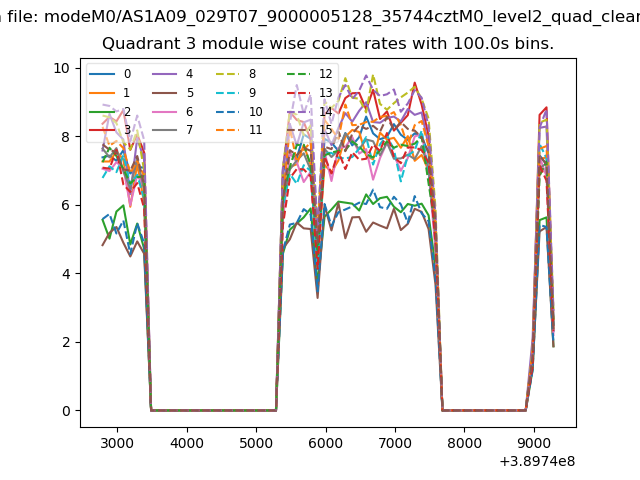
| Module-wise count rates for Quadrant C Data is divided into 100 sec bins |
 |
 |
| Module-wise count rates for Quadrant D Data is divided into 100 sec bins |
 |
 |
| Parameter | Plot |
|---|---|
| CZT HV Monitor | 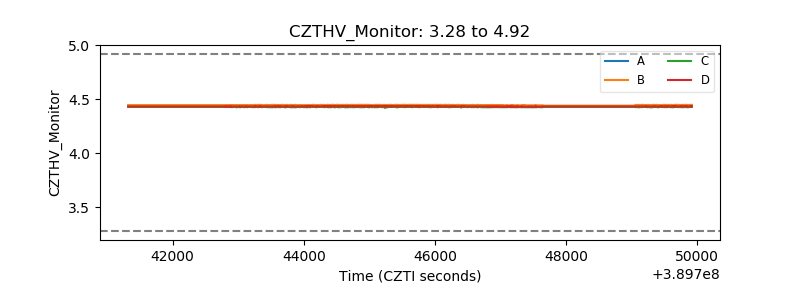 |
| D_VDD | 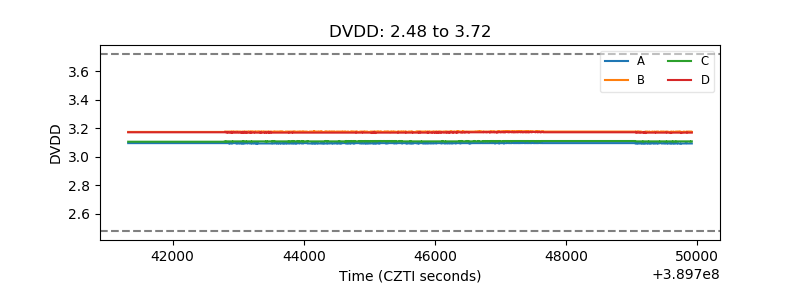 |
| Temperature 1 | 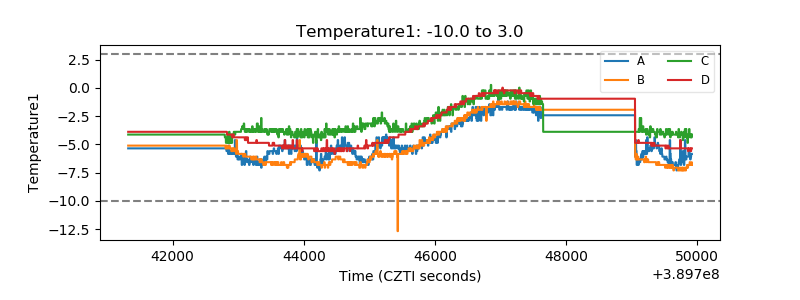 |
| Veto HV Monitor | 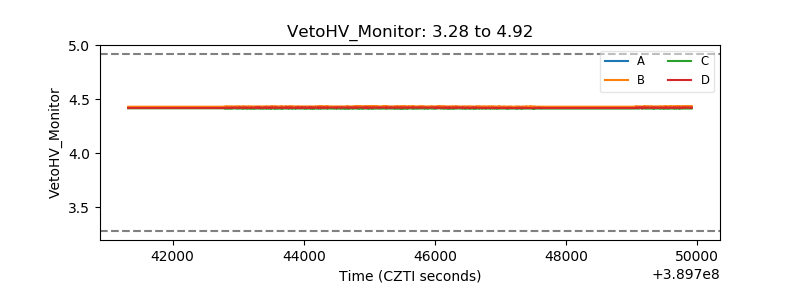 |
| Veto LLD | 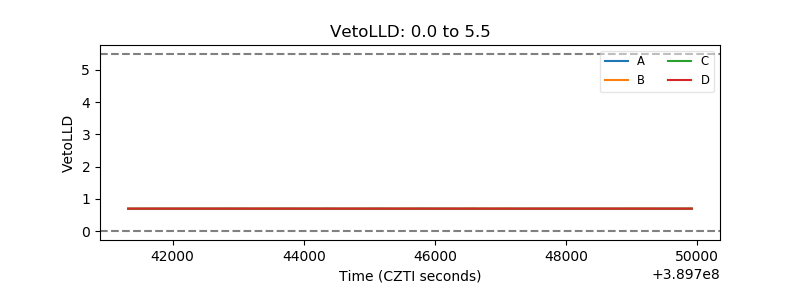 |
| Alpha Counter | 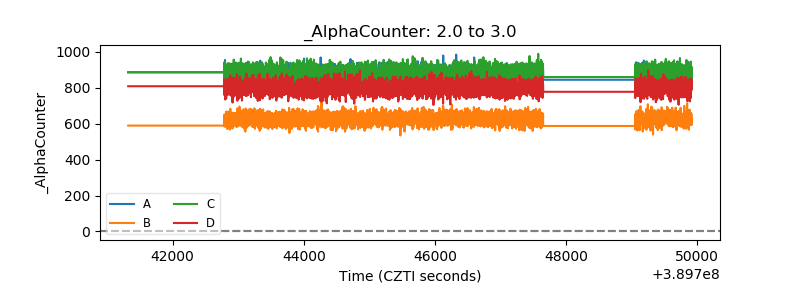 |
| _CPM_Rate | 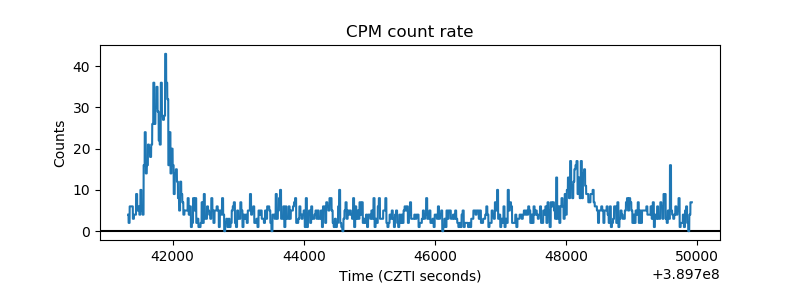 |
| CZT Counter | 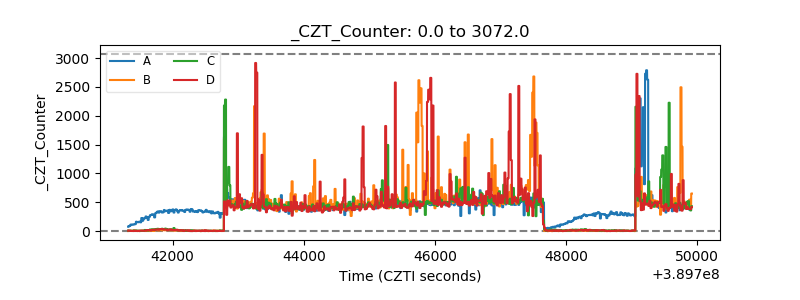 |
| +2.5 Volts monitor | 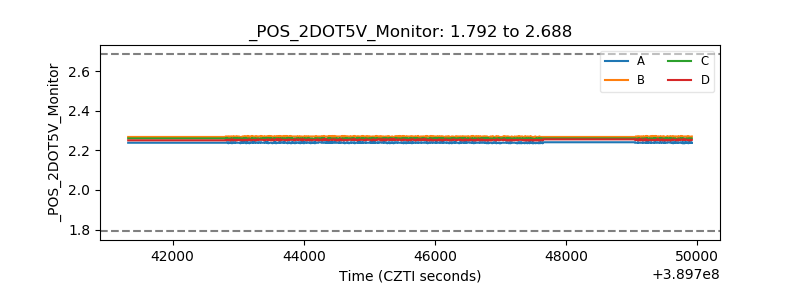 |
| +5 Volts monitor | 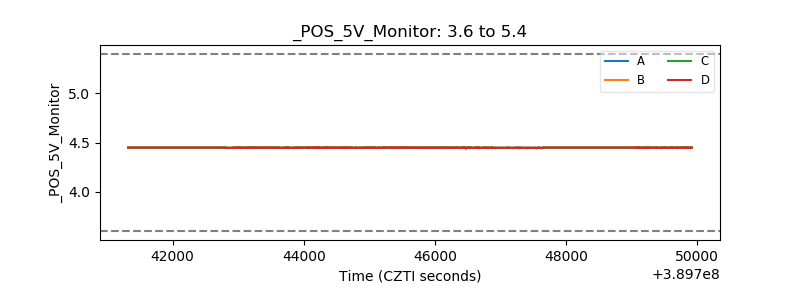 |
| _ROLL_ROT | 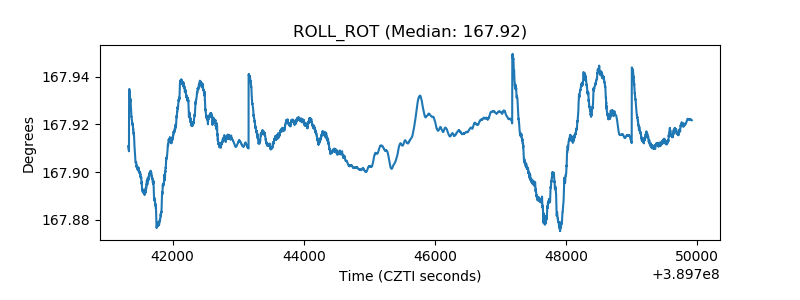 |
| _Roll_DEC | 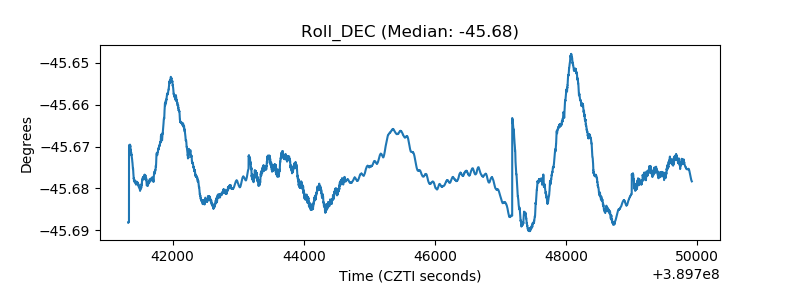 |
| _Roll_RA | 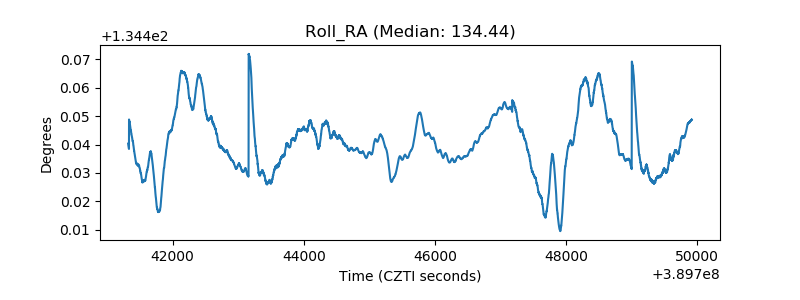 |
| Veto Counter | 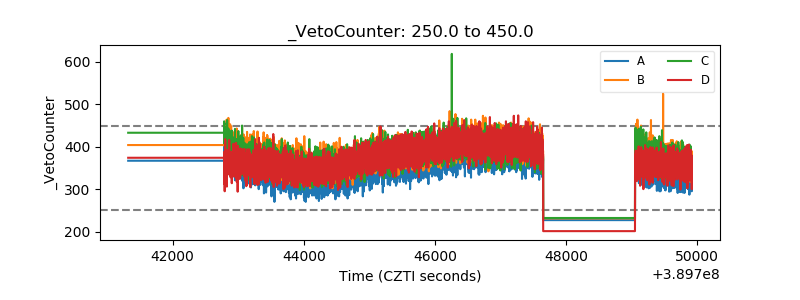 |