| Param | Original file | Final file |
|---|---|---|
| Filename | modeM0/AS1A09_029T07_9000005128_35743cztM0_level2.evt | modeM0/AS1A09_029T07_9000005128_35743cztM0_level2_quad_clean.evt |
| Size (bytes) | 376,704,000 | 67,282,560 |
| Size | 359.3 MB | 64.2 MB |
| Events in quadrant A | 2,514,347 | 425,047 |
| Events in quadrant B | 2,889,609 | 428,212 |
| Events in quadrant C | 2,822,019 | 411,327 |
| Events in quadrant D | 2,818,795 | 398,408 |
| Mode M9 | |||
|---|---|---|---|
| Quadrant | BADHDUFLAG | Total packets | Discarded packets |
| A | 0 | 24 | 0 |
| B | 0 | 24 | 0 |
| C | 0 | 24 | 0 |
| D | 0 | 25 | 0 |
| Mode M0 | |||
|---|---|---|---|
| Quadrant | BADHDUFLAG | Total packets | Discarded packets |
| A | 0 | 10946 | 3 |
| B | 0 | 12073 | 2 |
| C | 0 | 11662 | 2 |
| D | 0 | 12142 | 2 |
| Mode SS | |||
|---|---|---|---|
| Quadrant | BADHDUFLAG | Total packets | Discarded packets |
| A | 0 | 110 | 0 |
| B | 0 | 110 | 0 |
| C | 0 | 110 | 0 |
| D | 0 | 110 | 0 |
| Quadrant | Total seconds | Saturated seconds | Saturation percentage |
|---|---|---|---|
| A | 5339 | 4 | 0.074920% |
| B | 5339 | 50 | 0.936505% |
| C | 5339 | 90 | 1.685709% |
| D | 5339 | 56 | 1.048886% |
Noise dominated data is calculated using 1-second bins in cleaned event files. If a bin has >2000 counts, and if more than 50% of those come from <1% of pixels, then it is considered to be noise-dominated and hence unusable.
| Quadrant | # 1 sec bins | Bins with >0 counts | Bins with >2000 counts | High rate bins dominated by noise | Noise dominated (total time) | Noise dominated (detector-on time) | Marked lightcurve |
|---|---|---|---|---|---|---|---|
| A | 7041 | 5340 | 0 | 0 | 0.00% | 0.00% | 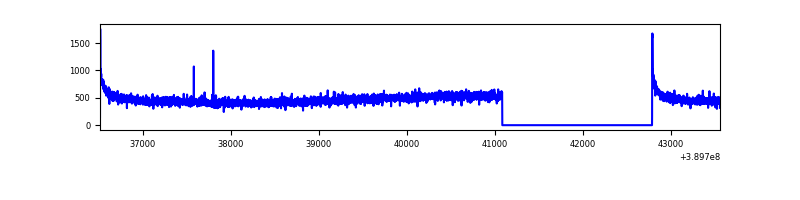 |
| B | 7041 | 5340 | 39 | 39 | 0.55% | 0.73% | 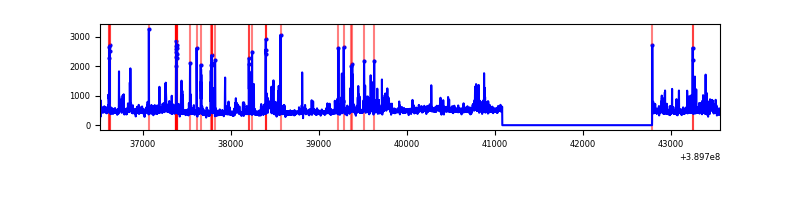 |
| C | 7041 | 5340 | 89 | 89 | 1.26% | 1.67% | 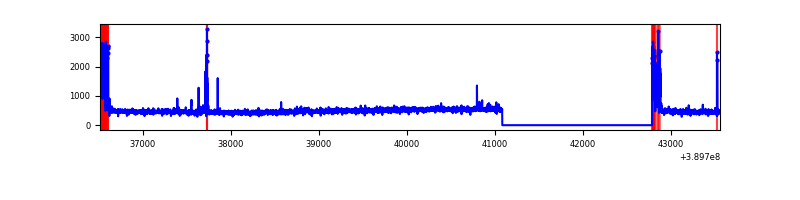 |
| D | 7041 | 5340 | 51 | 51 | 0.72% | 0.96% | 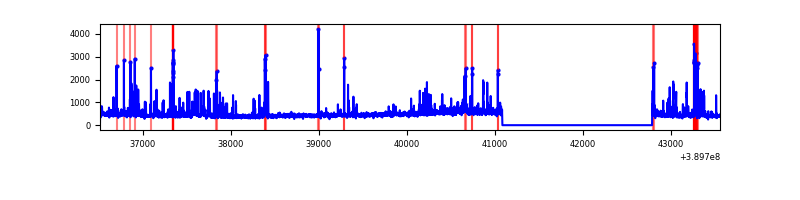 |
Top three noisy pixels from each quadrant. If the there are fewer than three noisy pixels in the level2.evt file, extra rows are filled as -1
| Pixel properties | Quadrant properties | ||||||
|---|---|---|---|---|---|---|---|
| Quadrant | DetID | PixID | Counts | Sigma | Mean | Median | Sigma |
| A | 10 | 83 | 150530 | 1218.78 | 603 | 591 | 123.0 |
| A | 13 | 6 | 16539 | 129.63 | 603 | 591 | 123.0 |
| A | 13 | 254 | 8020 | 60.39 | 603 | 591 | 123.0 |
| B | 5 | 172 | 344686 | 2932.28 | 600 | 584 | 117.3 |
| B | 0 | 189 | 81197 | 686.95 | 600 | 584 | 117.3 |
| B | 4 | 232 | 36359 | 304.86 | 600 | 584 | 117.3 |
| C | 0 | 10 | 272194 | 2019.31 | 578 | 581 | 134.5 |
| C | 15 | 214 | 225271 | 1670.46 | 578 | 581 | 134.5 |
| C | 9 | 187 | 47337 | 347.61 | 578 | 581 | 134.5 |
| D | 13 | 249 | 206465 | 1438.22 | 579 | 563 | 143.2 |
| D | 1 | 52 | 118466 | 823.55 | 579 | 563 | 143.2 |
| D | 12 | 6 | 52601 | 363.48 | 579 | 563 | 143.2 |
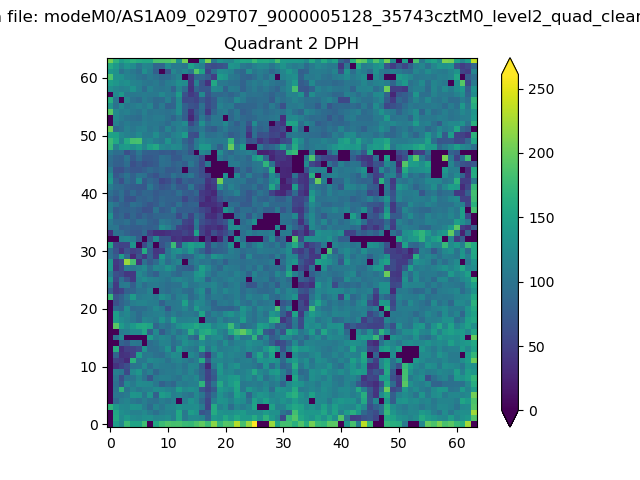
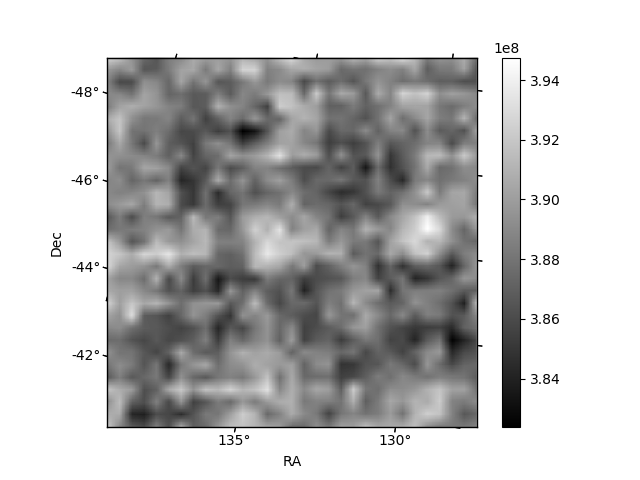
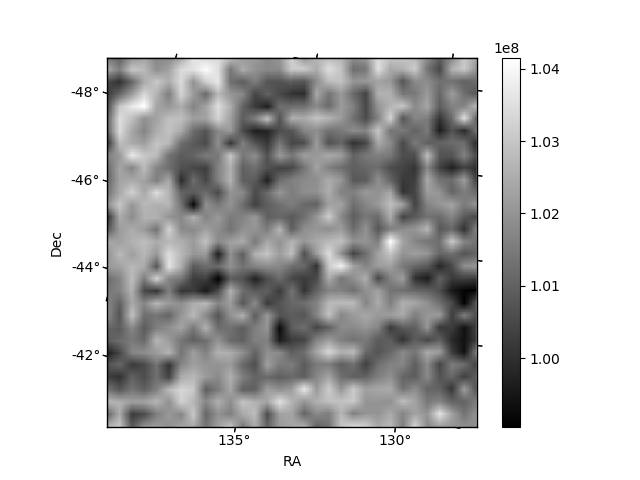
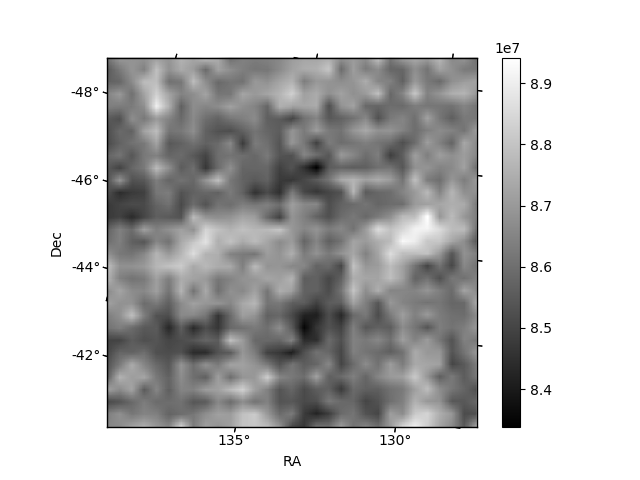
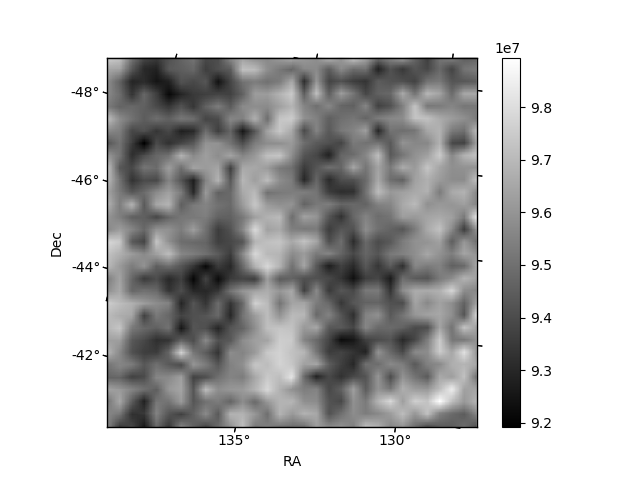
Histogram calculated using DETX and DETY for each event in the final _common_clean file
| Quadrant A | 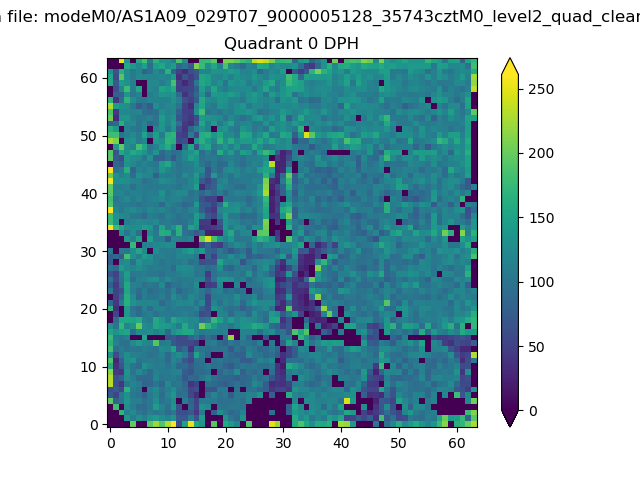 |
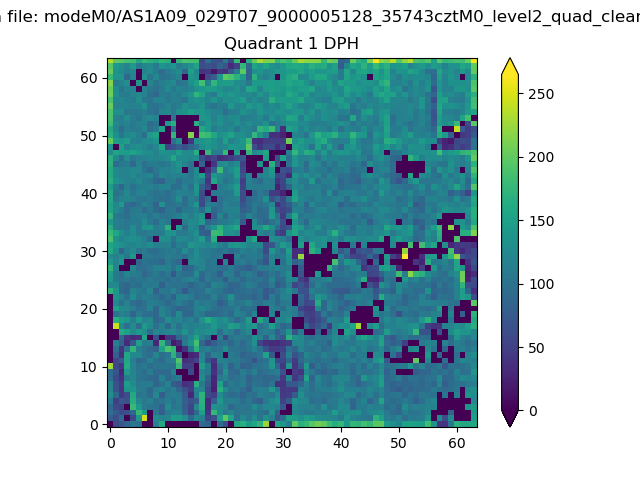 |
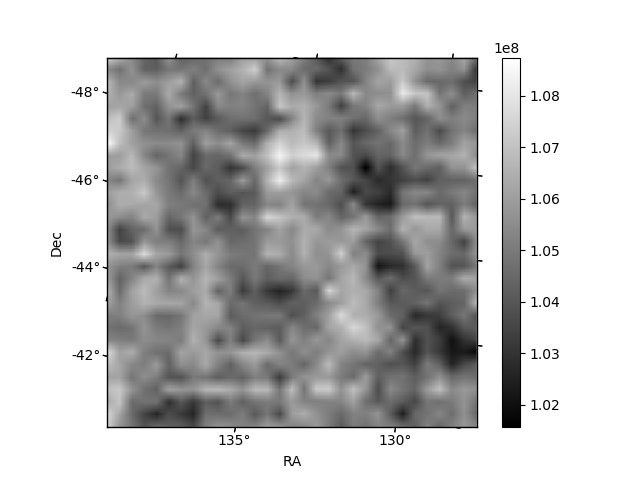
Quadrant B |
|---|---|---|---|
| Quadrant D | 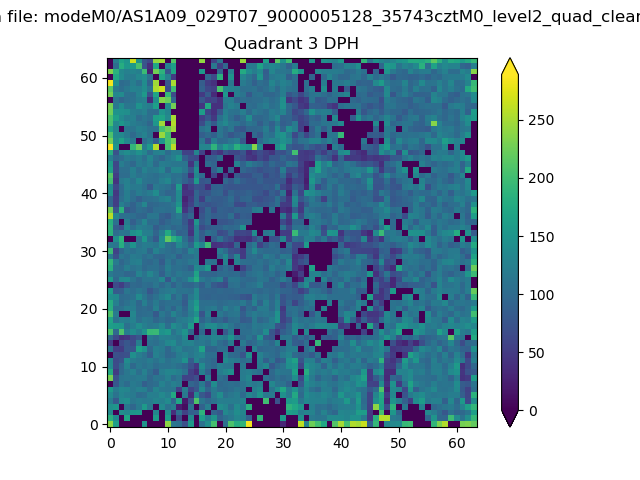 |
 |
Quadrant C |
| Plot type | Count rate plots | Images |
|---|---|---|
| Comparison with Poisson distribution Blue bars denote a histogram of data divided into 1 sec bins. Red curve is a Poisson curve with rate = median count rate of data. |
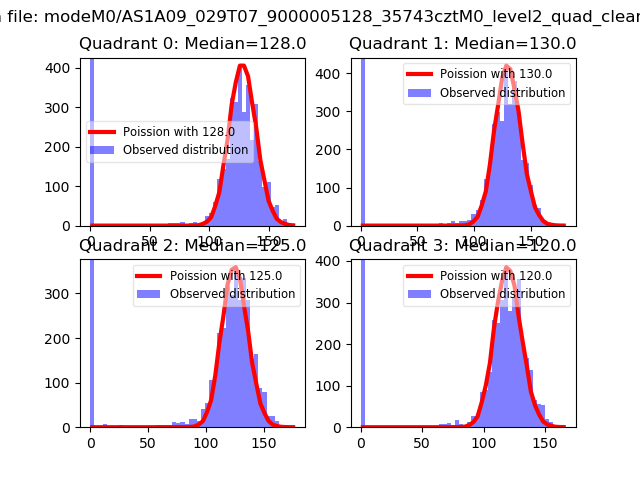 |
 |
| Quadrant-wise count rates Data is divided into 100 sec bins |
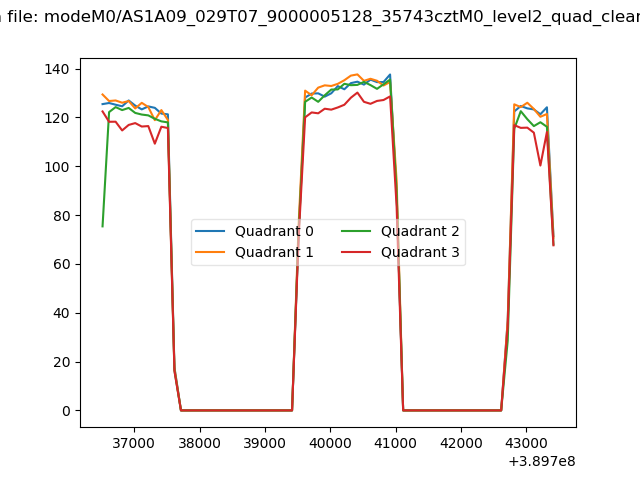 |
|
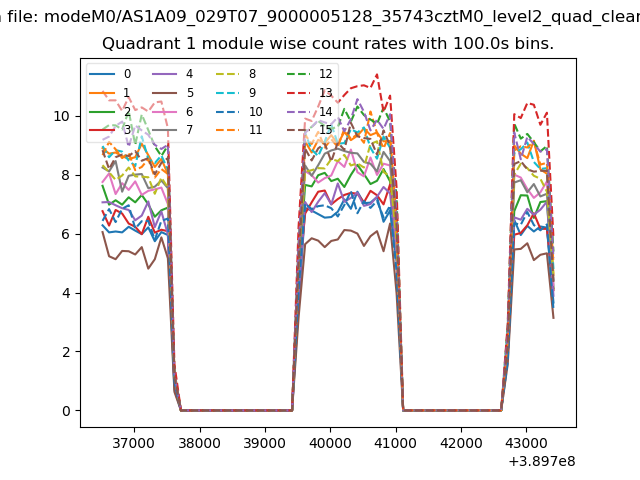
| Module-wise count rates for Quadrant A Data is divided into 100 sec bins |
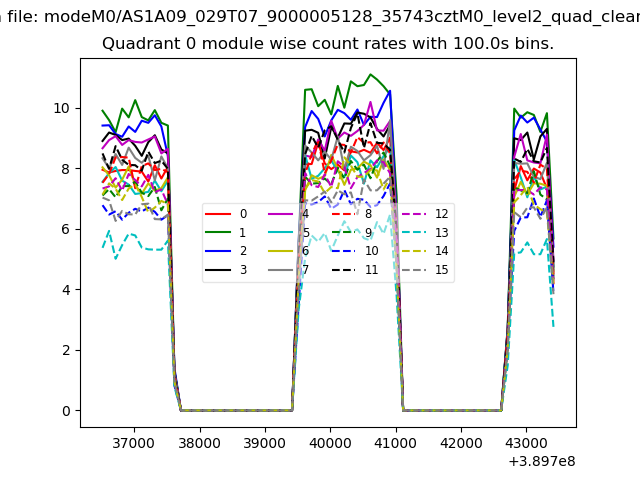 |
 |
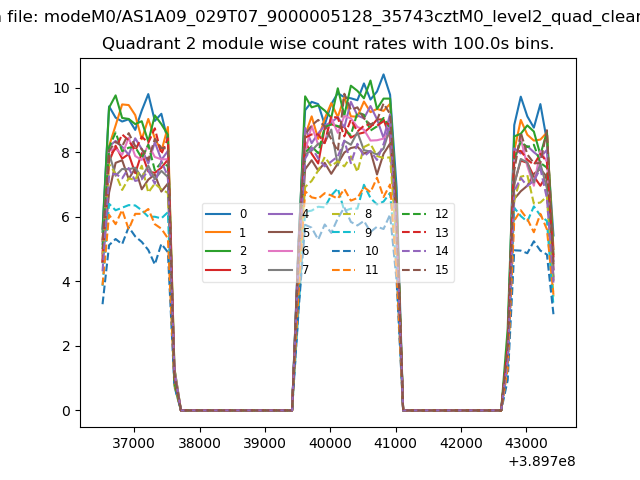
| Module-wise count rates for Quadrant B Data is divided into 100 sec bins |
 |
 |
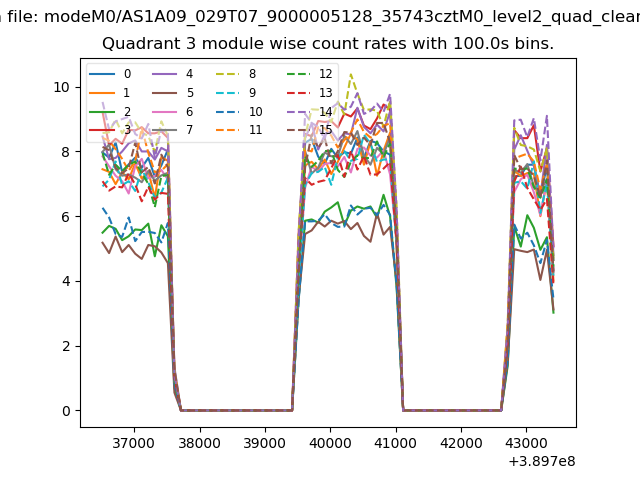
| Module-wise count rates for Quadrant C Data is divided into 100 sec bins |
 |
 |
| Module-wise count rates for Quadrant D Data is divided into 100 sec bins |
 |
 |
| Parameter | Plot |
|---|---|
| CZT HV Monitor | 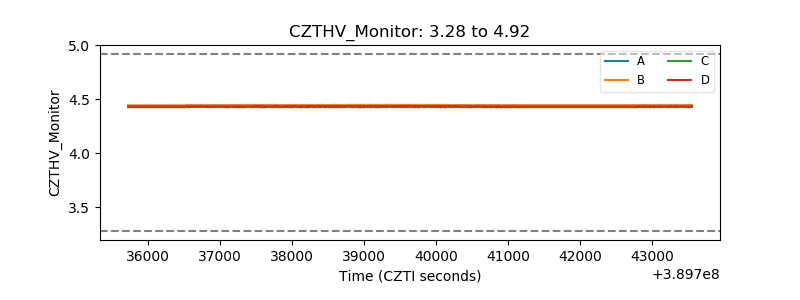 |
| D_VDD | 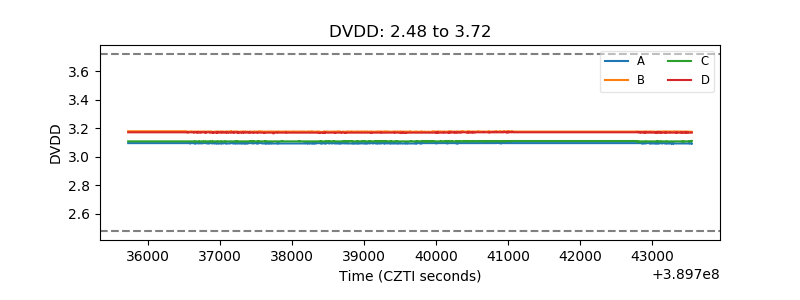 |
| Temperature 1 | 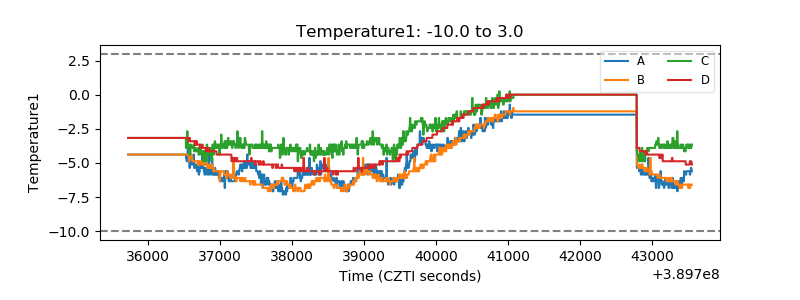 |
| Veto HV Monitor | 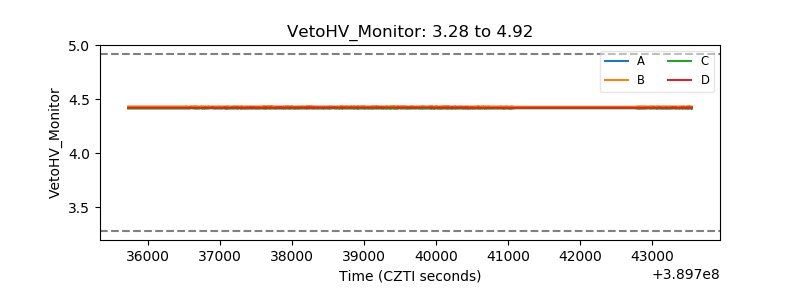 |
| Veto LLD | 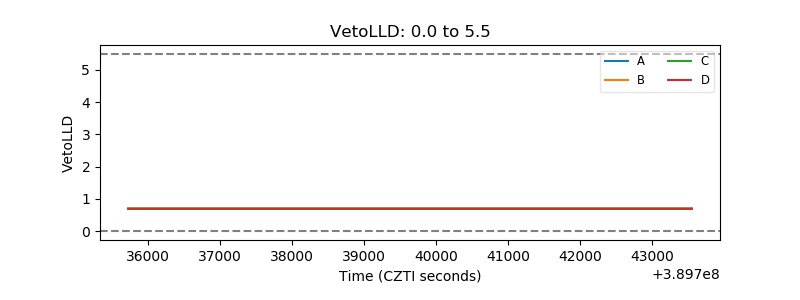 |
| Alpha Counter | 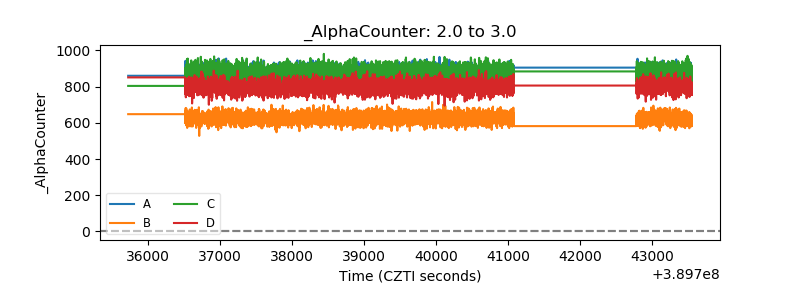 |
| _CPM_Rate | 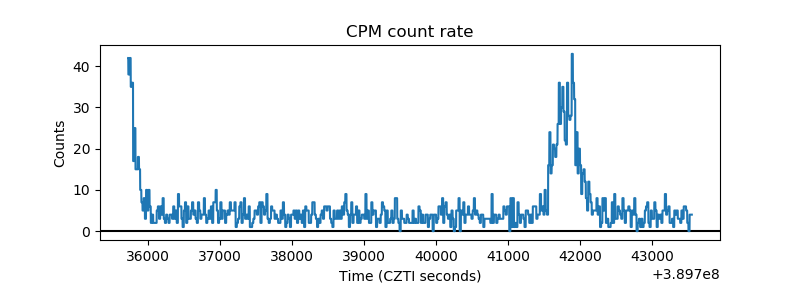 |
| CZT Counter | 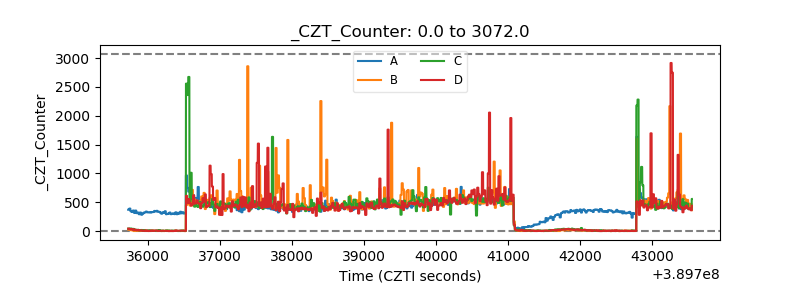 |
| +2.5 Volts monitor | 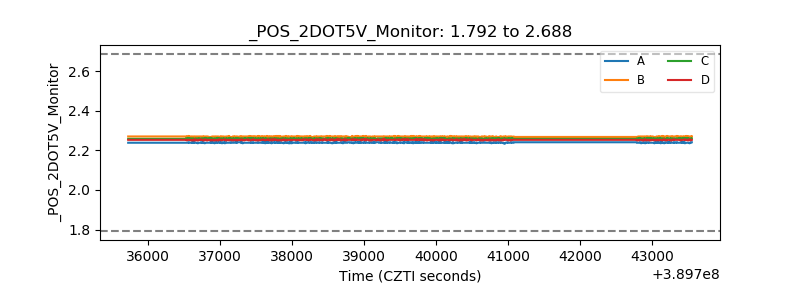 |
| +5 Volts monitor | 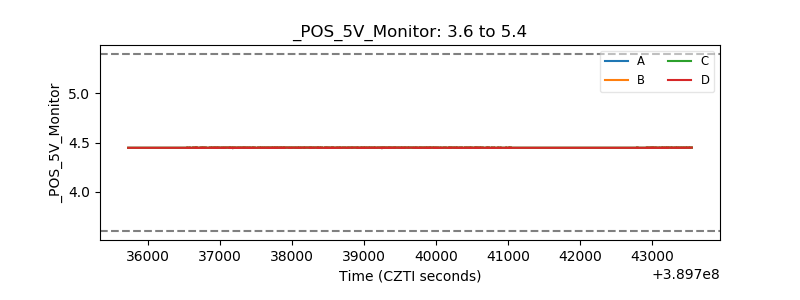 |
| _ROLL_ROT | 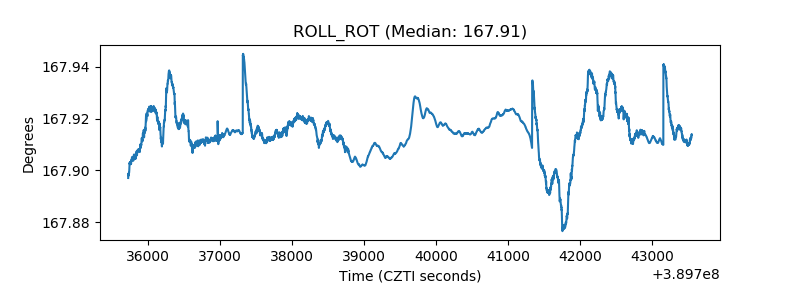 |
| _Roll_DEC | 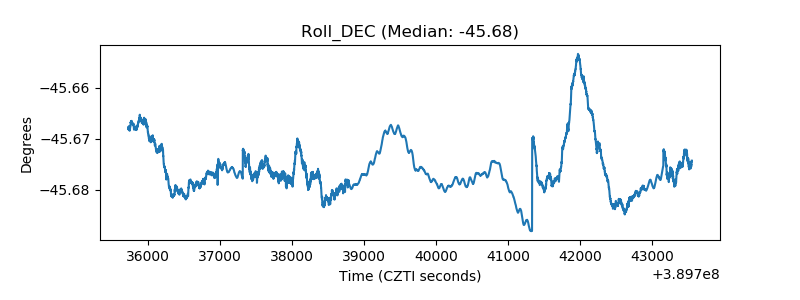 |
| _Roll_RA | 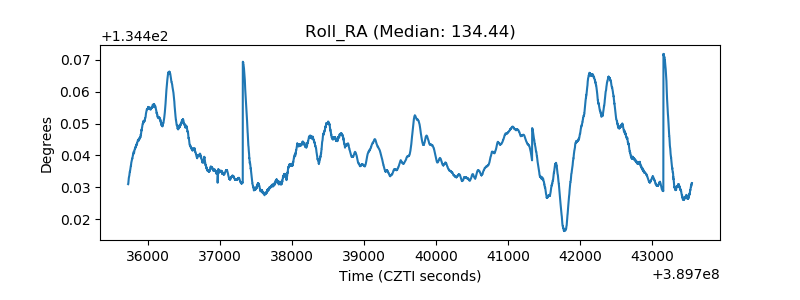 |
| Veto Counter | 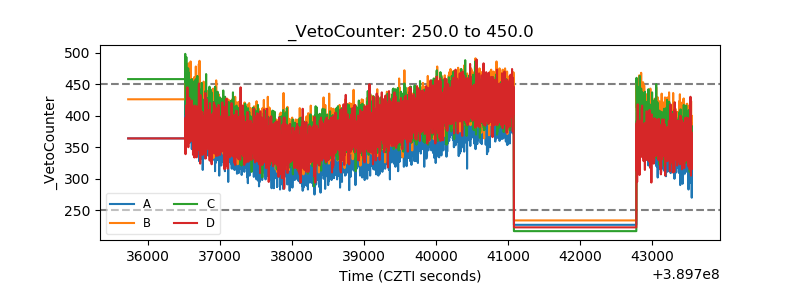 |