| Param | Original file | Final file |
|---|---|---|
| Filename | modeM0/AS1A09_029T07_9000005128_35741cztM0_level2.evt | modeM0/AS1A09_029T07_9000005128_35741cztM0_level2_quad_clean.evt |
| Size (bytes) | 250,810,560 | 36,411,840 |
| Size | 239.2 MB | 34.7 MB |
| Events in quadrant A | 1,700,512 | 219,211 |
| Events in quadrant B | 1,808,014 | 220,211 |
| Events in quadrant C | 1,836,605 | 207,763 |
| Events in quadrant D | 2,007,001 | 202,634 |
| Mode M9 | |||
|---|---|---|---|
| Quadrant | BADHDUFLAG | Total packets | Discarded packets |
| A | 0 | 21 | 0 |
| B | 0 | 21 | 0 |
| C | 0 | 21 | 0 |
| D | 0 | 21 | 0 |
| Mode M0 | |||
|---|---|---|---|
| Quadrant | BADHDUFLAG | Total packets | Discarded packets |
| A | 0 | 7337 | 2 |
| B | 0 | 7589 | 1 |
| C | 0 | 7669 | 1 |
| D | 0 | 8444 | 1 |
| Mode SS | |||
|---|---|---|---|
| Quadrant | BADHDUFLAG | Total packets | Discarded packets |
| A | 0 | 74 | 0 |
| B | 0 | 74 | 0 |
| C | 0 | 74 | 0 |
| D | 0 | 74 | 0 |
| Quadrant | Total seconds | Saturated seconds | Saturation percentage |
|---|---|---|---|
| A | 3559 | 2 | 0.056196% |
| B | 3559 | 13 | 0.365271% |
| C | 3559 | 40 | 1.123911% |
| D | 3559 | 25 | 0.702445% |
Noise dominated data is calculated using 1-second bins in cleaned event files. If a bin has >2000 counts, and if more than 50% of those come from <1% of pixels, then it is considered to be noise-dominated and hence unusable.
| Quadrant | # 1 sec bins | Bins with >0 counts | Bins with >2000 counts | High rate bins dominated by noise | Noise dominated (total time) | Noise dominated (detector-on time) | Marked lightcurve |
|---|---|---|---|---|---|---|---|
| A | 5711 | 3560 | 0 | 0 | 0.00% | 0.00% | 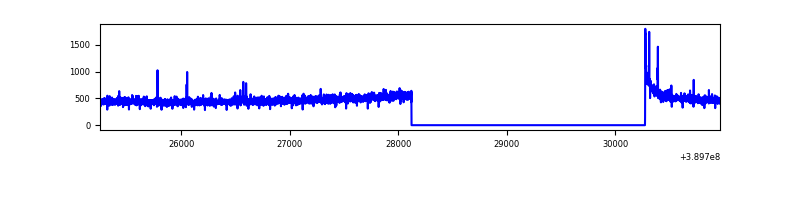 |
| B | 5711 | 3560 | 7 | 7 | 0.12% | 0.20% | 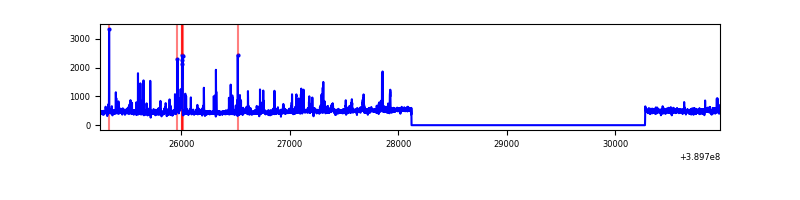 |
| C | 5711 | 3560 | 36 | 36 | 0.63% | 1.01% | 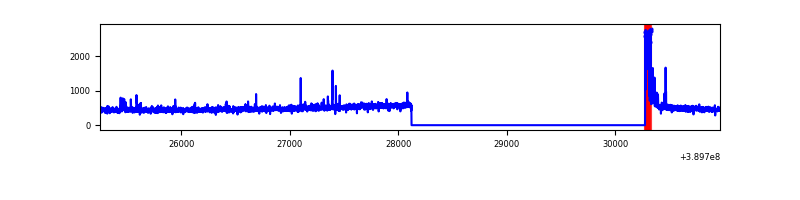 |
| D | 5711 | 3560 | 20 | 20 | 0.35% | 0.56% | 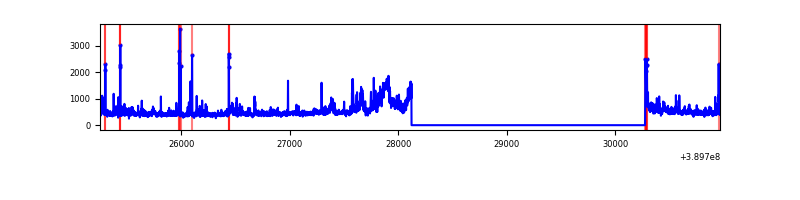 |
Top three noisy pixels from each quadrant. If the there are fewer than three noisy pixels in the level2.evt file, extra rows are filled as -1
| Pixel properties | Quadrant properties | ||||||
|---|---|---|---|---|---|---|---|
| Quadrant | DetID | PixID | Counts | Sigma | Mean | Median | Sigma |
| A | 10 | 83 | 86473 | 1015.48 | 412 | 404 | 84.8 |
| A | 7 | 48 | 7976 | 89.34 | 412 | 404 | 84.8 |
| A | 7 | 3 | 7766 | 86.86 | 412 | 404 | 84.8 |
| B | 5 | 172 | 131664 | 1646.66 | 410 | 398 | 79.7 |
| B | 0 | 189 | 31695 | 392.6 | 410 | 398 | 79.7 |
| B | 5 | 255 | 16807 | 205.84 | 410 | 398 | 79.7 |
| C | 15 | 214 | 148795 | 1622.8 | 392 | 395 | 91.4 |
| C | 0 | 10 | 126857 | 1382.9 | 392 | 395 | 91.4 |
| C | 9 | 187 | 11068 | 116.71 | 392 | 395 | 91.4 |
| D | 1 | 52 | 251558 | 2612.61 | 392 | 382 | 96.1 |
| D | 12 | 17 | 60074 | 620.89 | 392 | 382 | 96.1 |
| D | 14 | 52 | 40878 | 421.22 | 392 | 382 | 96.1 |
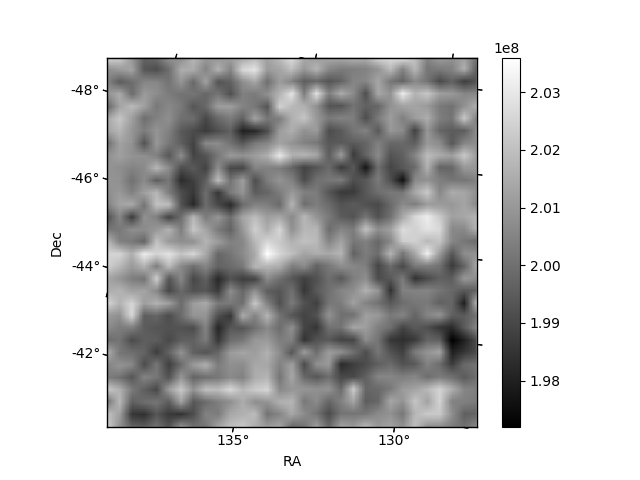
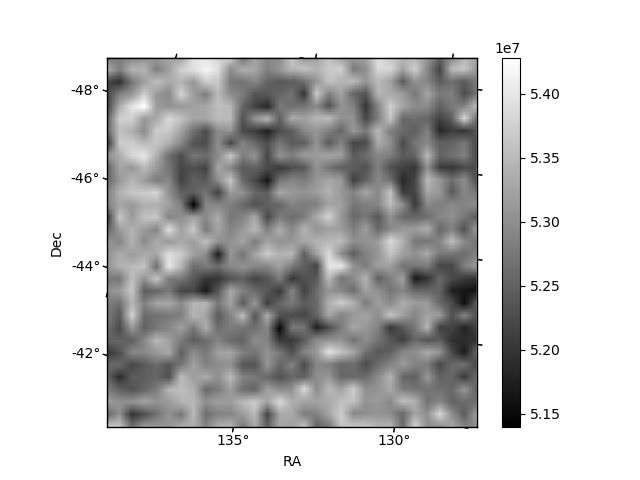
Histogram calculated using DETX and DETY for each event in the final _common_clean file
| Quadrant A | 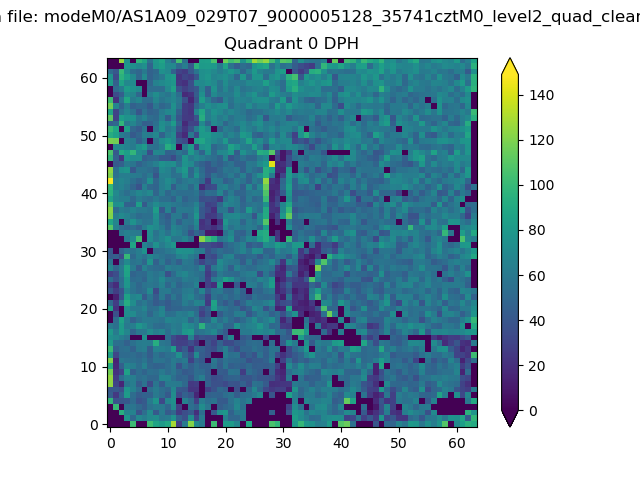 |
 |
Quadrant B |
|---|---|---|---|
| Quadrant D | 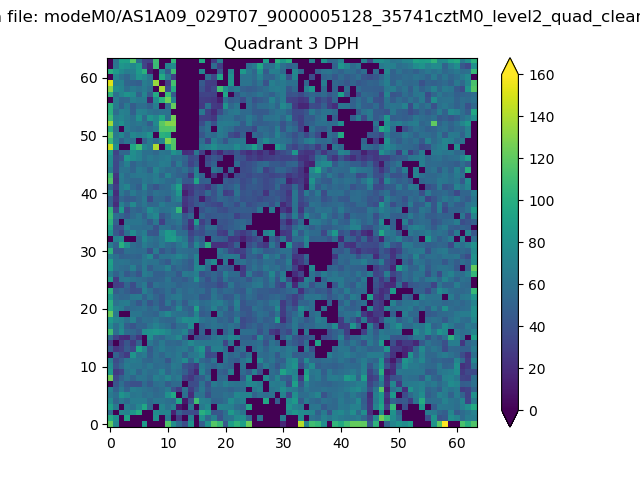 |
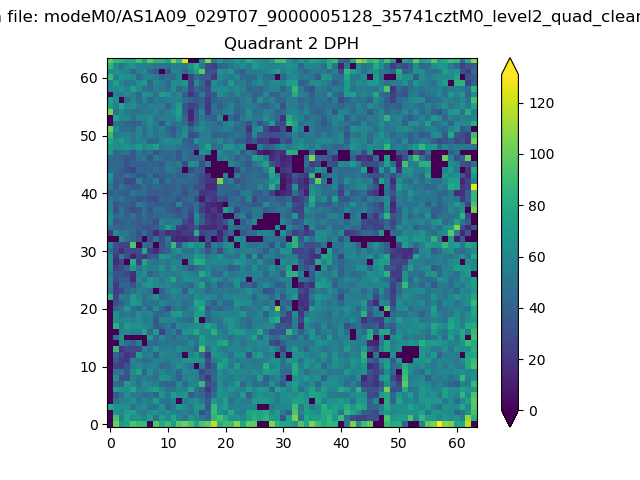 |
Quadrant C |
| Plot type | Count rate plots | Images |
|---|---|---|
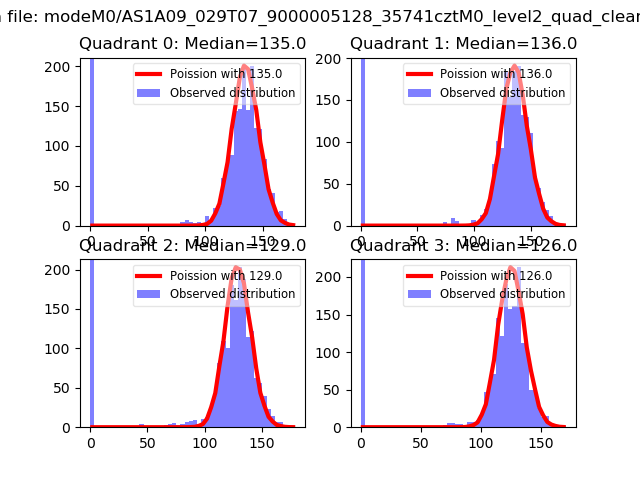
| Comparison with Poisson distribution Blue bars denote a histogram of data divided into 1 sec bins. Red curve is a Poisson curve with rate = median count rate of data. |
 |
 |
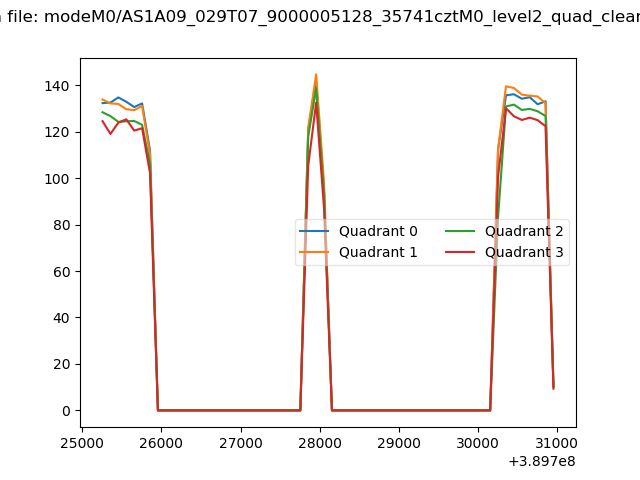
| Quadrant-wise count rates Data is divided into 100 sec bins |
 |
|
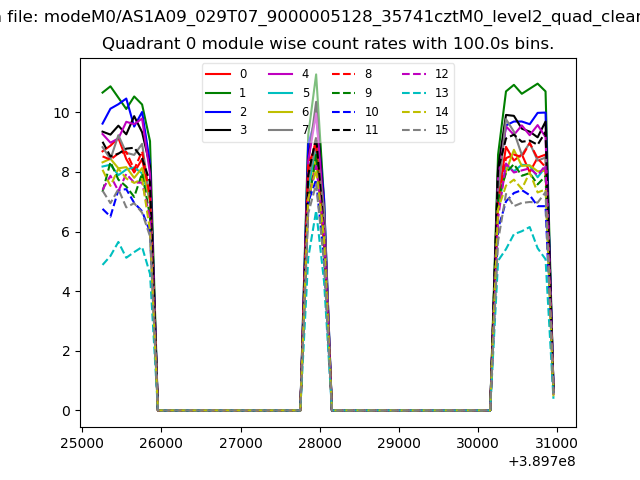
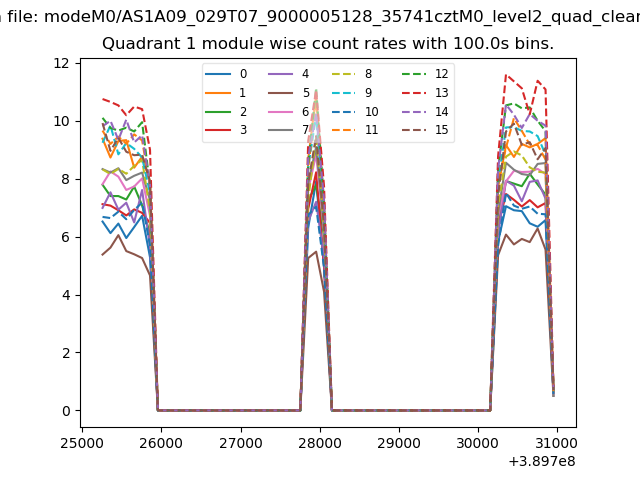
| Module-wise count rates for Quadrant A Data is divided into 100 sec bins |
 |
 |
| Module-wise count rates for Quadrant B Data is divided into 100 sec bins |
 |
 |
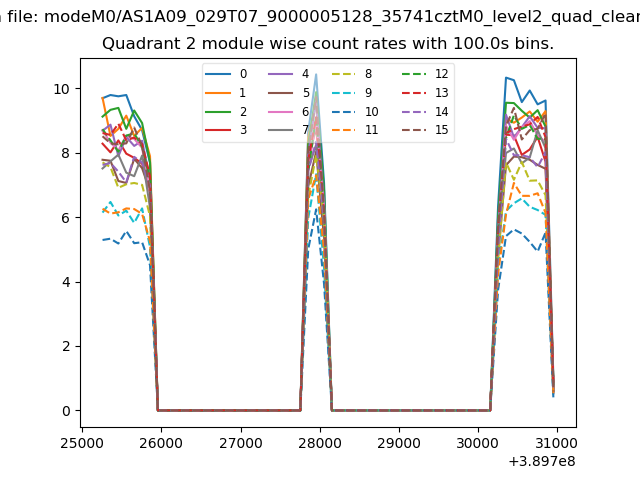
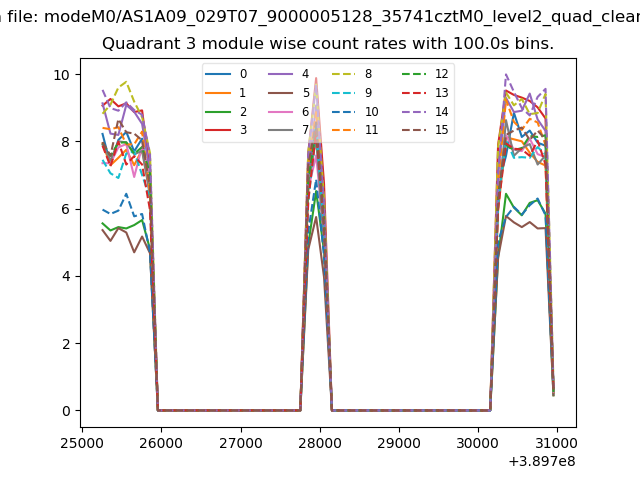
| Module-wise count rates for Quadrant C Data is divided into 100 sec bins |
 |
 |
| Module-wise count rates for Quadrant D Data is divided into 100 sec bins |
 |
 |
| Parameter | Plot |
|---|---|
| CZT HV Monitor | 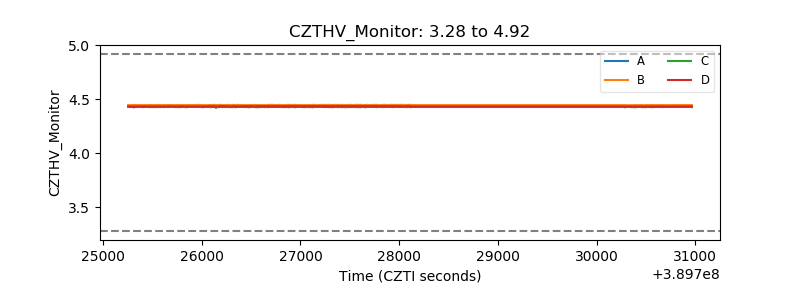 |
| D_VDD | 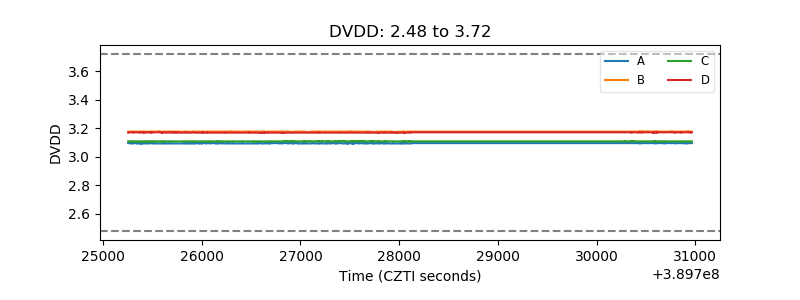 |
| Temperature 1 | 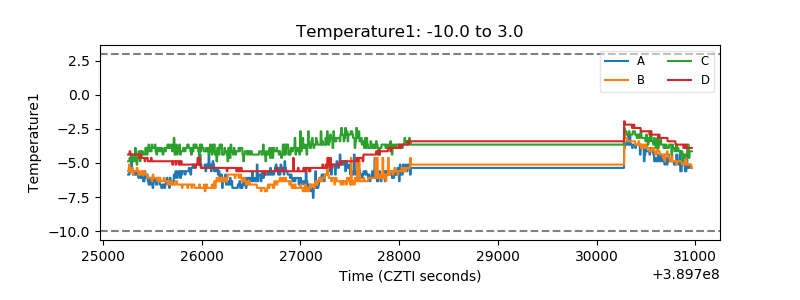 |
| Veto HV Monitor |  |
| Veto LLD | 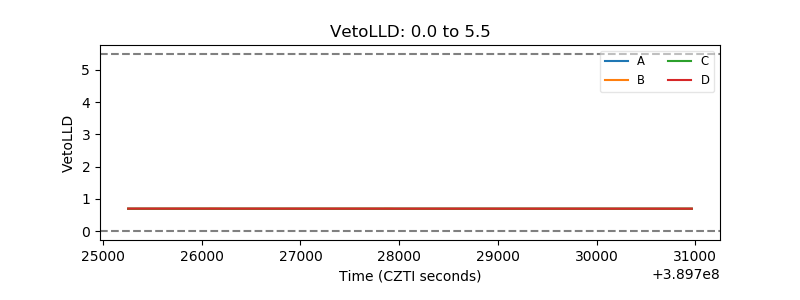 |
| Alpha Counter | 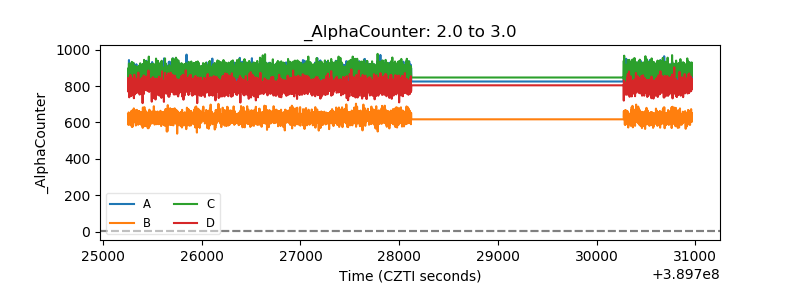 |
| _CPM_Rate | 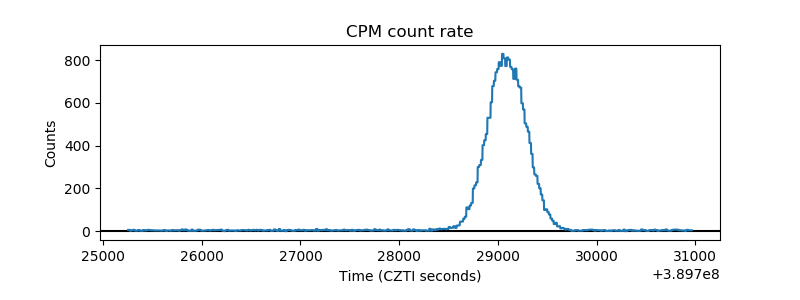 |
| CZT Counter | 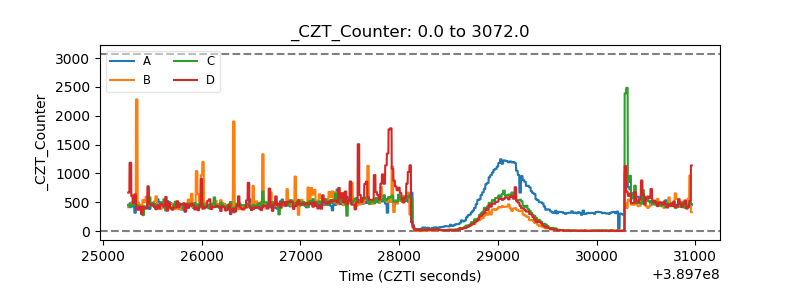 |
| +2.5 Volts monitor | 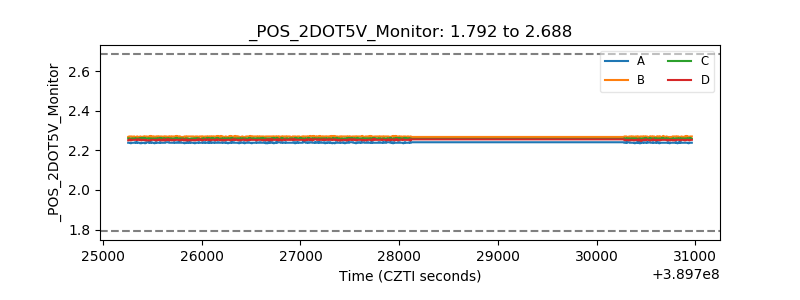 |
| +5 Volts monitor | 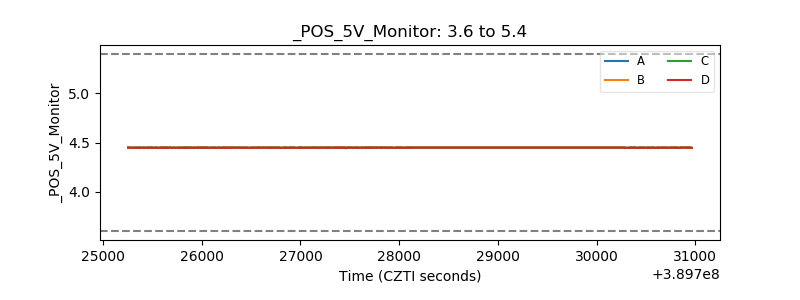 |
| _ROLL_ROT | 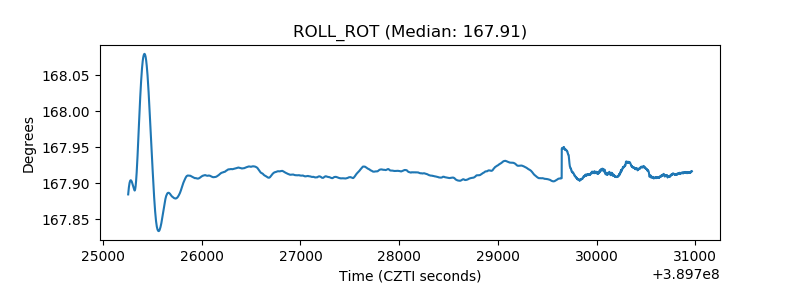 |
| _Roll_DEC | 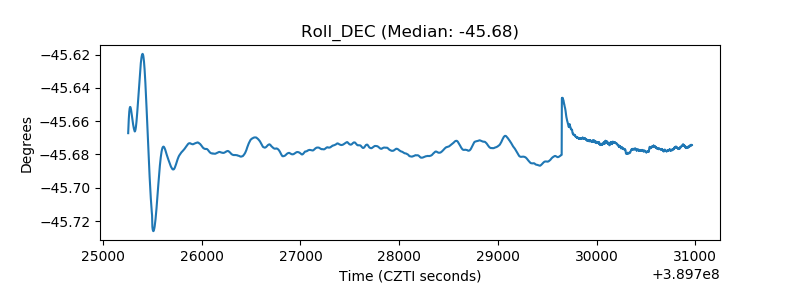 |
| _Roll_RA | 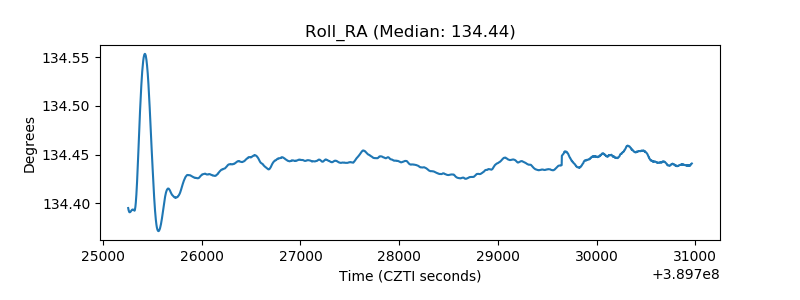 |
| Veto Counter | 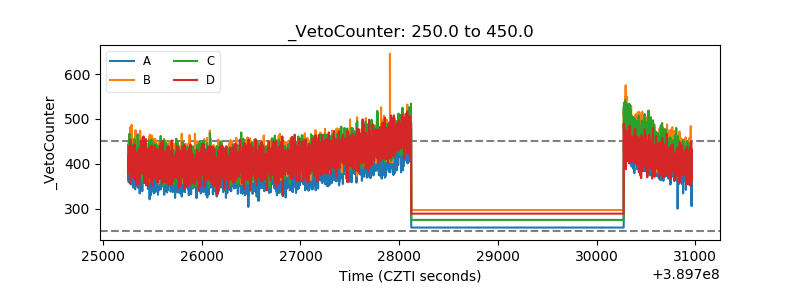 |