| Param | Original file | Final file |
|---|---|---|
| Filename | modeM0/AS1A09_029T06_9000005126_35740cztM0_level2.evt | modeM0/AS1A09_029T06_9000005126_35740cztM0_level2_quad_clean.evt |
| Size (bytes) | 432,146,880 | 71,205,120 |
| Size | 412.1 MB | 67.9 MB |
| Events in quadrant A | 2,541,708 | 468,851 |
| Events in quadrant B | 3,106,641 | 470,550 |
| Events in quadrant C | 2,690,968 | 441,751 |
| Events in quadrant D | 4,405,585 | 420,992 |
| Mode M0 | |||
|---|---|---|---|
| Quadrant | BADHDUFLAG | Total packets | Discarded packets |
| A | 0 | 10644 | 2 |
| B | 0 | 12361 | 2 |
| C | 0 | 11005 | 2 |
| D | 0 | 16416 | 2 |
| Mode SS | |||
|---|---|---|---|
| Quadrant | BADHDUFLAG | Total packets | Discarded packets |
| A | 0 | 104 | 0 |
| B | 0 | 104 | 0 |
| C | 0 | 104 | 0 |
| D | 0 | 104 | 0 |
| Mode M9 | |||
|---|---|---|---|
| Quadrant | BADHDUFLAG | Total packets | Discarded packets |
| A | 0 | 21 | 0 |
| B | 0 | 21 | 0 |
| C | 0 | 21 | 0 |
| D | 0 | 21 | 0 |
| Quadrant | Total seconds | Saturated seconds | Saturation percentage |
|---|---|---|---|
| A | 5045 | 9 | 0.178394% |
| B | 5045 | 188 | 3.726462% |
| C | 5045 | 74 | 1.466799% |
| D | 5045 | 241 | 4.777007% |
Noise dominated data is calculated using 1-second bins in cleaned event files. If a bin has >2000 counts, and if more than 50% of those come from <1% of pixels, then it is considered to be noise-dominated and hence unusable.
| Quadrant | # 1 sec bins | Bins with >0 counts | Bins with >2000 counts | High rate bins dominated by noise | Noise dominated (total time) | Noise dominated (detector-on time) | Marked lightcurve |
|---|---|---|---|---|---|---|---|
| A | 7168 | 5046 | 0 | 0 | 0.00% | 0.00% | 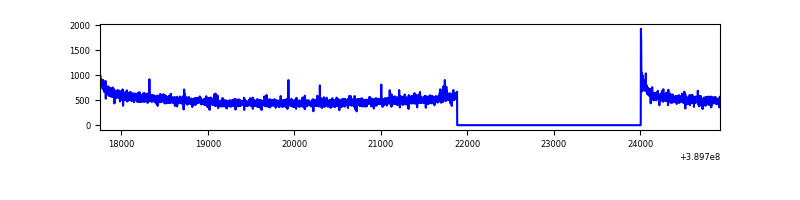 |
| B | 7168 | 5046 | 135 | 135 | 1.88% | 2.68% | 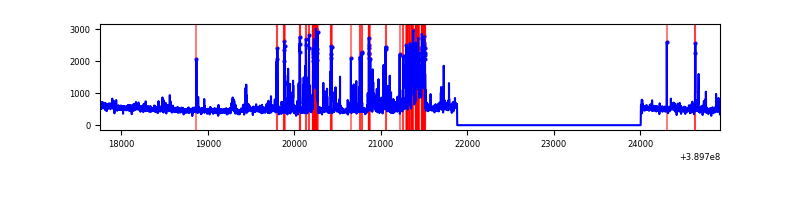 |
| C | 7168 | 5046 | 70 | 70 | 0.98% | 1.39% | 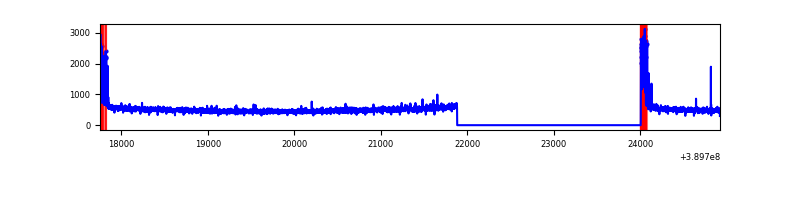 |
| D | 7168 | 5046 | 290 | 290 | 4.05% | 5.75% | 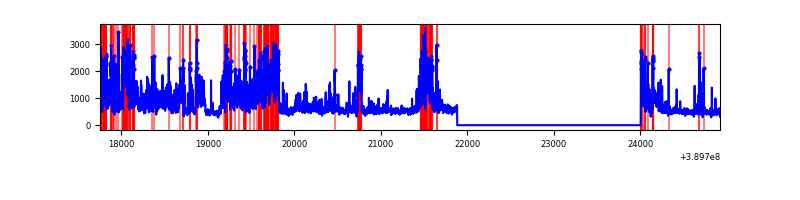 |
Top three noisy pixels from each quadrant. If the there are fewer than three noisy pixels in the level2.evt file, extra rows are filled as -1
| Pixel properties | Quadrant properties | ||||||
|---|---|---|---|---|---|---|---|
| Quadrant | DetID | PixID | Counts | Sigma | Mean | Median | Sigma |
| A | 10 | 83 | 143427 | 1154.09 | 613 | 602 | 123.8 |
| A | 13 | 6 | 16072 | 125.0 | 613 | 602 | 123.8 |
| A | 7 | 48 | 7490 | 55.66 | 613 | 602 | 123.8 |
| B | 5 | 172 | 599745 | 5276.95 | 597 | 584 | 113.5 |
| B | 5 | 255 | 67797 | 591.96 | 597 | 584 | 113.5 |
| B | 0 | 189 | 62435 | 544.74 | 597 | 584 | 113.5 |
| C | 0 | 10 | 219066 | 1659.34 | 573 | 577 | 131.7 |
| C | 15 | 214 | 212588 | 1610.14 | 573 | 577 | 131.7 |
| C | 0 | 207 | 9305 | 66.29 | 573 | 577 | 131.7 |
| D | 1 | 52 | 1346733 | 9578.47 | 575 | 561 | 140.5 |
| D | 14 | 52 | 384095 | 2728.97 | 575 | 561 | 140.5 |
| D | 13 | 249 | 192808 | 1367.9 | 575 | 561 | 140.5 |
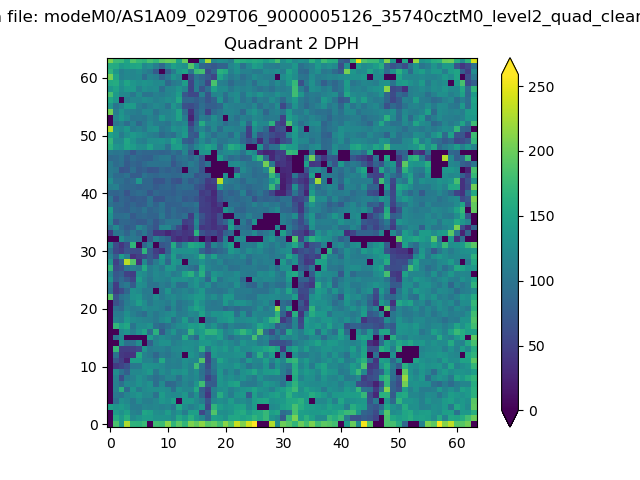
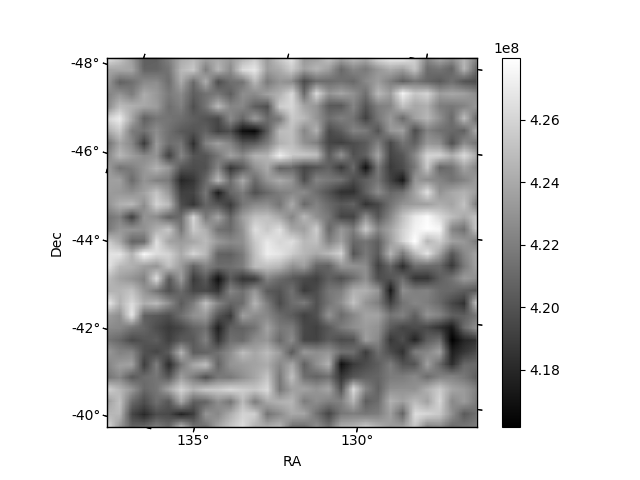
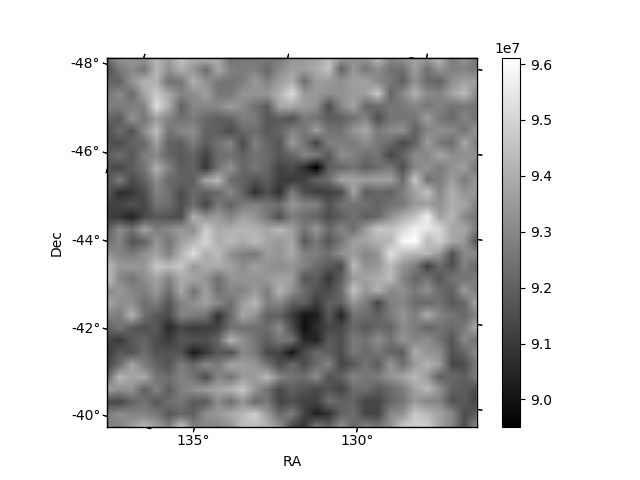
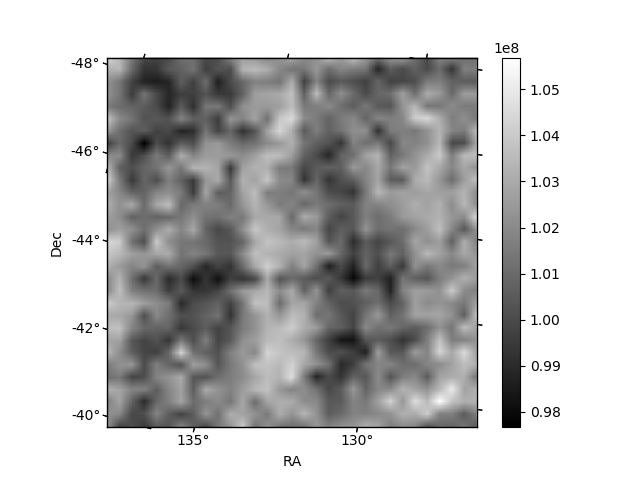
Histogram calculated using DETX and DETY for each event in the final _common_clean file
| Quadrant A | 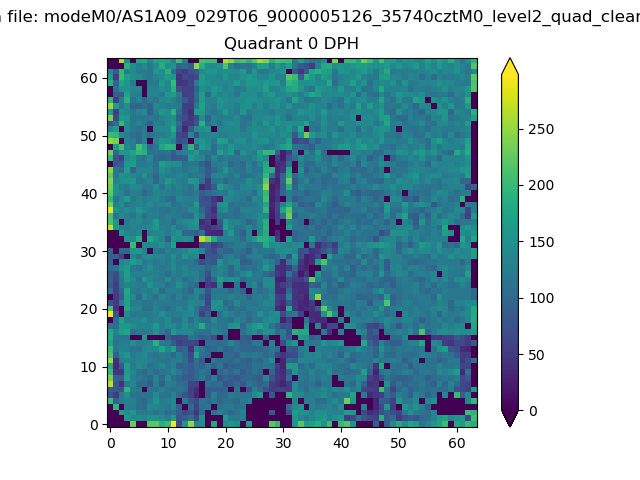 |
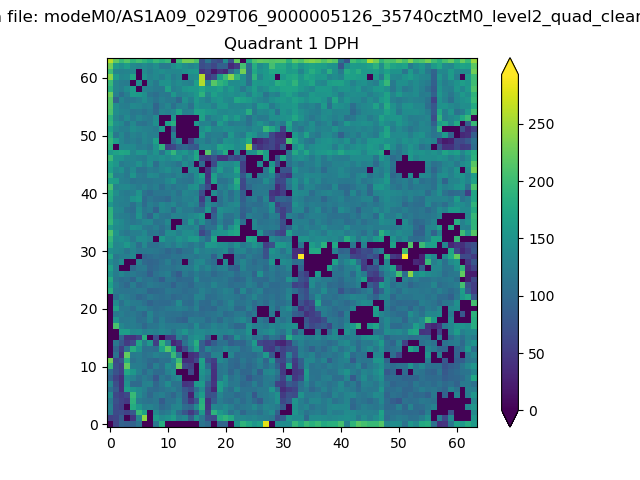 |
Quadrant B |
|---|---|---|---|
| Quadrant D | 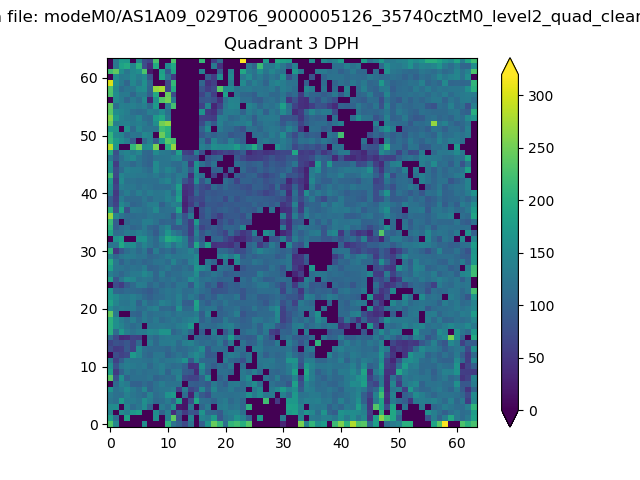 |
 |
Quadrant C |
| Plot type | Count rate plots | Images |
|---|---|---|
| Comparison with Poisson distribution Blue bars denote a histogram of data divided into 1 sec bins. Red curve is a Poisson curve with rate = median count rate of data. |
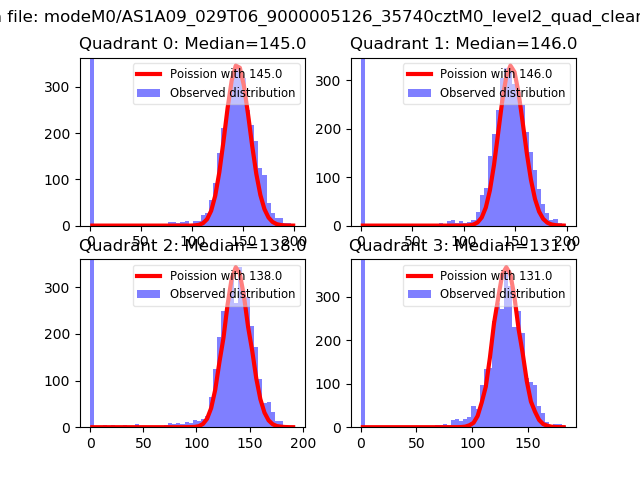 |
 |
| Quadrant-wise count rates Data is divided into 100 sec bins |
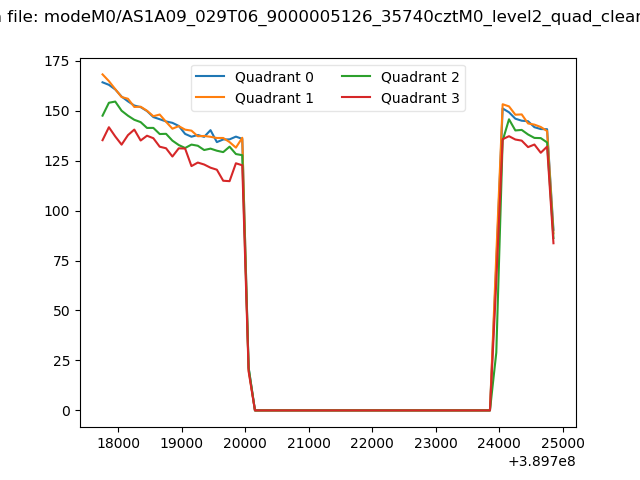 |
|
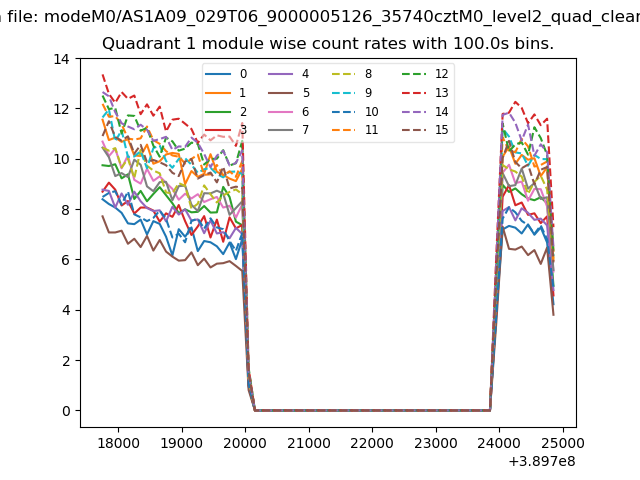
| Module-wise count rates for Quadrant A Data is divided into 100 sec bins |
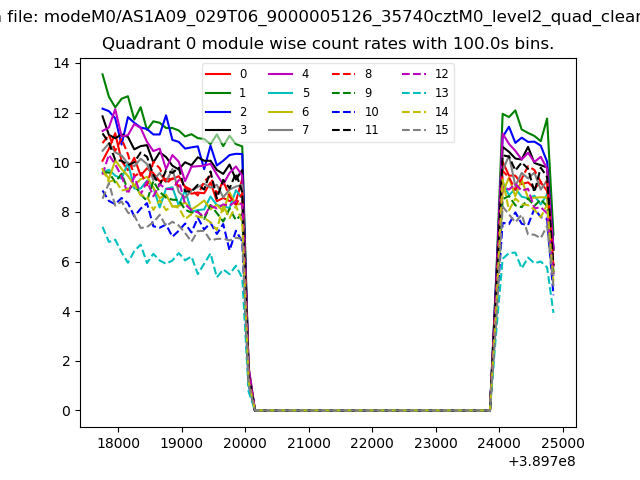 |
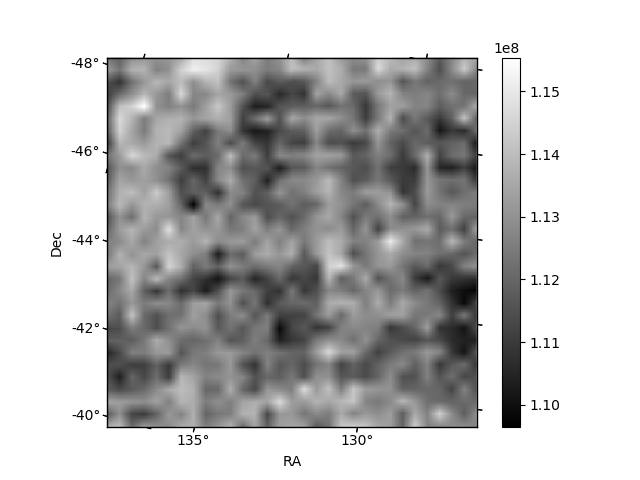 |
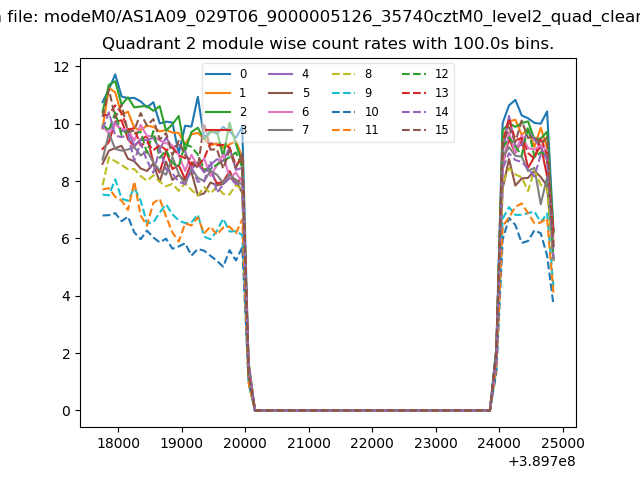
| Module-wise count rates for Quadrant B Data is divided into 100 sec bins |
 |
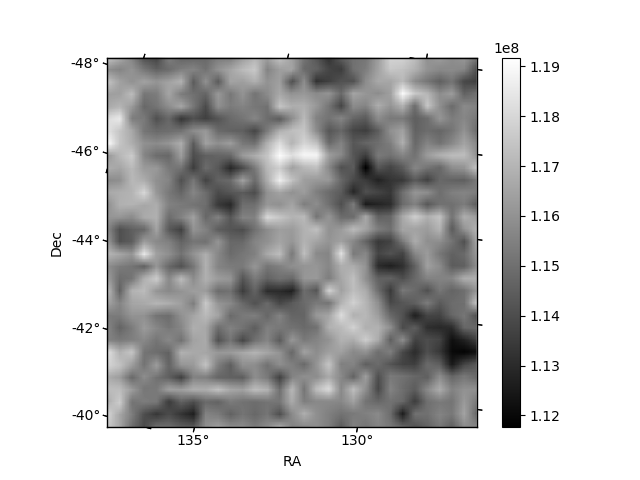 |
| Module-wise count rates for Quadrant C Data is divided into 100 sec bins |
 |
 |
| Module-wise count rates for Quadrant D Data is divided into 100 sec bins |
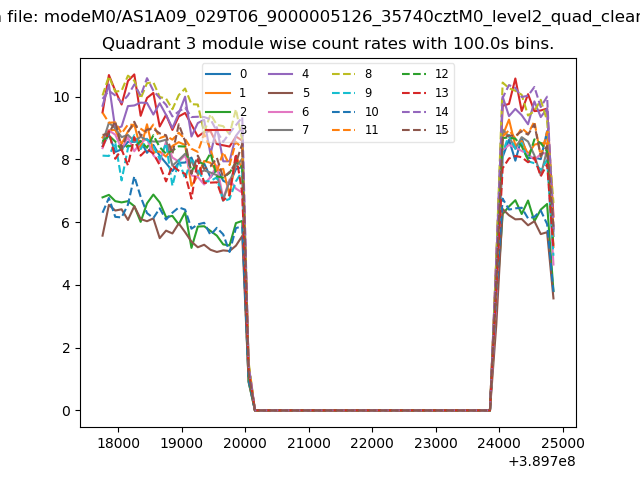 |
 |
| Parameter | Plot |
|---|---|
| CZT HV Monitor |  |
| D_VDD | 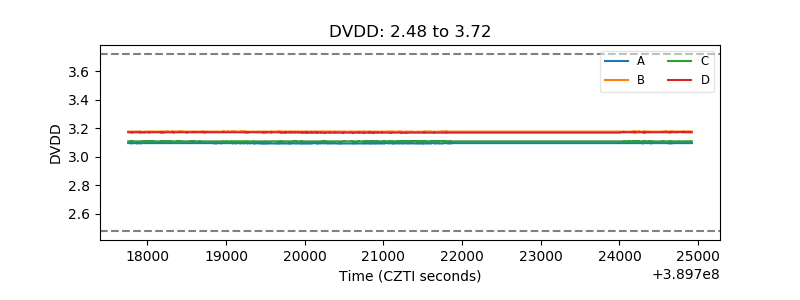 |
| Temperature 1 | 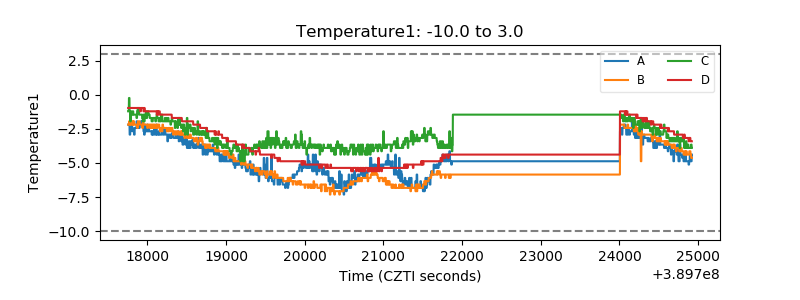 |
| Veto HV Monitor | 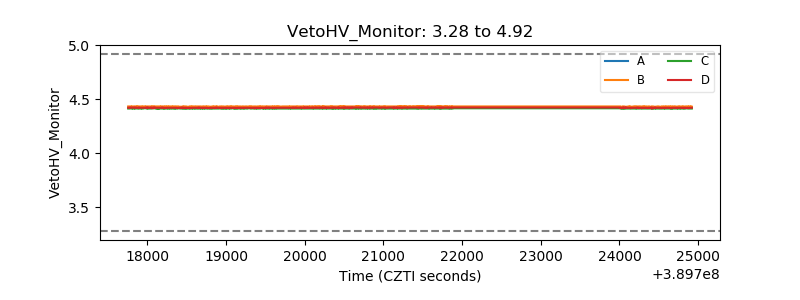 |
| Veto LLD | 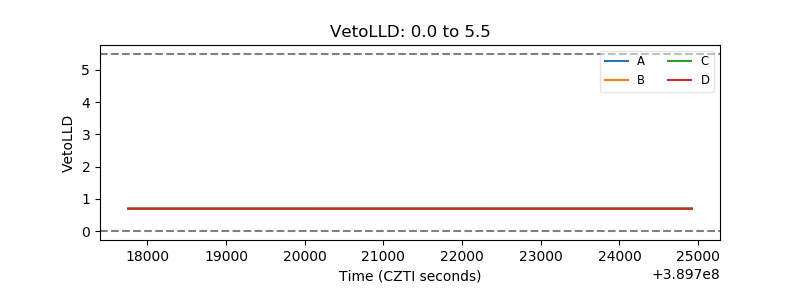 |
| Alpha Counter | 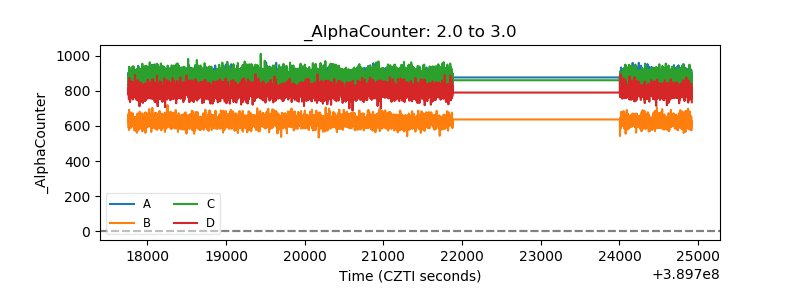 |
| _CPM_Rate | 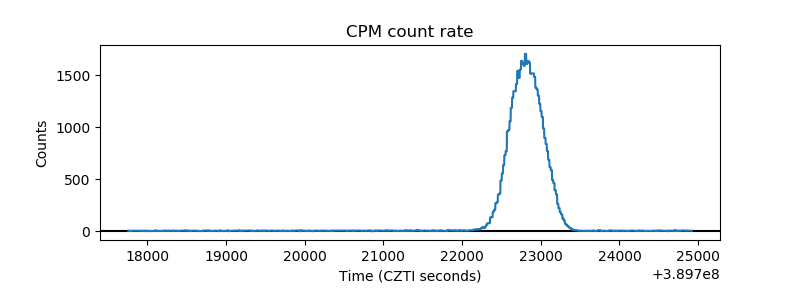 |
| CZT Counter | 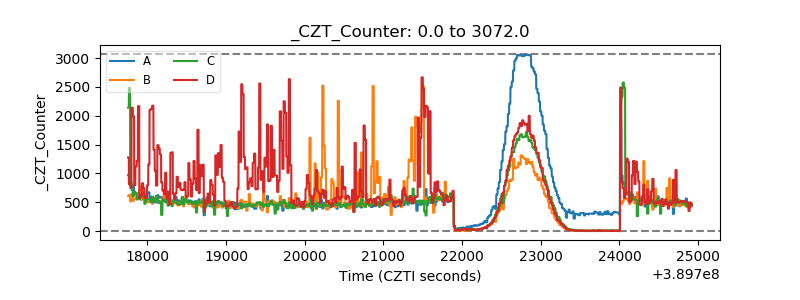 |
| +2.5 Volts monitor | 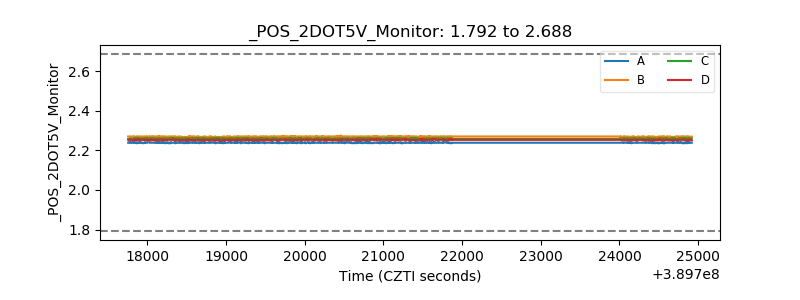 |
| +5 Volts monitor | 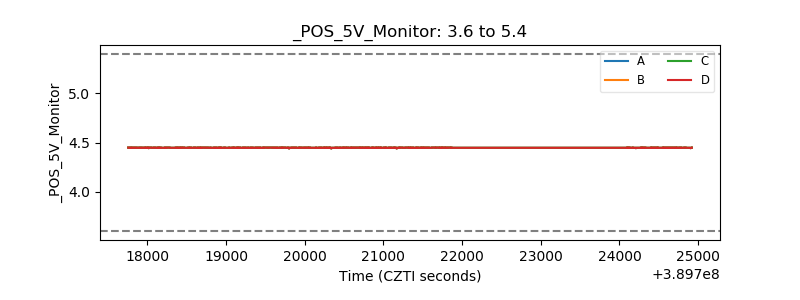 |
| _ROLL_ROT | 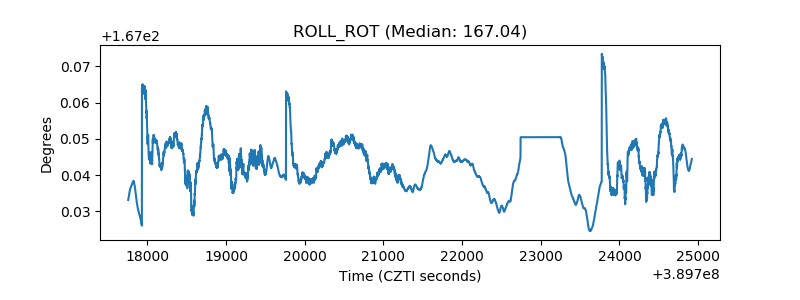 |
| _Roll_DEC | 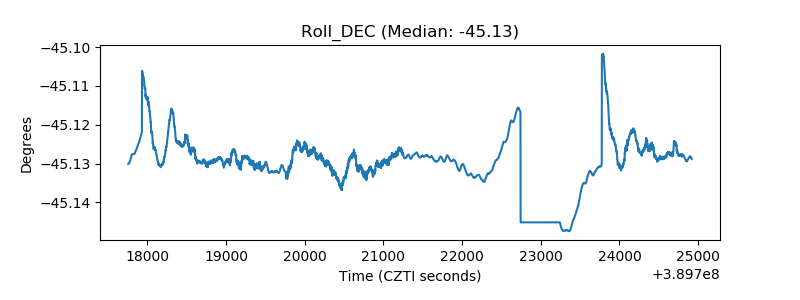 |
| _Roll_RA | 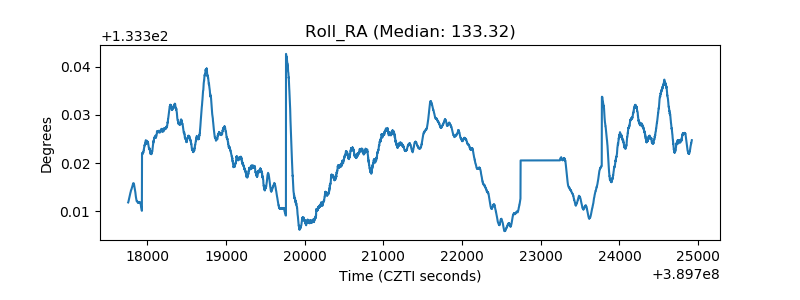 |
| Veto Counter | 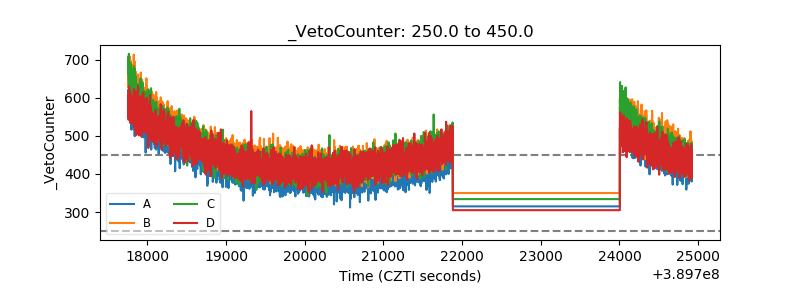 |