| Param | Original file | Final file |
|---|---|---|
| Filename | modeM0/AS1A09_029T06_9000005126_35739cztM0_level2.evt | modeM0/AS1A09_029T06_9000005126_35739cztM0_level2_quad_clean.evt |
| Size (bytes) | 881,432,640 | 132,652,800 |
| Size | 840.6 MB | 126.5 MB |
| Events in quadrant A | 4,469,380 | 900,882 |
| Events in quadrant B | 4,658,610 | 897,231 |
| Events in quadrant C | 4,823,312 | 853,776 |
| Events in quadrant D | 12,143,577 | 748,528 |
| Mode M0 | |||
|---|---|---|---|
| Quadrant | BADHDUFLAG | Total packets | Discarded packets |
| A | 0 | 18693 | 3 |
| B | 0 | 19331 | 2 |
| C | 0 | 19627 | 2 |
| D | 0 | 42162 | 2 |
| Mode SS | |||
|---|---|---|---|
| Quadrant | BADHDUFLAG | Total packets | Discarded packets |
| A | 0 | 182 | 0 |
| B | 0 | 182 | 0 |
| C | 0 | 182 | 0 |
| D | 0 | 182 | 0 |
| Mode M9 | |||
|---|---|---|---|
| Quadrant | BADHDUFLAG | Total packets | Discarded packets |
| A | 0 | 40 | 0 |
| B | 0 | 40 | 0 |
| C | 0 | 40 | 0 |
| D | 0 | 40 | 0 |
| Quadrant | Total seconds | Saturated seconds | Saturation percentage |
|---|---|---|---|
| A | 8883 | 26 | 0.292694% |
| B | 8883 | 64 | 0.720477% |
| C | 8883 | 98 | 1.103231% |
| D | 8883 | 1849 | 20.815040% |
Noise dominated data is calculated using 1-second bins in cleaned event files. If a bin has >2000 counts, and if more than 50% of those come from <1% of pixels, then it is considered to be noise-dominated and hence unusable.
| Quadrant | # 1 sec bins | Bins with >0 counts | Bins with >2000 counts | High rate bins dominated by noise | Noise dominated (total time) | Noise dominated (detector-on time) | Marked lightcurve |
|---|---|---|---|---|---|---|---|
| A | 12890 | 8885 | 12 | 12 | 0.09% | 0.14% | 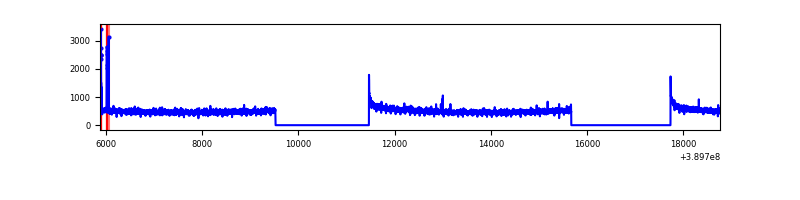 |
| B | 12890 | 8885 | 41 | 41 | 0.32% | 0.46% | 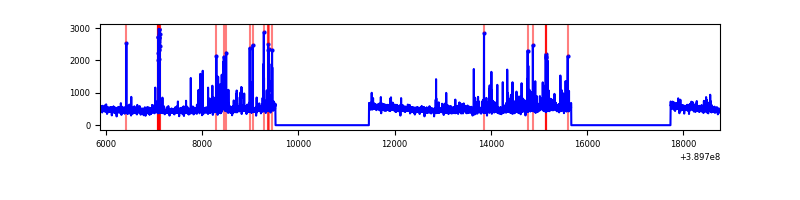 |
| C | 12890 | 8885 | 95 | 95 | 0.74% | 1.07% | 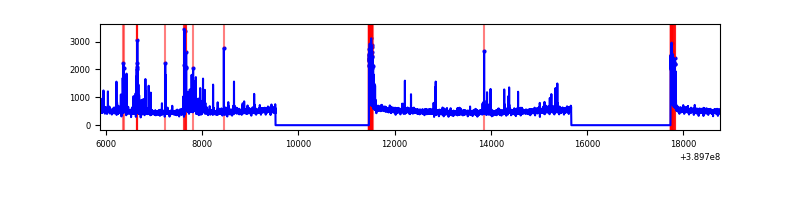 |
| D | 12890 | 8885 | 2197 | 2197 | 17.04% | 24.73% | 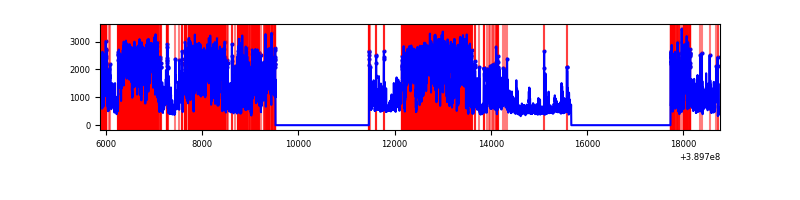 |
Top three noisy pixels from each quadrant. If the there are fewer than three noisy pixels in the level2.evt file, extra rows are filled as -1
| Pixel properties | Quadrant properties | ||||||
|---|---|---|---|---|---|---|---|
| Quadrant | DetID | PixID | Counts | Sigma | Mean | Median | Sigma |
| A | 10 | 83 | 204440 | 948.83 | 1078 | 1060 | 214.3 |
| A | 15 | 169 | 47833 | 218.21 | 1078 | 1060 | 214.3 |
| A | 13 | 6 | 22109 | 98.2 | 1078 | 1060 | 214.3 |
| B | 5 | 172 | 208102 | 1042.34 | 1057 | 1032 | 198.7 |
| B | 5 | 255 | 120262 | 600.17 | 1057 | 1032 | 198.7 |
| B | 0 | 189 | 84053 | 417.91 | 1057 | 1032 | 198.7 |
| C | 15 | 214 | 369127 | 1592.72 | 1006 | 1012 | 231.1 |
| C | 0 | 10 | 270673 | 1166.74 | 1006 | 1012 | 231.1 |
| C | 15 | 208 | 158023 | 679.34 | 1006 | 1012 | 231.1 |
| D | 1 | 52 | 5764342 | 24425.94 | 976 | 951 | 236.0 |
| D | 14 | 52 | 1940757 | 8221.13 | 976 | 951 | 236.0 |
| D | 12 | 17 | 176597 | 744.41 | 976 | 951 | 236.0 |
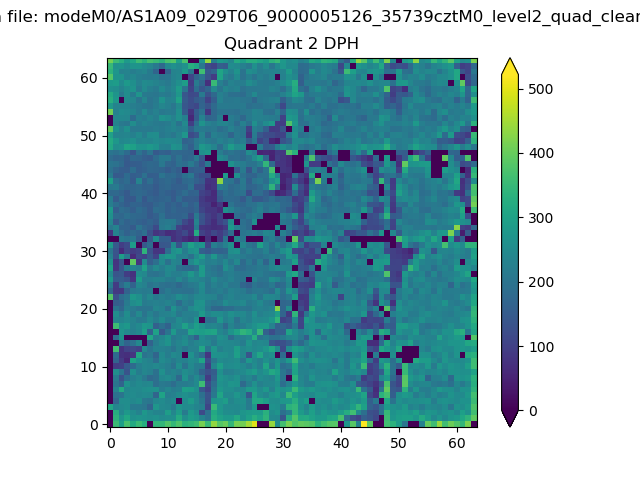
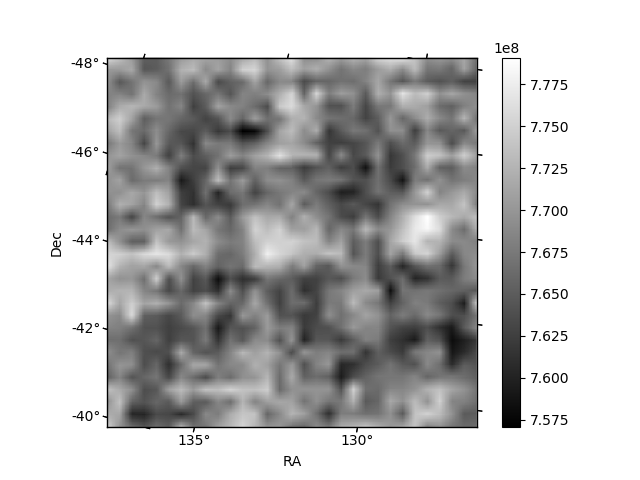
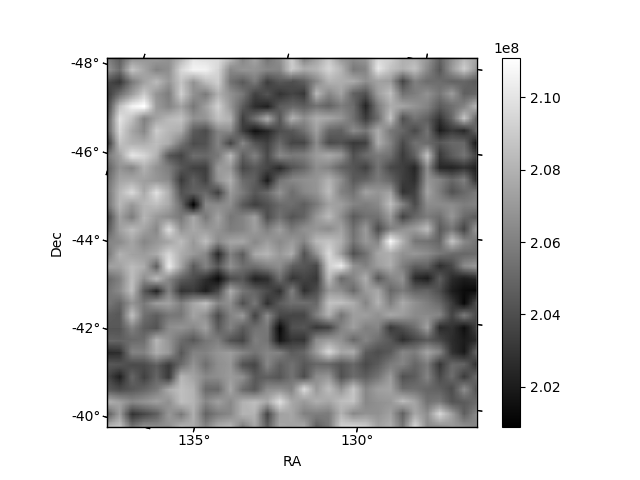
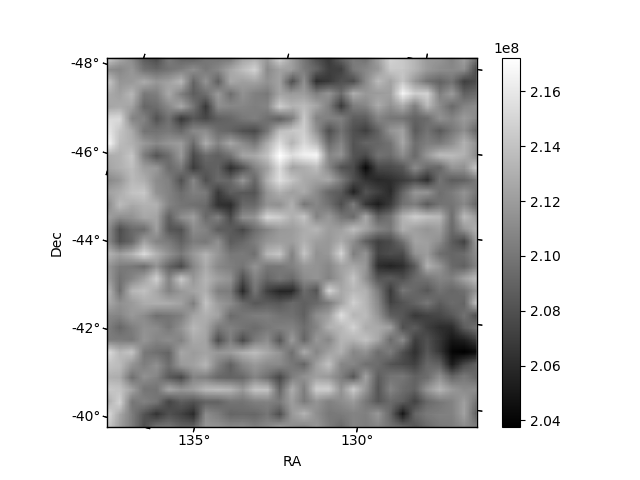
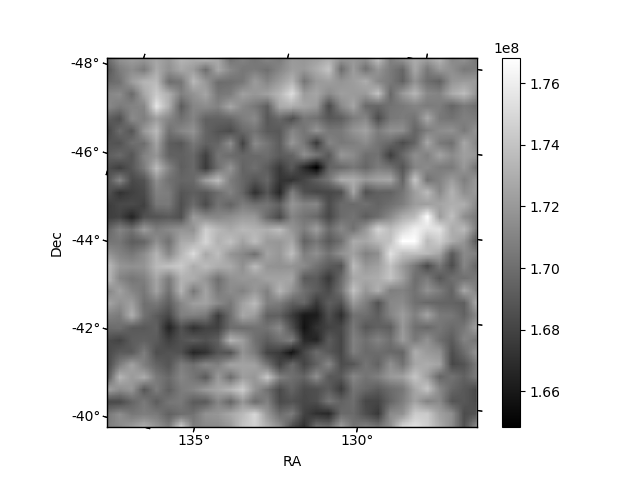
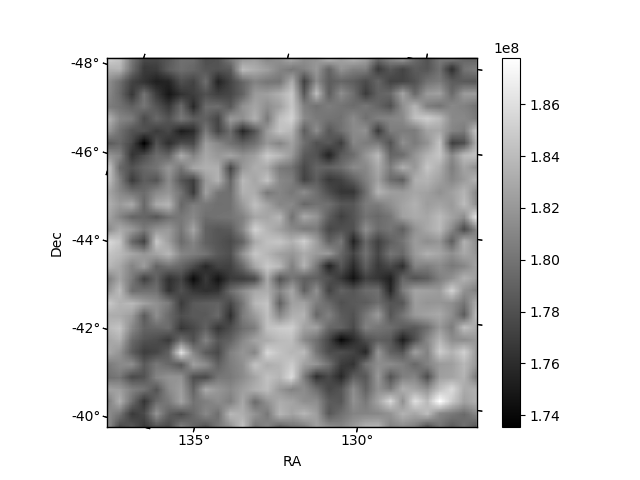
Histogram calculated using DETX and DETY for each event in the final _common_clean file
| Quadrant A | 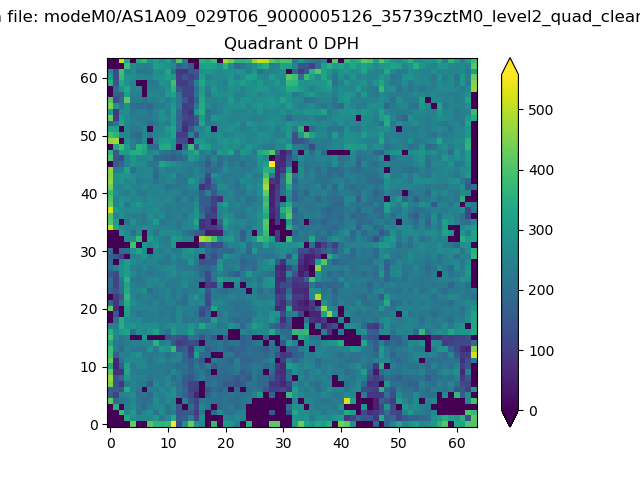 |
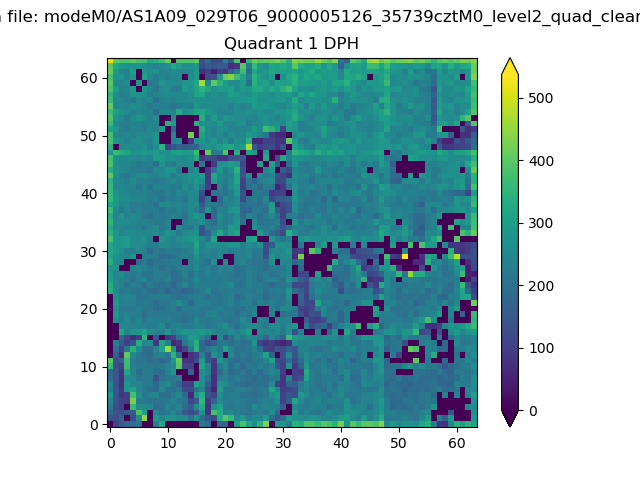 |
Quadrant B |
|---|---|---|---|
| Quadrant D | 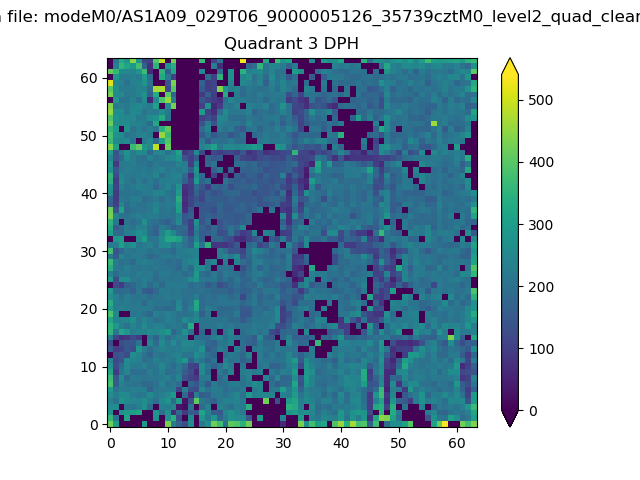 |
 |
Quadrant C |
| Plot type | Count rate plots | Images |
|---|---|---|
| Comparison with Poisson distribution Blue bars denote a histogram of data divided into 1 sec bins. Red curve is a Poisson curve with rate = median count rate of data. |
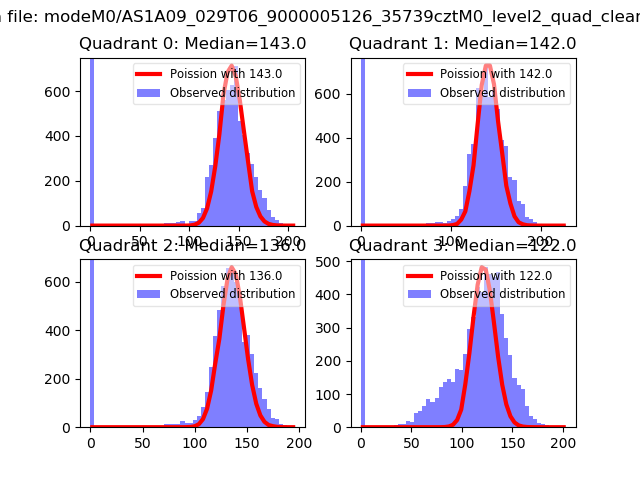 |
 |
| Quadrant-wise count rates Data is divided into 100 sec bins |
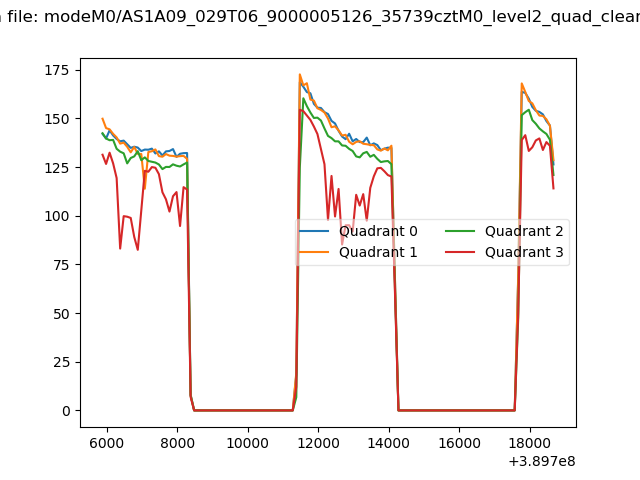 |
|
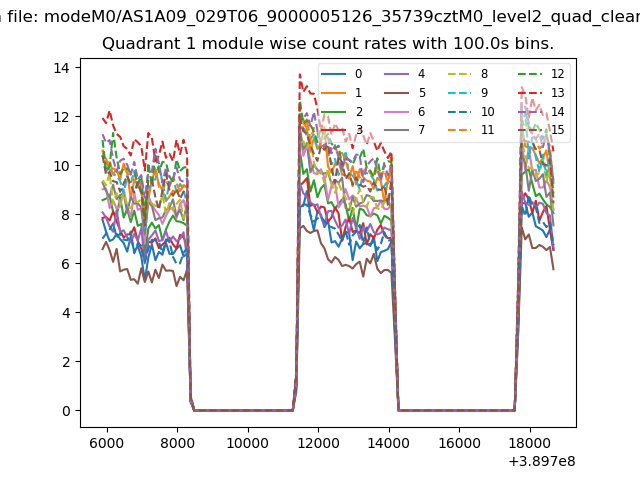
| Module-wise count rates for Quadrant A Data is divided into 100 sec bins |
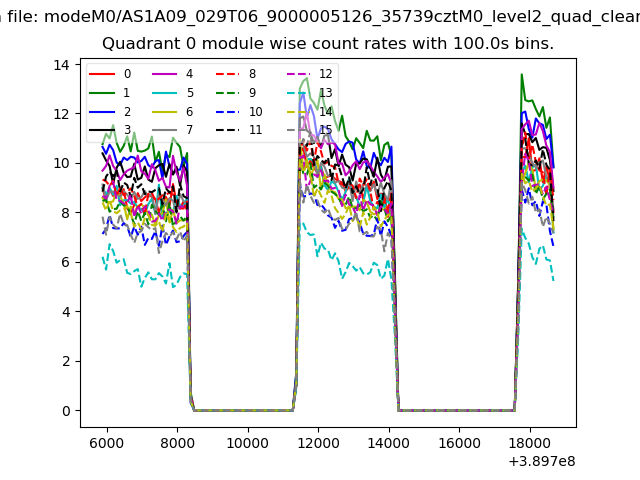 |
 |
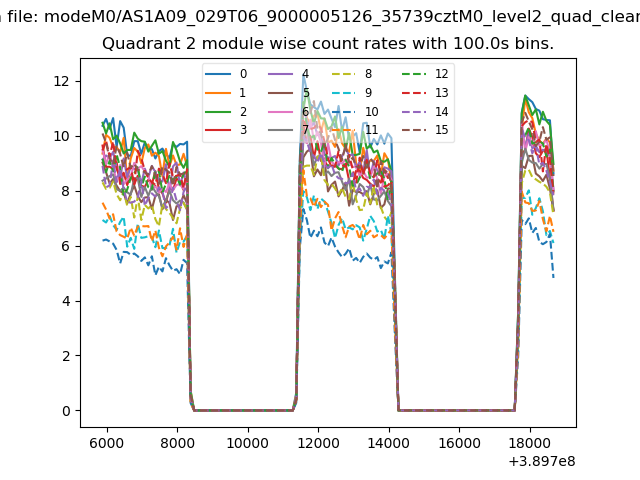
| Module-wise count rates for Quadrant B Data is divided into 100 sec bins |
 |
 |
| Module-wise count rates for Quadrant C Data is divided into 100 sec bins |
 |
 |
| Module-wise count rates for Quadrant D Data is divided into 100 sec bins |
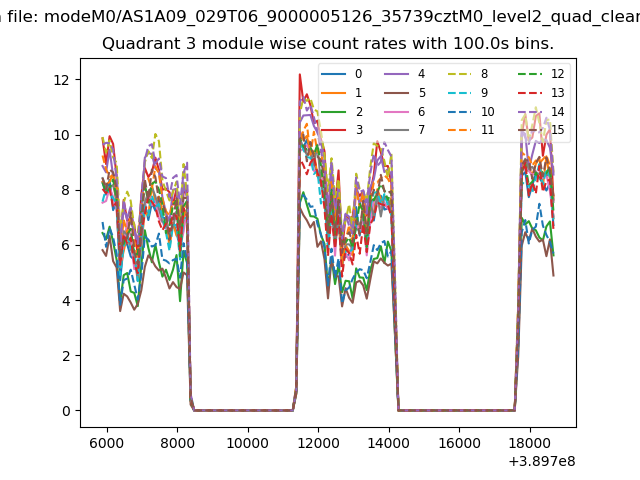 |
 |
| Parameter | Plot |
|---|---|
| CZT HV Monitor | 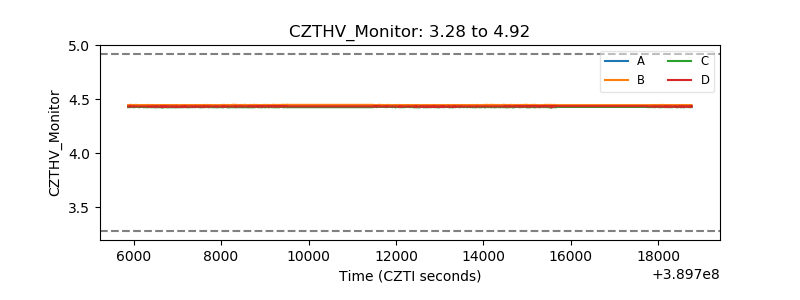 |
| D_VDD | 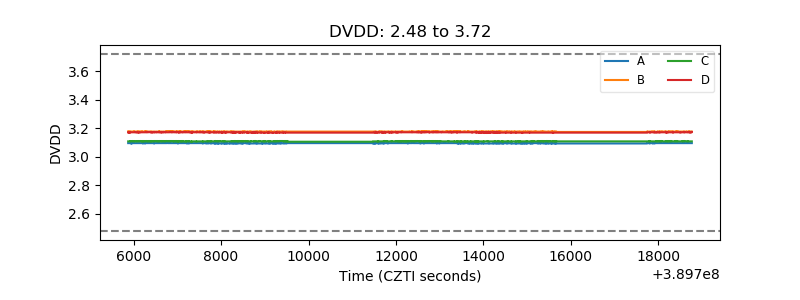 |
| Temperature 1 | 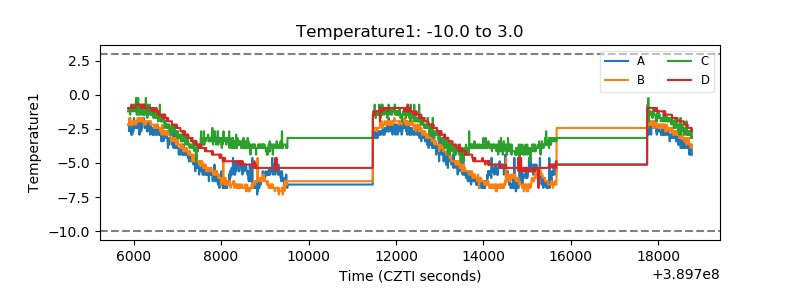 |
| Veto HV Monitor | 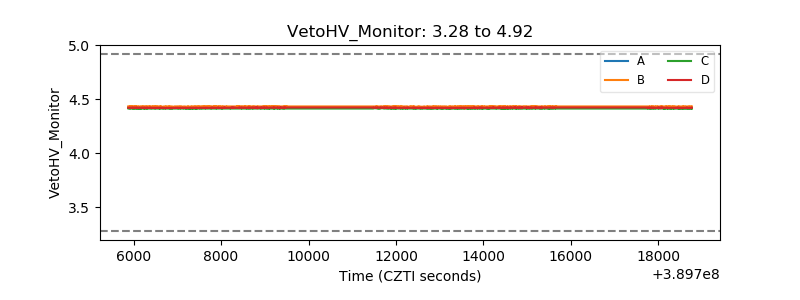 |
| Veto LLD | 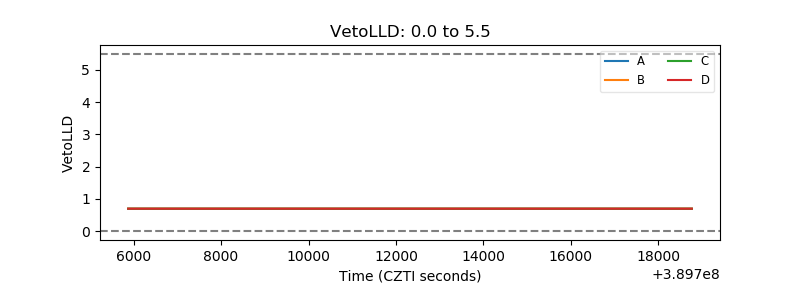 |
| Alpha Counter | 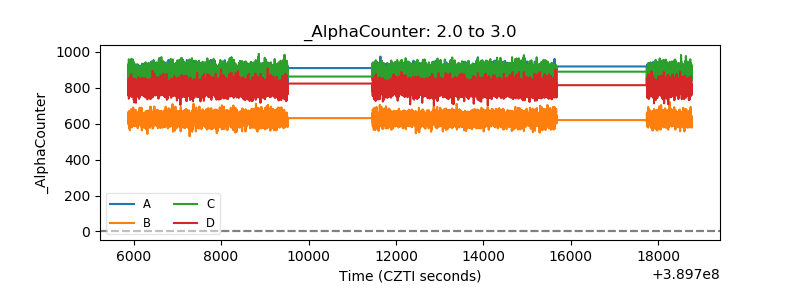 |
| _CPM_Rate | 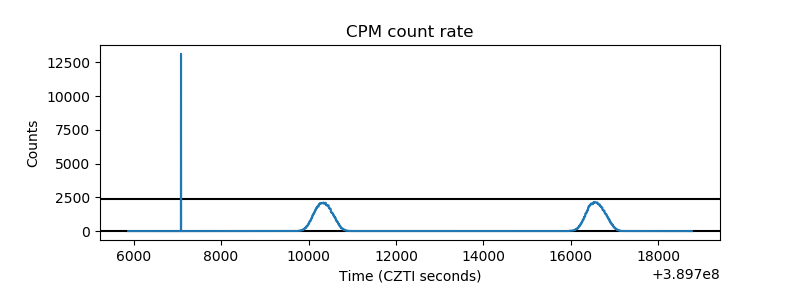 |
| CZT Counter | 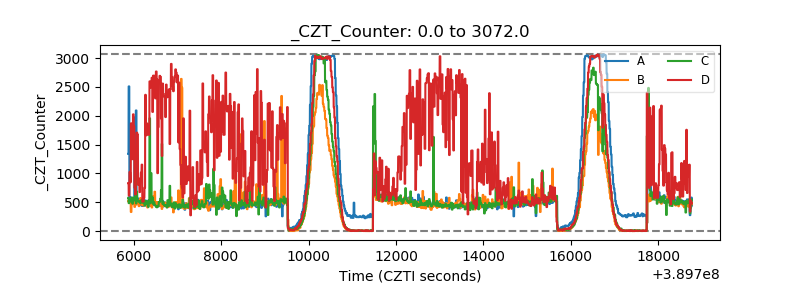 |
| +2.5 Volts monitor | 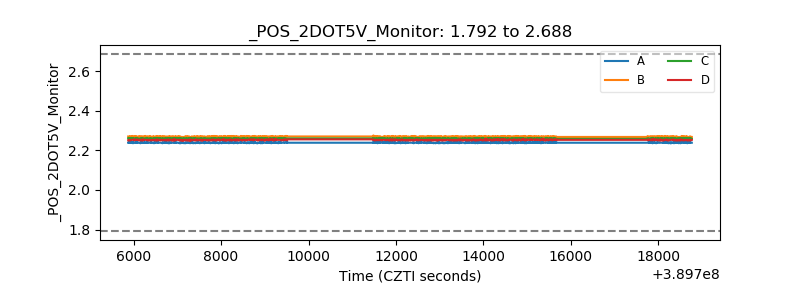 |
| +5 Volts monitor | 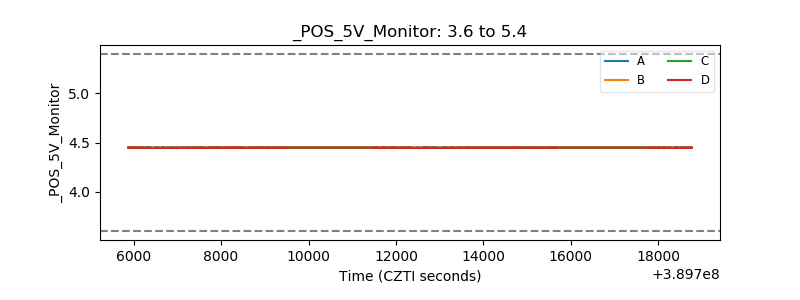 |
| _ROLL_ROT | 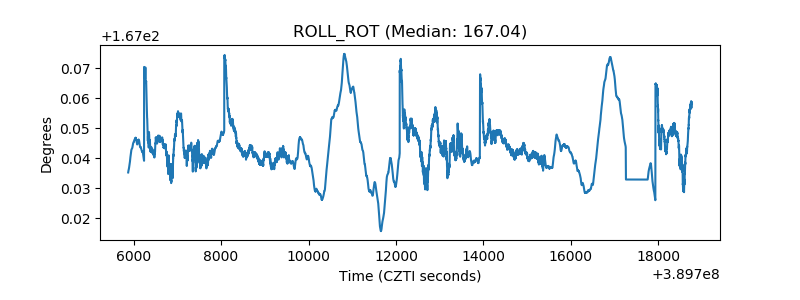 |
| _Roll_DEC | 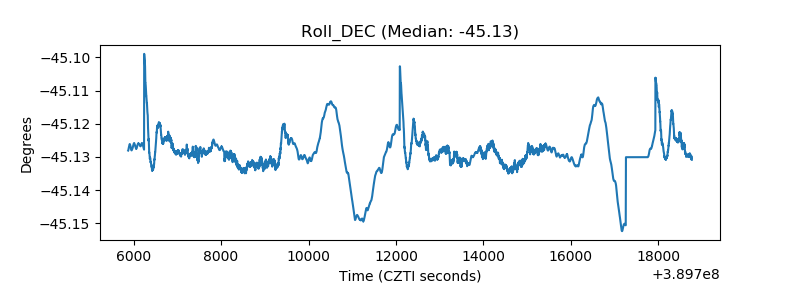 |
| _Roll_RA | 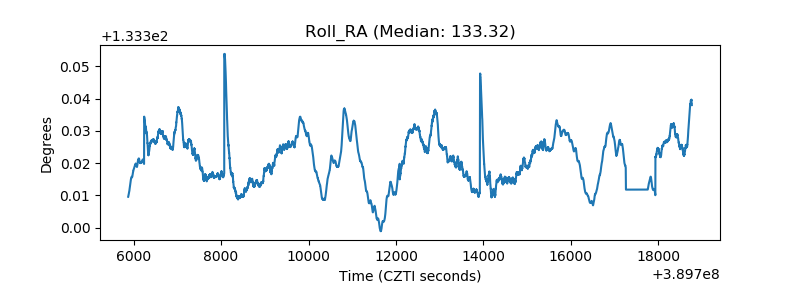 |
| Veto Counter | 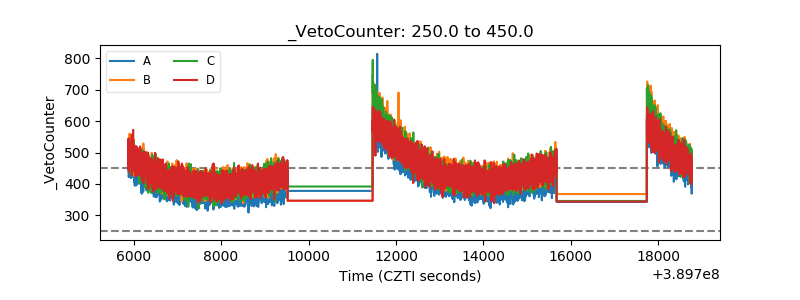 |