| Param | Original file | Final file |
|---|---|---|
| Filename | modeM0/AS1A09_029T06_9000005126_35738cztM0_level2.evt | modeM0/AS1A09_029T06_9000005126_35738cztM0_level2_quad_clean.evt |
| Size (bytes) | 259,300,800 | 34,588,800 |
| Size | 247.3 MB | 33.0 MB |
| Events in quadrant A | 1,330,413 | 226,408 |
| Events in quadrant B | 1,419,231 | 227,052 |
| Events in quadrant C | 1,482,882 | 211,794 |
| Events in quadrant D | 3,443,239 | 195,985 |
| Mode M0 | |||
|---|---|---|---|
| Quadrant | BADHDUFLAG | Total packets | Discarded packets |
| A | 0 | 5928 | 371 |
| B | 0 | 6171 | 398 |
| C | 0 | 6305 | 381 |
| D | 0 | 13240 | 1204 |
| Mode SS | |||
|---|---|---|---|
| Quadrant | BADHDUFLAG | Total packets | Discarded packets |
| A | 0 | 54 | 2 |
| B | 0 | 56 | 4 |
| C | 0 | 54 | 2 |
| D | 0 | 56 | 4 |
| Mode M9 | |||
|---|---|---|---|
| Quadrant | BADHDUFLAG | Total packets | Discarded packets |
| A | 0 | 9 | 0 |
| B | 0 | 9 | 0 |
| C | 0 | 9 | 0 |
| D | 0 | 9 | 0 |
| Quadrant | Total seconds | Saturated seconds | Saturation percentage |
|---|---|---|---|
| A | 2596 | 4 | 0.154083% |
| B | 2598 | 17 | 0.654349% |
| C | 2607 | 57 | 2.186421% |
| D | 2552 | 368 | 14.420063% |
Noise dominated data is calculated using 1-second bins in cleaned event files. If a bin has >2000 counts, and if more than 50% of those come from <1% of pixels, then it is considered to be noise-dominated and hence unusable.
| Quadrant | # 1 sec bins | Bins with >0 counts | Bins with >2000 counts | High rate bins dominated by noise | Noise dominated (total time) | Noise dominated (detector-on time) | Marked lightcurve |
|---|---|---|---|---|---|---|---|
| A | 5143 | 2630 | 0 | 0 | 0.00% | 0.00% | 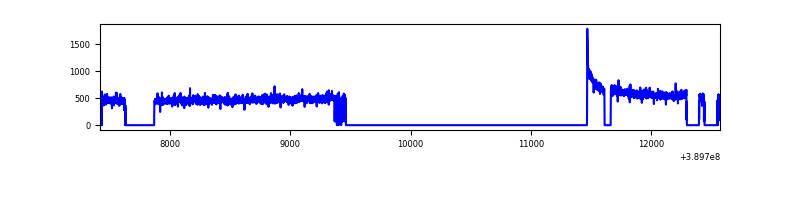 |
| B | 5141 | 2633 | 8 | 8 | 0.16% | 0.30% | 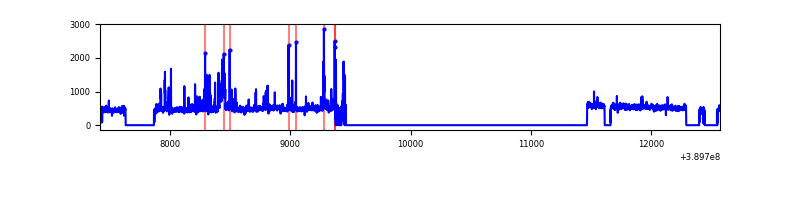 |
| C | 5148 | 2631 | 50 | 50 | 0.97% | 1.90% | 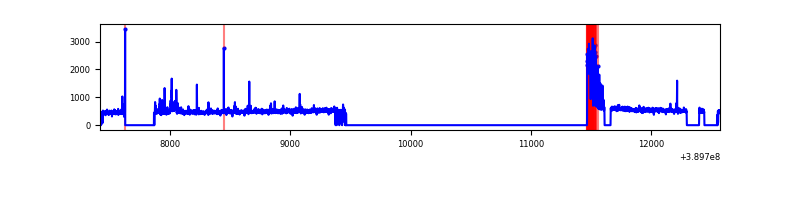 |
| D | 5147 | 2587 | 487 | 487 | 9.46% | 18.82% | 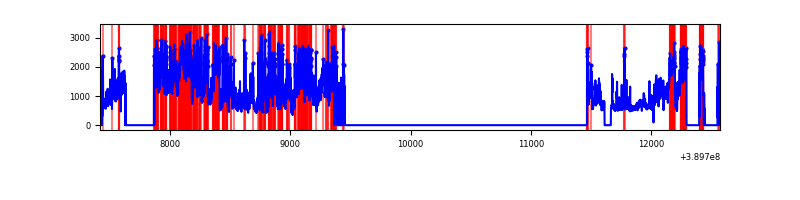 |
Top three noisy pixels from each quadrant. If the there are fewer than three noisy pixels in the level2.evt file, extra rows are filled as -1
| Pixel properties | Quadrant properties | ||||||
|---|---|---|---|---|---|---|---|
| Quadrant | DetID | PixID | Counts | Sigma | Mean | Median | Sigma |
| A | 10 | 83 | 71153 | 1081.14 | 321 | 316 | 65.5 |
| A | 13 | 6 | 5881 | 84.94 | 321 | 316 | 65.5 |
| A | 8 | 144 | 4283 | 60.55 | 321 | 316 | 65.5 |
| B | 5 | 172 | 99603 | 1605.88 | 316 | 309 | 61.8 |
| B | 10 | 245 | 34894 | 559.34 | 316 | 309 | 61.8 |
| B | 5 | 255 | 20886 | 332.79 | 316 | 309 | 61.8 |
| C | 0 | 10 | 143893 | 2031.53 | 301 | 302 | 70.7 |
| C | 15 | 214 | 109528 | 1545.33 | 301 | 302 | 70.7 |
| C | 15 | 208 | 34459 | 483.25 | 301 | 302 | 70.7 |
| D | 1 | 52 | 1595432 | 21897.57 | 292 | 284 | 72.8 |
| D | 14 | 52 | 453953 | 6227.79 | 292 | 284 | 72.8 |
| D | 12 | 17 | 114185 | 1563.59 | 292 | 284 | 72.8 |
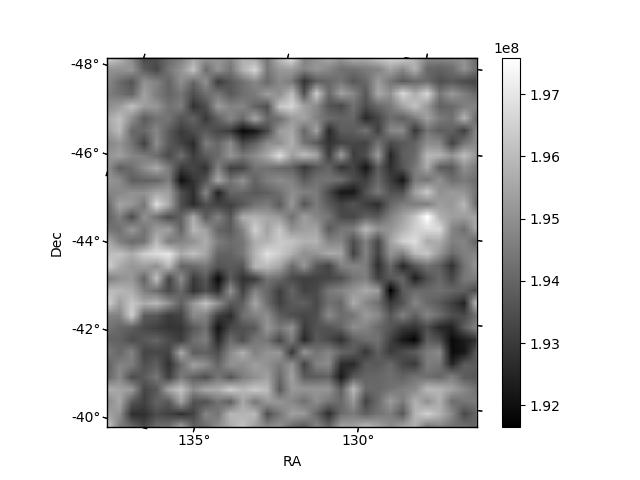
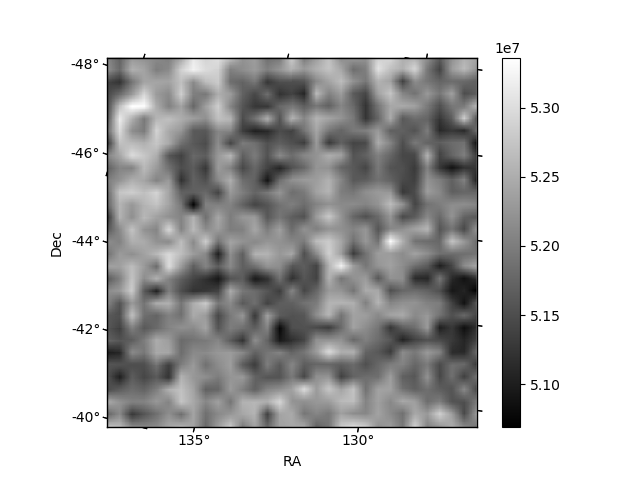
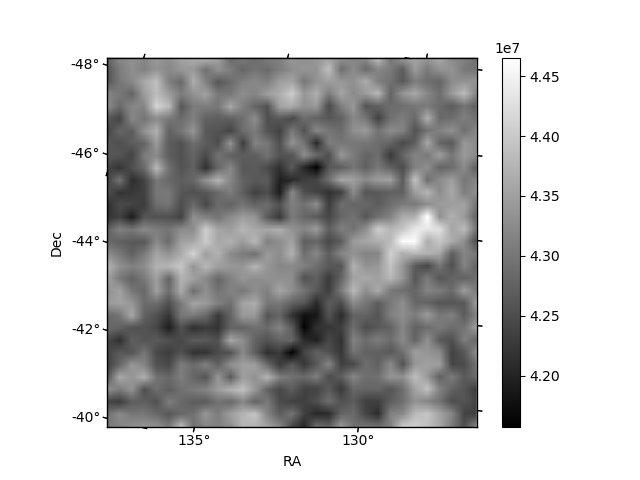
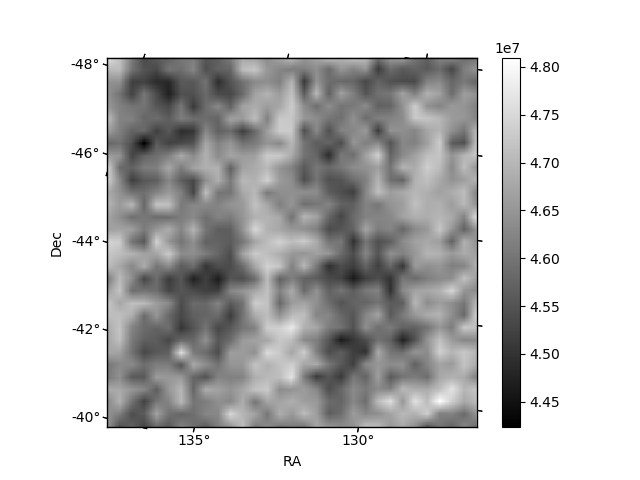
Histogram calculated using DETX and DETY for each event in the final _common_clean file
| Quadrant A | 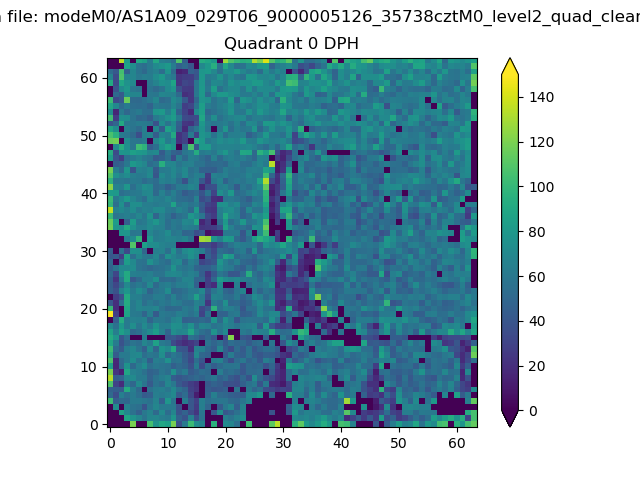 |
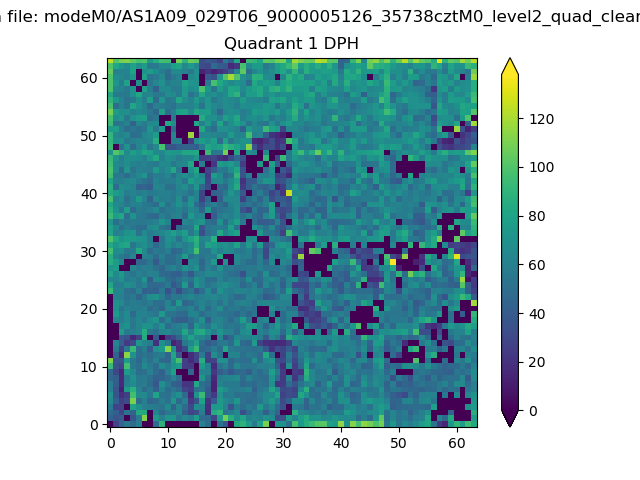 |
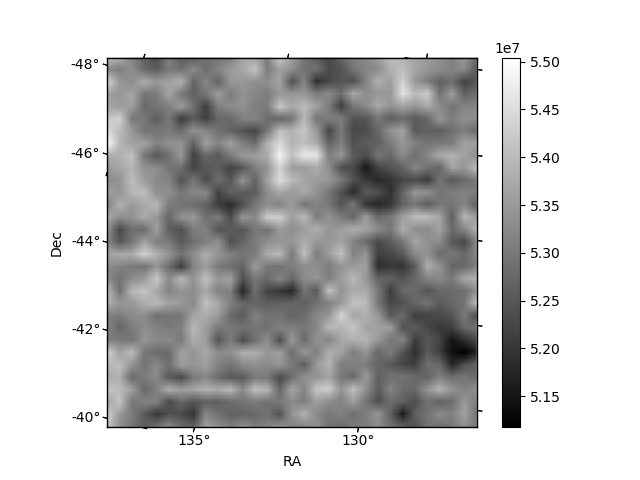
Quadrant B |
|---|---|---|---|
| Quadrant D | 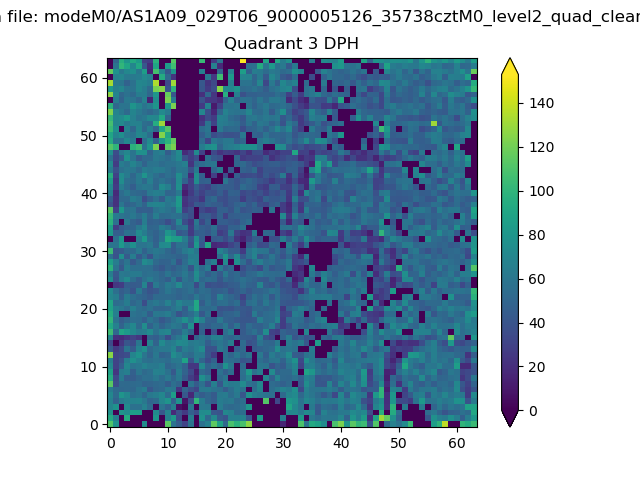 |
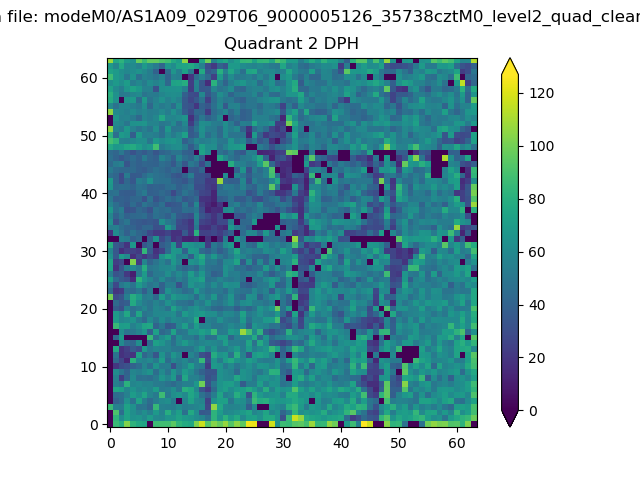 |
Quadrant C |
| Plot type | Count rate plots | Images |
|---|---|---|
| Comparison with Poisson distribution Blue bars denote a histogram of data divided into 1 sec bins. Red curve is a Poisson curve with rate = median count rate of data. |
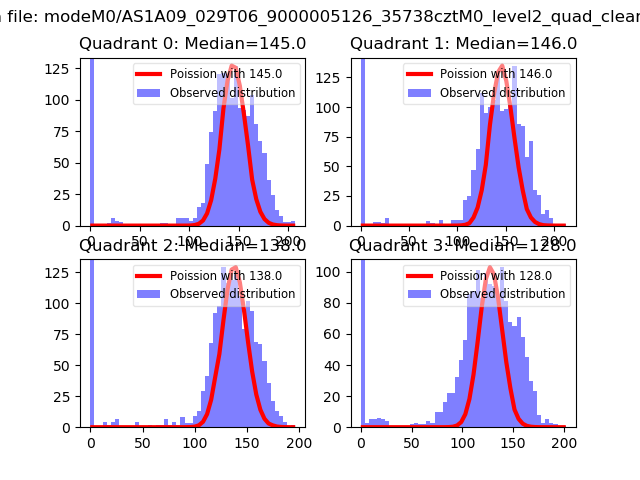 |
 |
| Quadrant-wise count rates Data is divided into 100 sec bins |
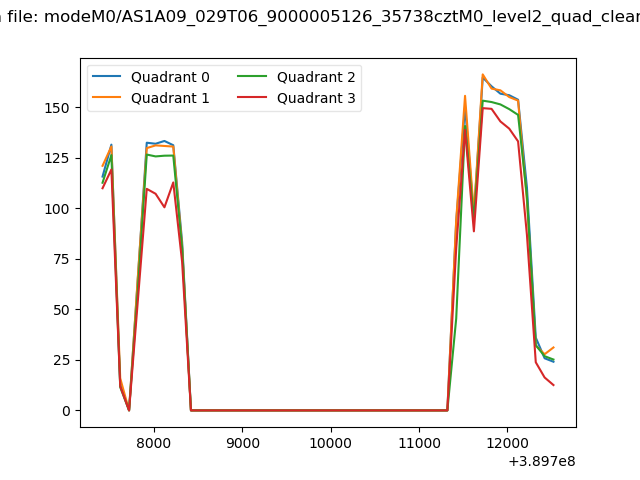 |
|
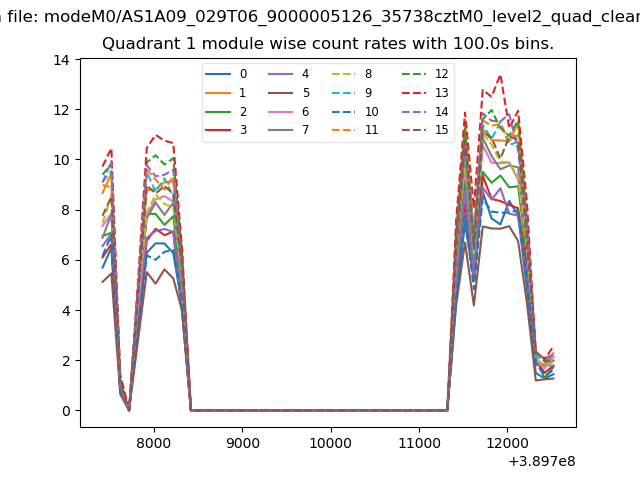
| Module-wise count rates for Quadrant A Data is divided into 100 sec bins |
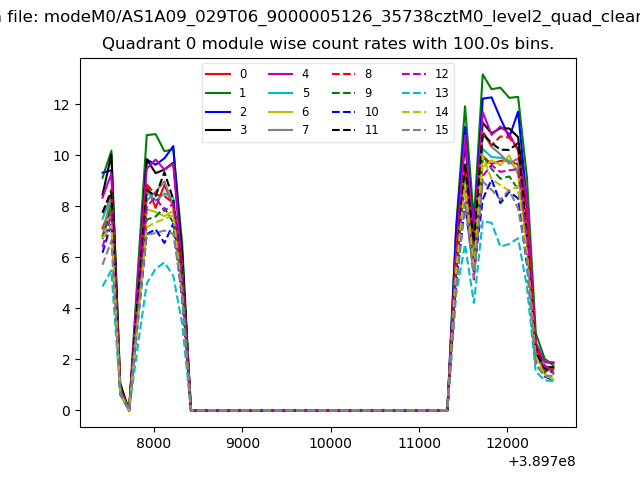 |
 |
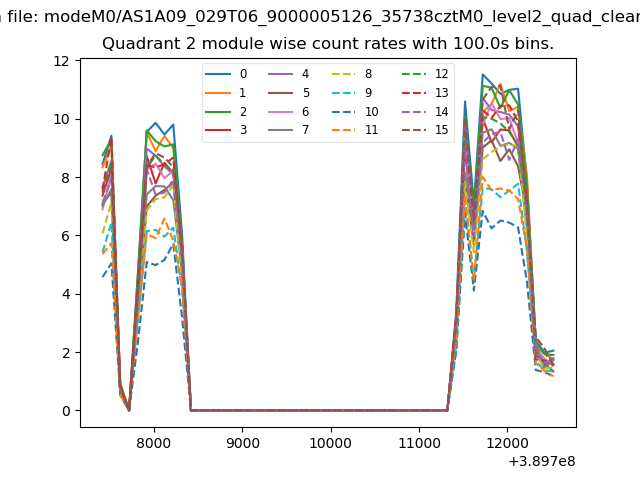
| Module-wise count rates for Quadrant B Data is divided into 100 sec bins |
 |
 |
| Module-wise count rates for Quadrant C Data is divided into 100 sec bins |
 |
 |
| Module-wise count rates for Quadrant D Data is divided into 100 sec bins |
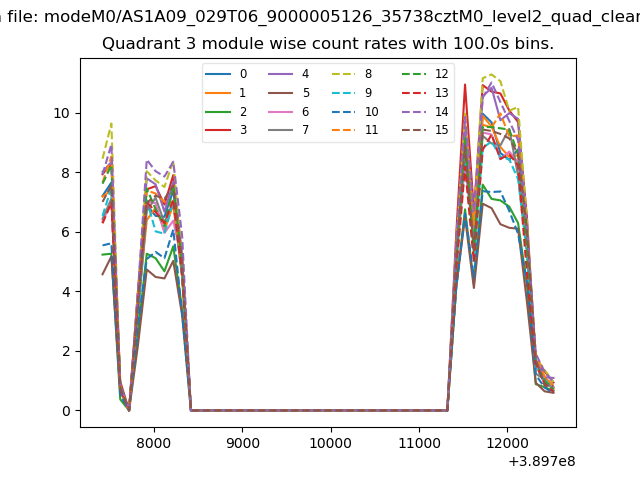 |
 |
| Parameter | Plot |
|---|---|
| CZT HV Monitor | 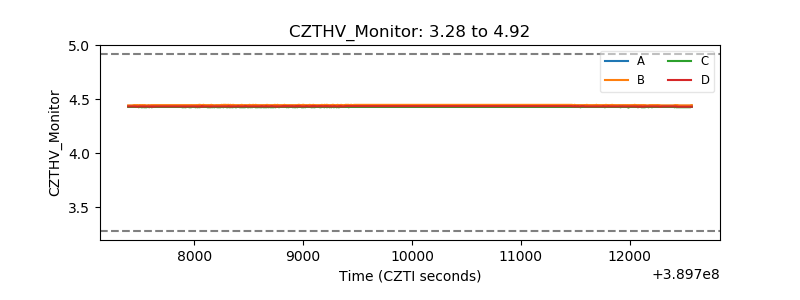 |
| D_VDD | 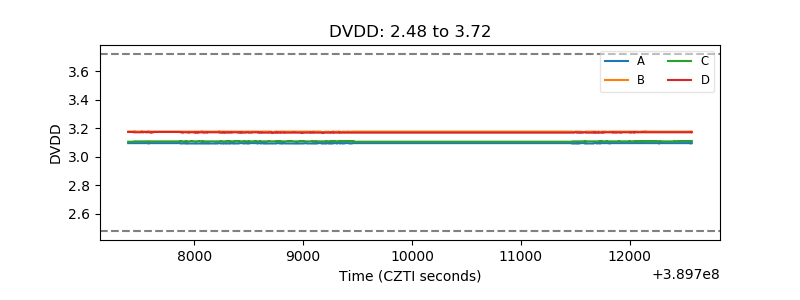 |
| Temperature 1 | 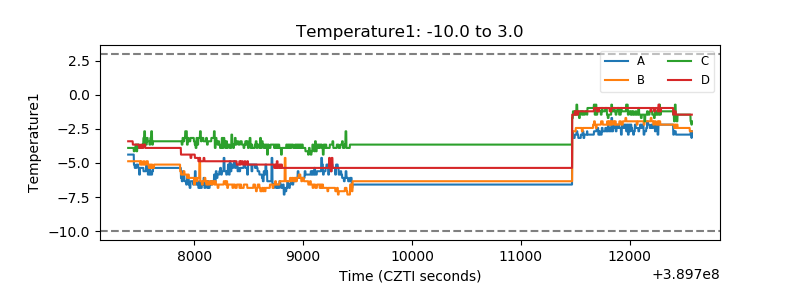 |
| Veto HV Monitor | 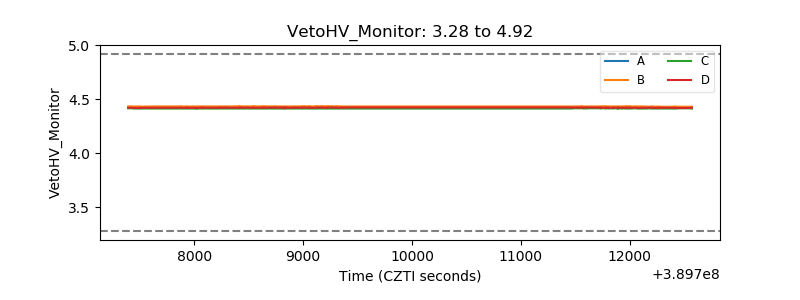 |
| Veto LLD | 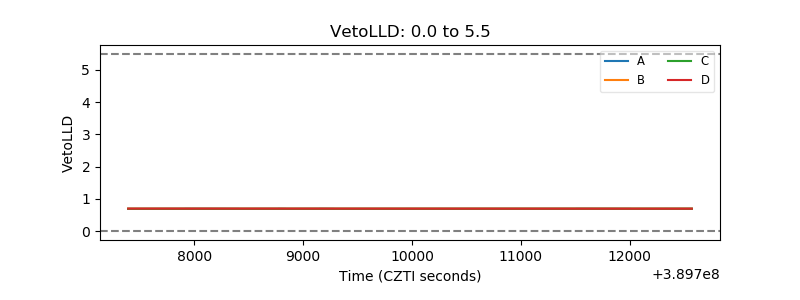 |
| Alpha Counter | 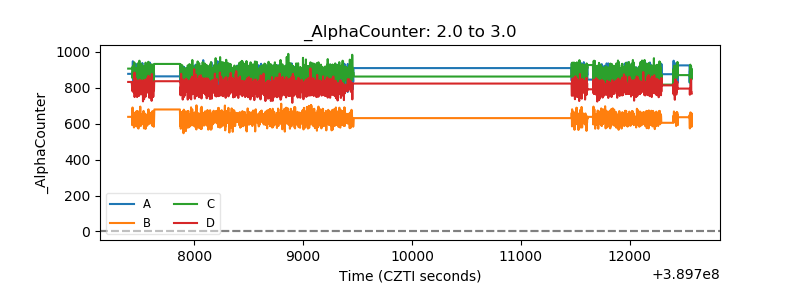 |
| _CPM_Rate | 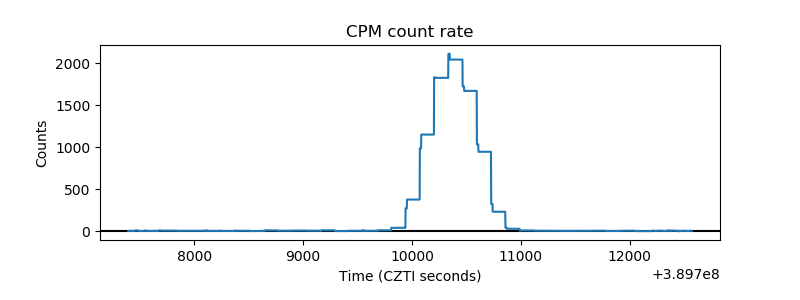 |
| CZT Counter | 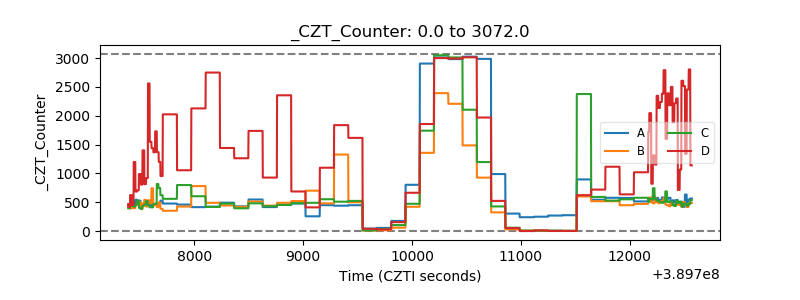 |
| +2.5 Volts monitor | 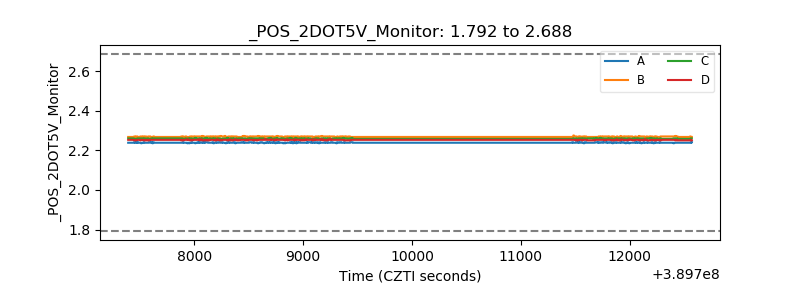 |
| +5 Volts monitor | 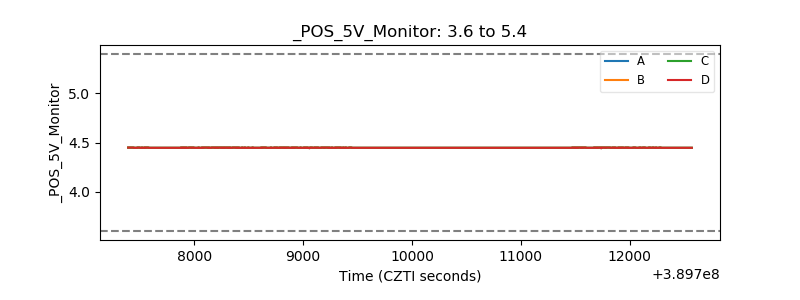 |
| _ROLL_ROT | 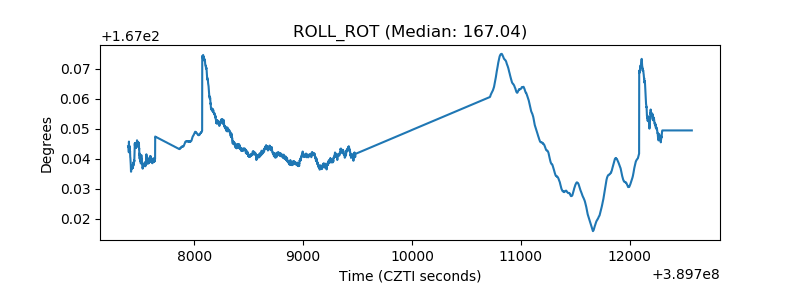 |
| _Roll_DEC | 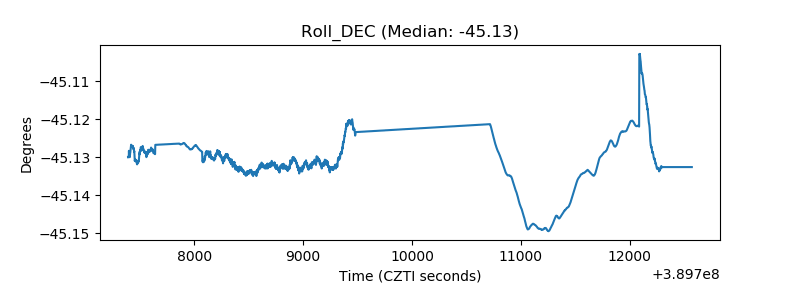 |
| _Roll_RA | 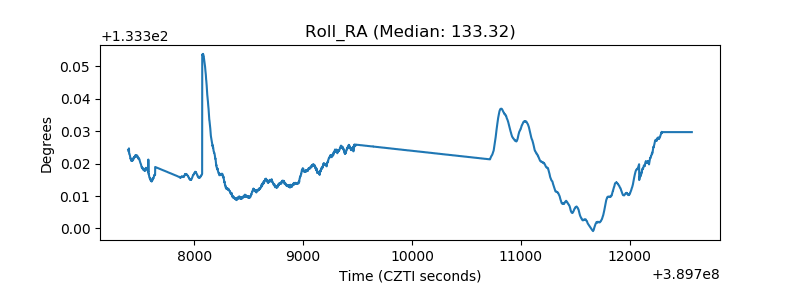 |
| Veto Counter | 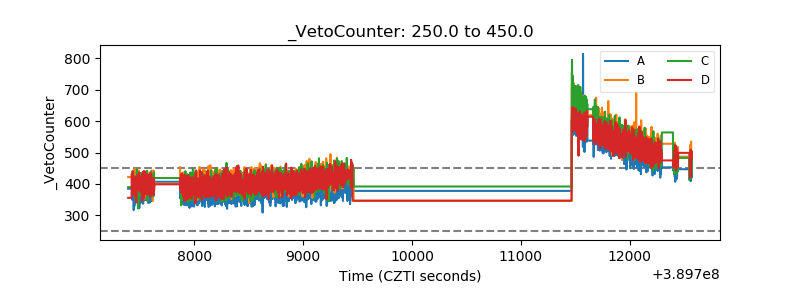 |