| Param | Original file | Final file |
|---|---|---|
| Filename | modeM0/AS1A09_029T06_9000005126_35735cztM0_level2.evt | modeM0/AS1A09_029T06_9000005126_35735cztM0_level2_quad_clean.evt |
| Size (bytes) | 459,028,800 | 90,797,760 |
| Size | 437.8 MB | 86.6 MB |
| Events in quadrant A | 4,826,973 | 571,755 |
| Events in quadrant B | 2,921,301 | 614,721 |
| Events in quadrant C | 2,922,655 | 601,422 |
| Events in quadrant D | 2,861,628 | 581,266 |
| Mode M0 | |||
|---|---|---|---|
| Quadrant | BADHDUFLAG | Total packets | Discarded packets |
| A | 0 | 18016 | 3 |
| B | 0 | 12255 | 2 |
| C | 0 | 12026 | 2 |
| D | 0 | 12025 | 2 |
| Mode SS | |||
|---|---|---|---|
| Quadrant | BADHDUFLAG | Total packets | Discarded packets |
| A | 0 | 110 | 0 |
| B | 0 | 110 | 0 |
| C | 0 | 110 | 0 |
| D | 0 | 110 | 0 |
| Mode M9 | |||
|---|---|---|---|
| Quadrant | BADHDUFLAG | Total packets | Discarded packets |
| A | 0 | 23 | 0 |
| B | 0 | 23 | 0 |
| C | 0 | 23 | 0 |
| D | 0 | 24 | 0 |
| Quadrant | Total seconds | Saturated seconds | Saturation percentage |
|---|---|---|---|
| A | 5435 | 769 | 14.149034% |
| B | 5435 | 89 | 1.637534% |
| C | 5435 | 75 | 1.379945% |
| D | 5435 | 17 | 0.312787% |
Noise dominated data is calculated using 1-second bins in cleaned event files. If a bin has >2000 counts, and if more than 50% of those come from <1% of pixels, then it is considered to be noise-dominated and hence unusable.
| Quadrant | # 1 sec bins | Bins with >0 counts | Bins with >2000 counts | High rate bins dominated by noise | Noise dominated (total time) | Noise dominated (detector-on time) | Marked lightcurve |
|---|---|---|---|---|---|---|---|
| A | 7138 | 5435 | 663 | 663 | 9.29% | 12.20% |  |
| B | 7138 | 5436 | 62 | 62 | 0.87% | 1.14% | 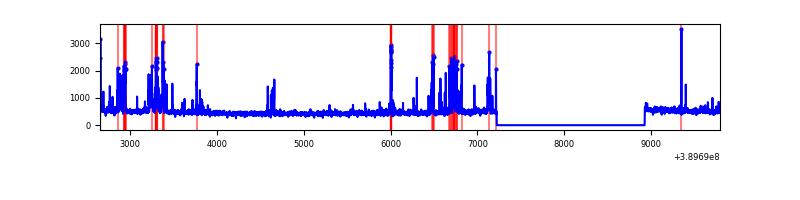 |
| C | 7138 | 5436 | 59 | 59 | 0.83% | 1.09% | 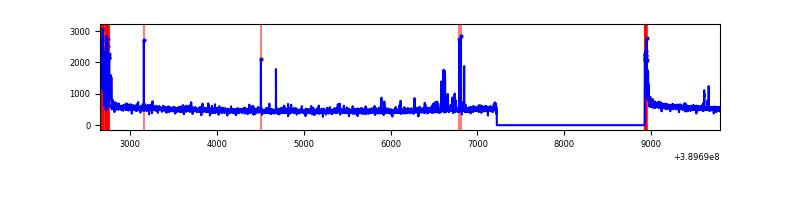 |
| D | 7138 | 5436 | 13 | 13 | 0.18% | 0.24% | 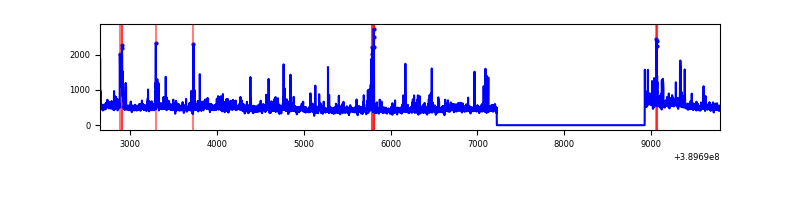 |
Top three noisy pixels from each quadrant. If the there are fewer than three noisy pixels in the level2.evt file, extra rows are filled as -1
| Pixel properties | Quadrant properties | ||||||
|---|---|---|---|---|---|---|---|
| Quadrant | DetID | PixID | Counts | Sigma | Mean | Median | Sigma |
| A | 15 | 169 | 2306724 | 18749.54 | 609 | 597 | 123.0 |
| A | 10 | 83 | 142211 | 1151.37 | 609 | 597 | 123.0 |
| A | 13 | 6 | 15080 | 117.75 | 609 | 597 | 123.0 |
| B | 5 | 172 | 383141 | 3142.49 | 630 | 613 | 121.7 |
| B | 5 | 255 | 35868 | 289.62 | 630 | 613 | 121.7 |
| B | 12 | 111 | 14919 | 117.52 | 630 | 613 | 121.7 |
| C | 15 | 214 | 230006 | 1603.63 | 615 | 621 | 143.0 |
| C | 0 | 10 | 206653 | 1440.37 | 615 | 621 | 143.0 |
| C | 15 | 208 | 49772 | 343.61 | 615 | 621 | 143.0 |
| D | 1 | 52 | 118595 | 770.96 | 624 | 607 | 153.0 |
| D | 13 | 249 | 99926 | 648.97 | 624 | 607 | 153.0 |
| D | 14 | 52 | 71702 | 464.55 | 624 | 607 | 153.0 |
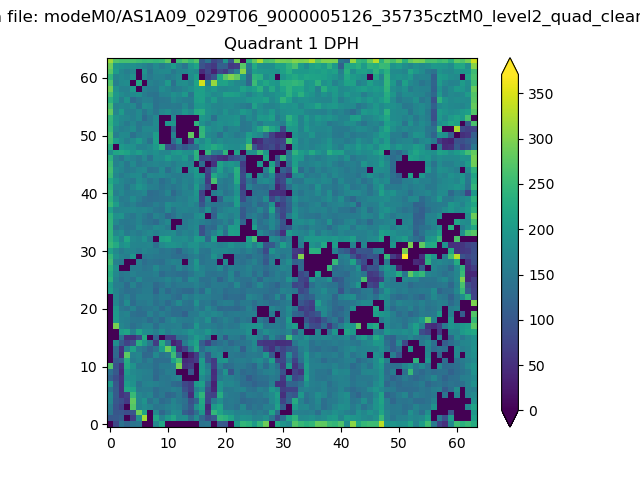
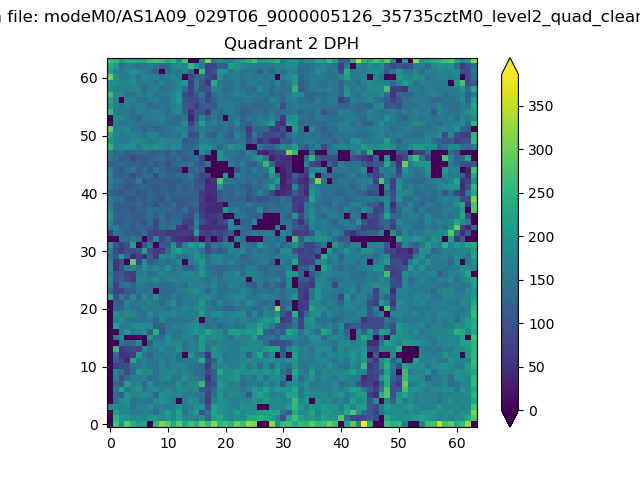
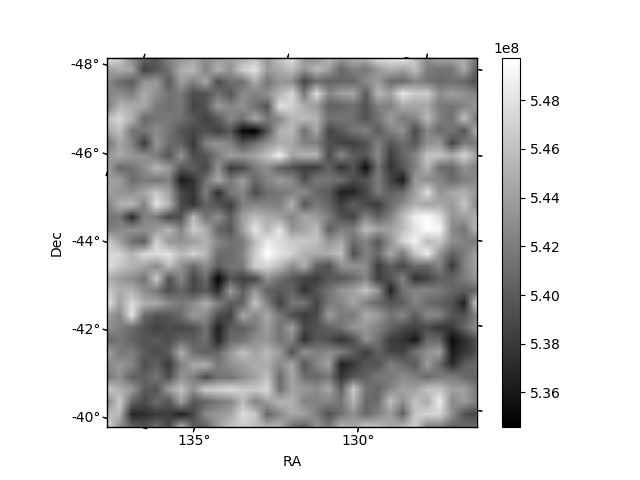
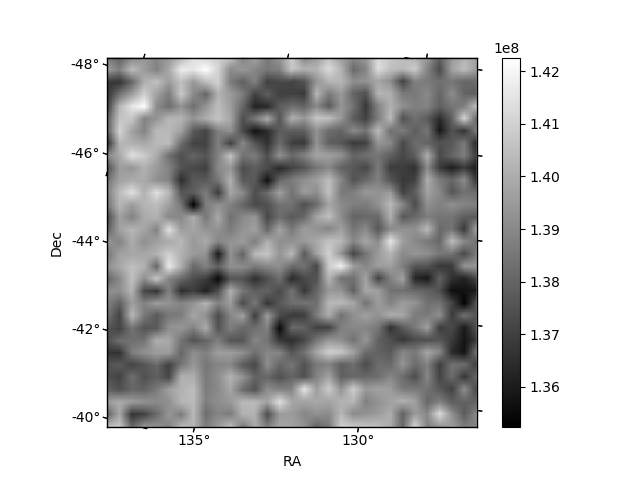
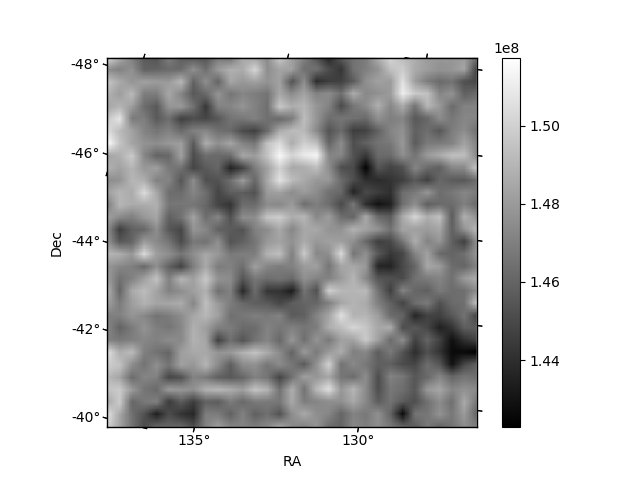
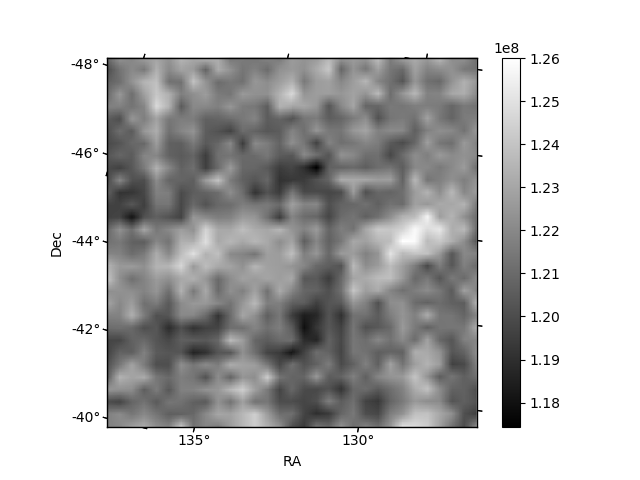
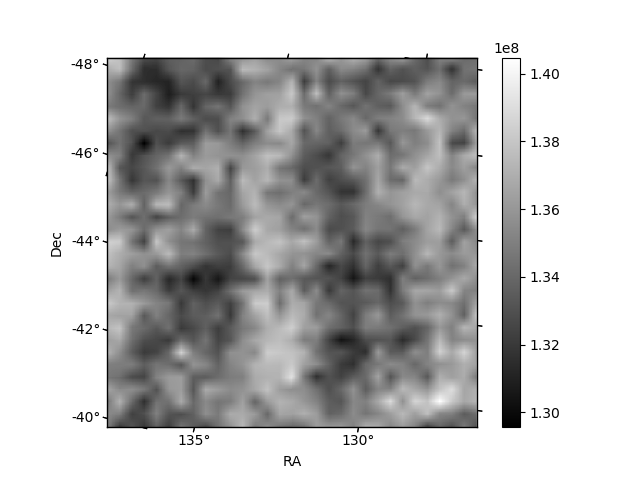
Histogram calculated using DETX and DETY for each event in the final _common_clean file
| Quadrant A | 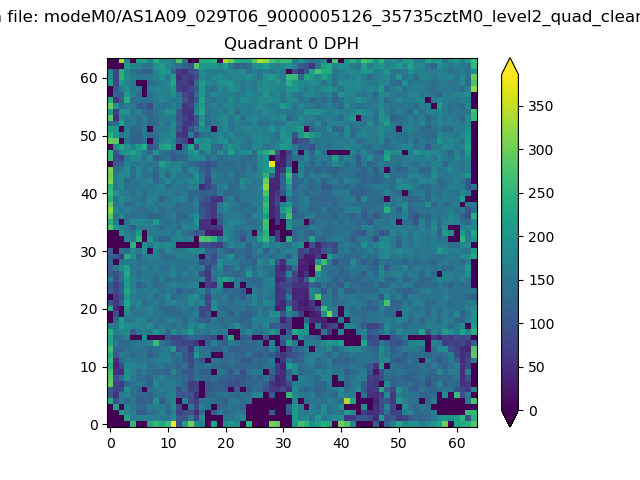 |
 |
Quadrant B |
|---|---|---|---|
| Quadrant D | 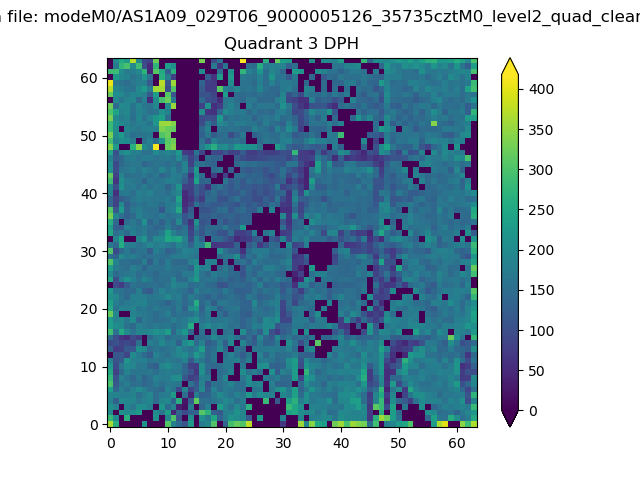 |
 |
Quadrant C |
| Plot type | Count rate plots | Images |
|---|---|---|
| Comparison with Poisson distribution Blue bars denote a histogram of data divided into 1 sec bins. Red curve is a Poisson curve with rate = median count rate of data. |
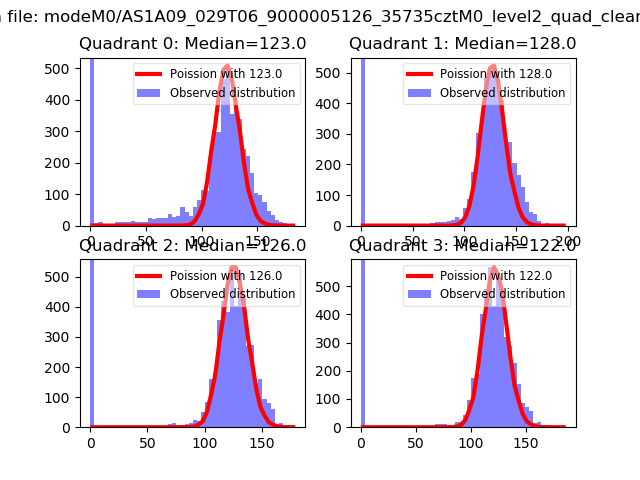 |
 |
| Quadrant-wise count rates Data is divided into 100 sec bins |
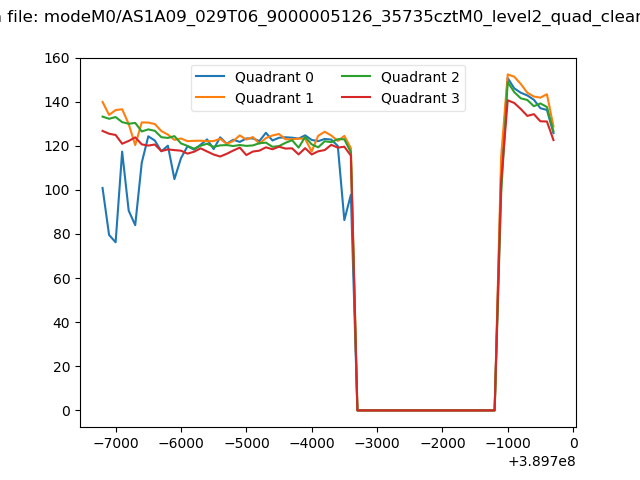 |
|
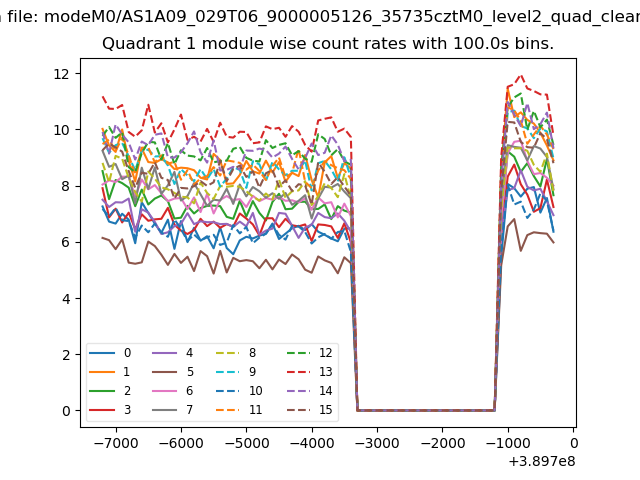
| Module-wise count rates for Quadrant A Data is divided into 100 sec bins |
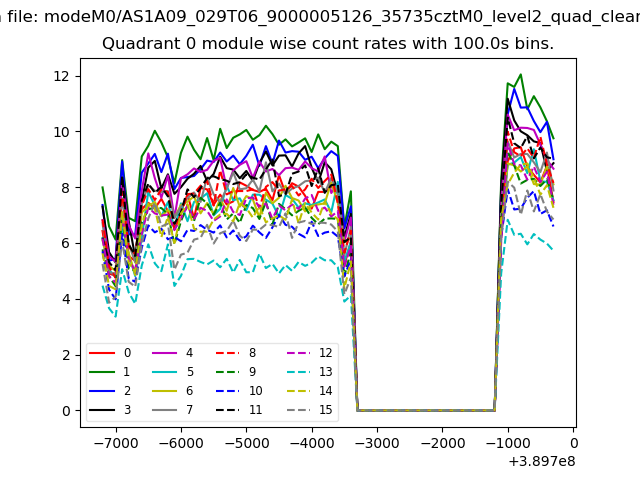 |
 |
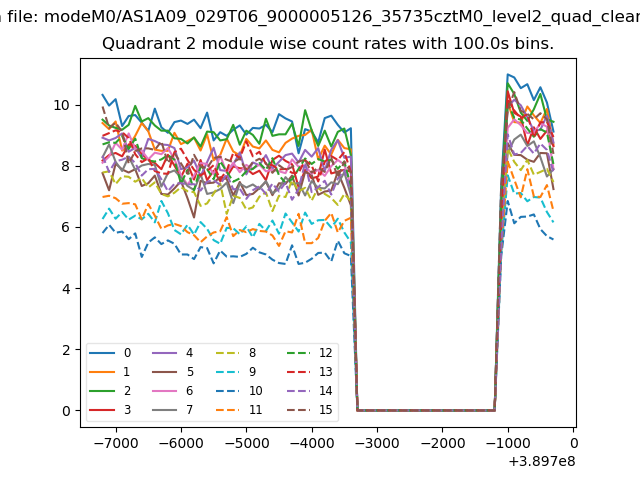
| Module-wise count rates for Quadrant B Data is divided into 100 sec bins |
 |
 |
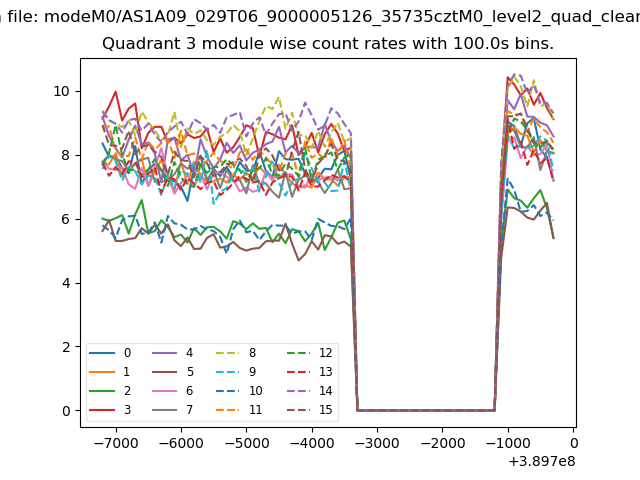
| Module-wise count rates for Quadrant C Data is divided into 100 sec bins |
 |
 |
| Module-wise count rates for Quadrant D Data is divided into 100 sec bins |
 |
 |
| Parameter | Plot |
|---|---|
| CZT HV Monitor | 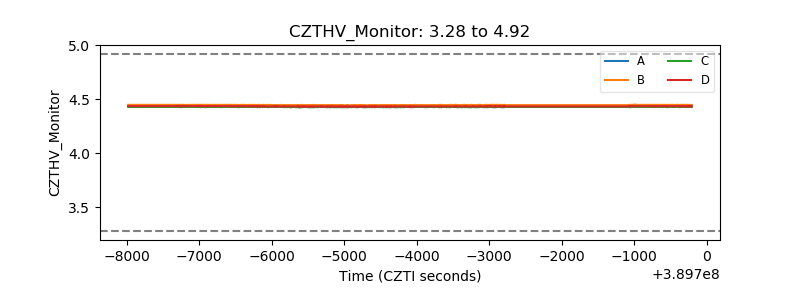 |
| D_VDD | 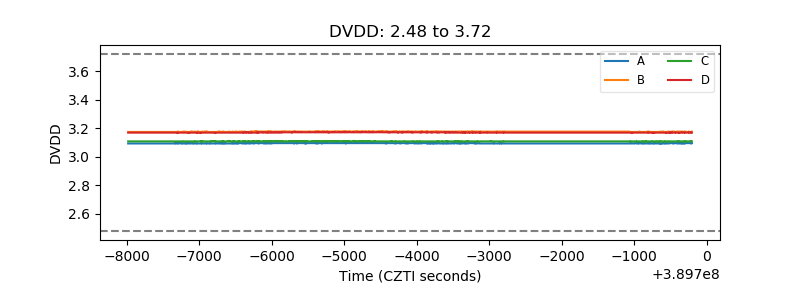 |
| Temperature 1 | 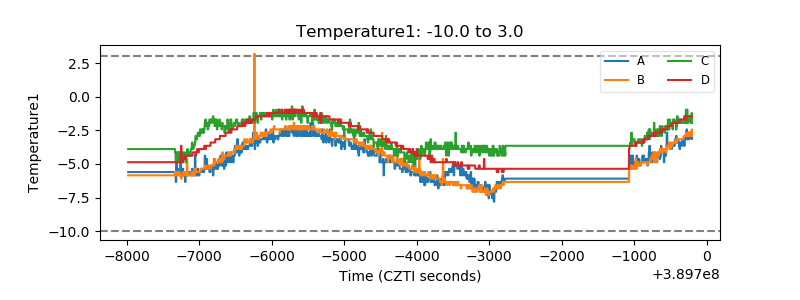 |
| Veto HV Monitor | 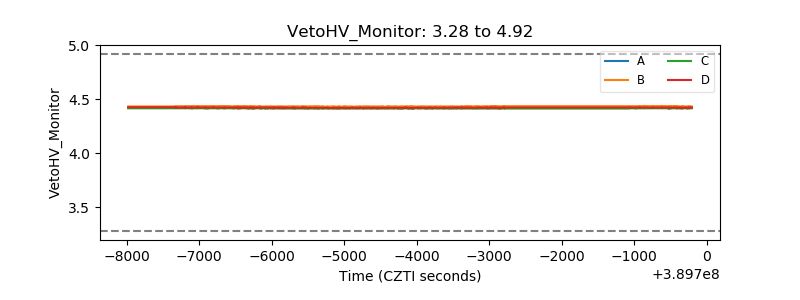 |
| Veto LLD | 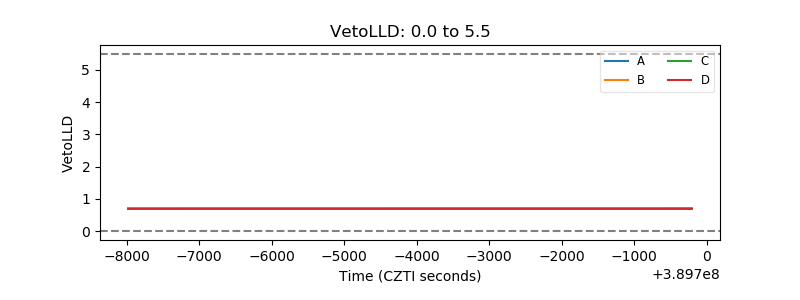 |
| Alpha Counter | 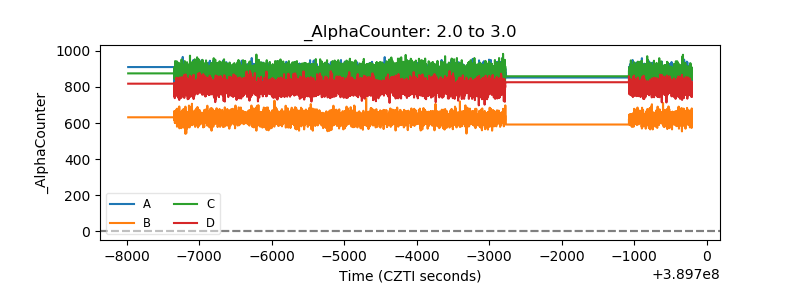 |
| _CPM_Rate | 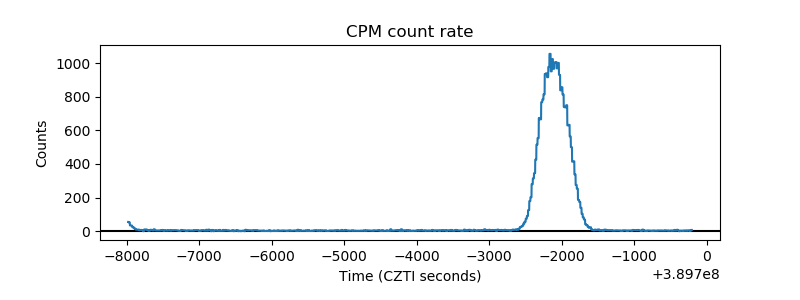 |
| CZT Counter | 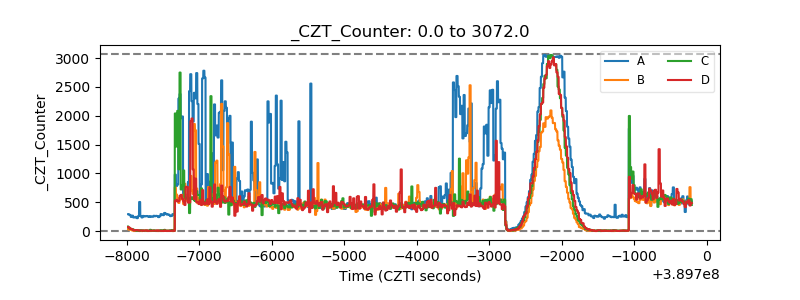 |
| +2.5 Volts monitor | 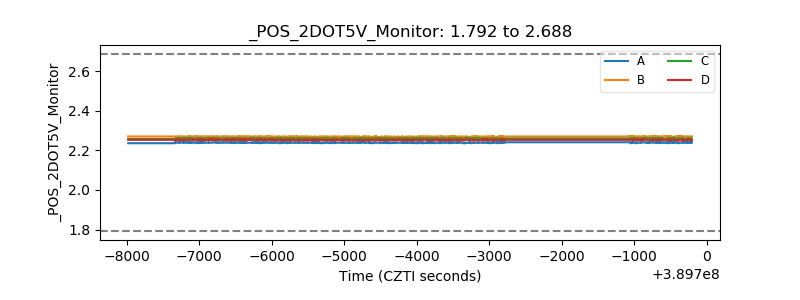 |
| +5 Volts monitor | 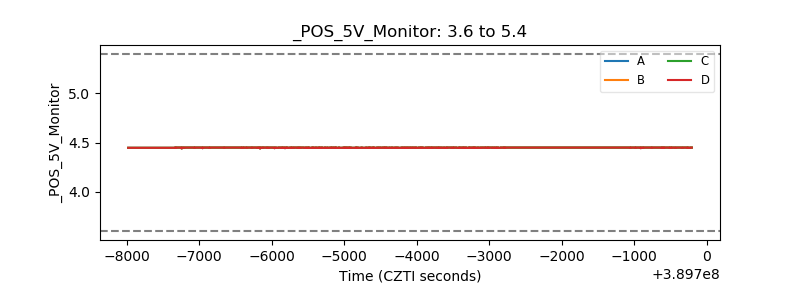 |
| _ROLL_ROT | 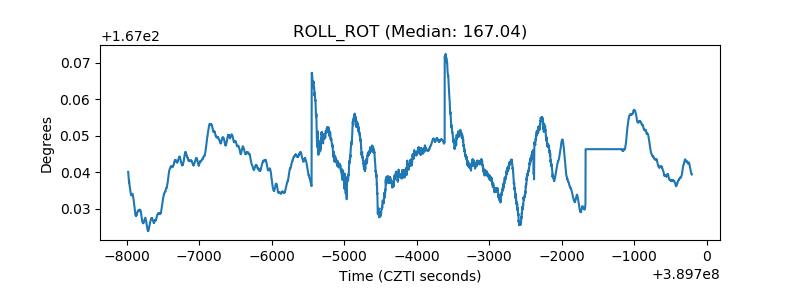 |
| _Roll_DEC | 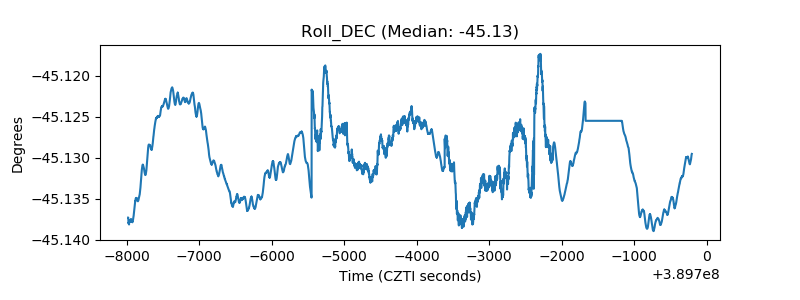 |
| _Roll_RA | 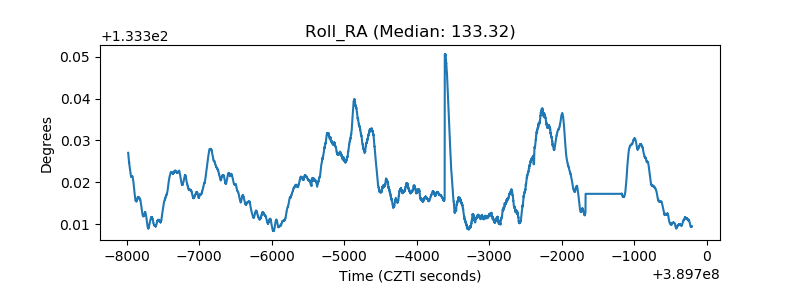 |
| Veto Counter | 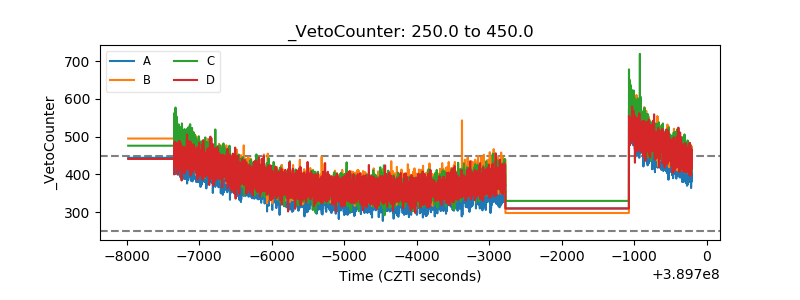 |