| Param | Original file | Final file |
|---|---|---|
| Filename | modeM0/AS1A09_029T06_9000005126cztM0_level2_bc.evt | modeM0/AS1A09_029T06_9000005126cztM0_level2_quad_clean.evt |
| Size (bytes) | 1,452,156,480 | 422,202,240 |
| Size | 1.4 GB | 402.6 MB |
| Events in quadrant A | 9,366,855 | 2,766,106 |
| Events in quadrant B | 7,633,638 | 2,826,846 |
| Events in quadrant C | 8,388,626 | 2,727,132 |
| Events in quadrant D | 16,689,145 | 2,550,006 |
| Mode M0 | |||
|---|---|---|---|
| Quadrant | BADHDUFLAG | Total packets | Discarded packets |
| A | 0 | 70185 | 0 |
| B | 0 | 63256 | 0 |
| C | 0 | 62909 | 0 |
| D | 0 | 90604 | 0 |
| Mode SS | |||
|---|---|---|---|
| Quadrant | BADHDUFLAG | Total packets | Discarded packets |
| A | 0 | 574 | 0 |
| B | 0 | 574 | 0 |
| C | 0 | 574 | 0 |
| D | 0 | 574 | 0 |
| Mode M9 | |||
|---|---|---|---|
| Quadrant | BADHDUFLAG | Total packets | Discarded packets |
| A | 0 | 126 | 0 |
| B | 0 | 126 | 0 |
| C | 0 | 126 | 0 |
| D | 0 | 126 | 0 |
| Quadrant | Total seconds | Saturated seconds | Saturation percentage |
|---|---|---|---|
| A | 27886 | 1387 | 4.973822% |
| B | 27886 | 511 | 1.832461% |
| C | 27886 | 456 | 1.635229% |
| D | 27886 | 2151 | 7.713548% |
Noise dominated data is calculated using 1-second bins in cleaned event files. If a bin has >2000 counts, and if more than 50% of those come from <1% of pixels, then it is considered to be noise-dominated and hence unusable.
| Quadrant | # 1 sec bins | Bins with >0 counts | Bins with >2000 counts | High rate bins dominated by noise | Noise dominated (total time) | Noise dominated (detector-on time) | Marked lightcurve |
|---|---|---|---|---|---|---|---|
| A | 40527 | 27888 | 146 | 146 | 0.36% | 0.52% | 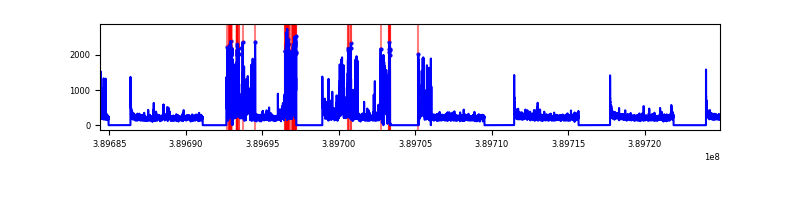 |
| B | 40527 | 27887 | 20 | 20 | 0.05% | 0.07% | 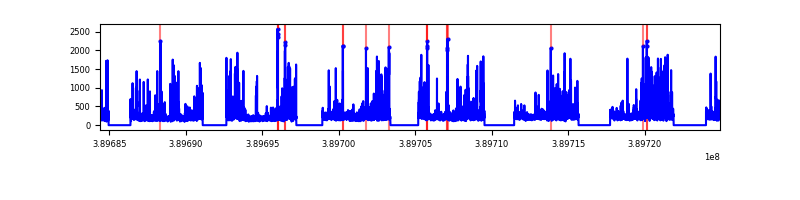 |
| C | 40527 | 27886 | 95 | 95 | 0.23% | 0.34% | 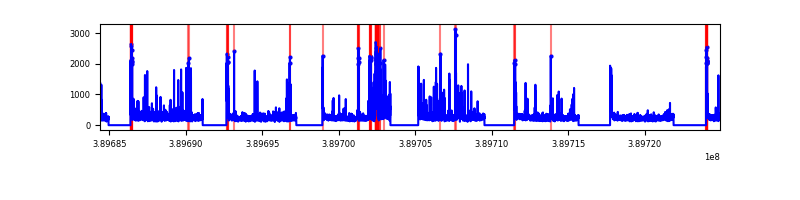 |
| D | 40527 | 27886 | 1397 | 1397 | 3.45% | 5.01% | 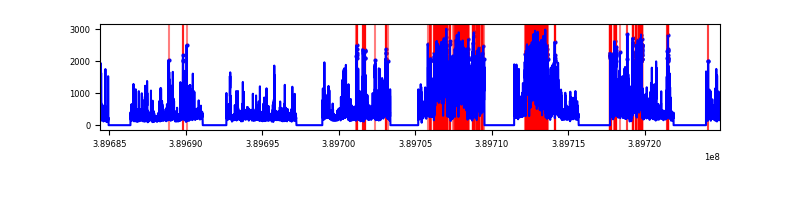 |
Top three noisy pixels from each quadrant. If the there are fewer than three noisy pixels in the level2.evt file, extra rows are filled as -1
| Pixel properties | Quadrant properties | ||||||
|---|---|---|---|---|---|---|---|
| Quadrant | DetID | PixID | Counts | Sigma | Mean | Median | Sigma |
| A | 15 | 169 | 2991409 | 9267.43 | 1454 | 1435 | 322.6 |
| A | 10 | 83 | 607940 | 1879.86 | 1454 | 1435 | 322.6 |
| A | 13 | 6 | 74492 | 226.44 | 1454 | 1435 | 322.6 |
| B | 5 | 172 | 1295900 | 4396.93 | 1474 | 1443 | 294.4 |
| B | 5 | 255 | 253918 | 857.59 | 1474 | 1443 | 294.4 |
| B | 0 | 189 | 200029 | 674.55 | 1474 | 1443 | 294.4 |
| C | 15 | 214 | 1106882 | 3430.63 | 1409 | 1400 | 322.2 |
| C | 0 | 10 | 791252 | 2451.14 | 1409 | 1400 | 322.2 |
| C | 2 | 16 | 476221 | 1473.51 | 1409 | 1400 | 322.2 |
| D | 1 | 52 | 6843565 | 20190.39 | 1415 | 1372 | 338.9 |
| D | 14 | 52 | 2567012 | 7570.86 | 1415 | 1372 | 338.9 |
| D | 13 | 249 | 350135 | 1029.15 | 1415 | 1372 | 338.9 |
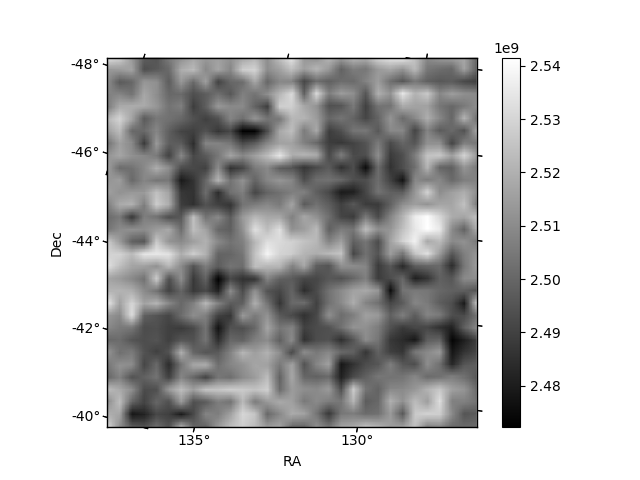
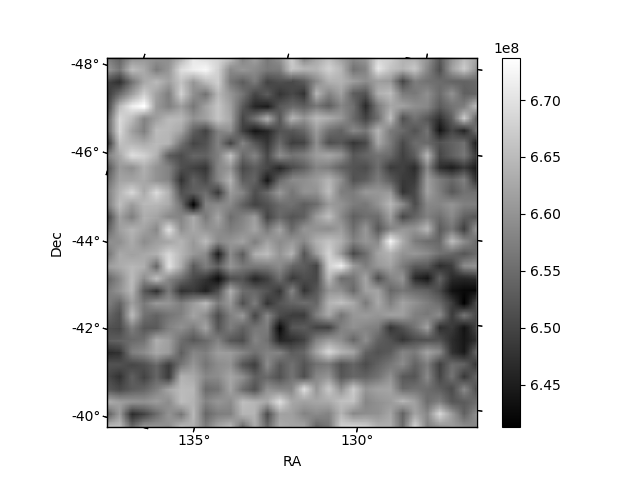
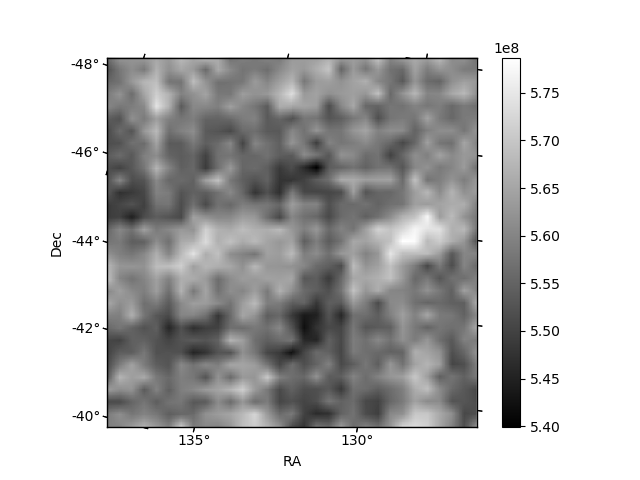
Histogram calculated using DETX and DETY for each event in the final _common_clean file
| Quadrant A | 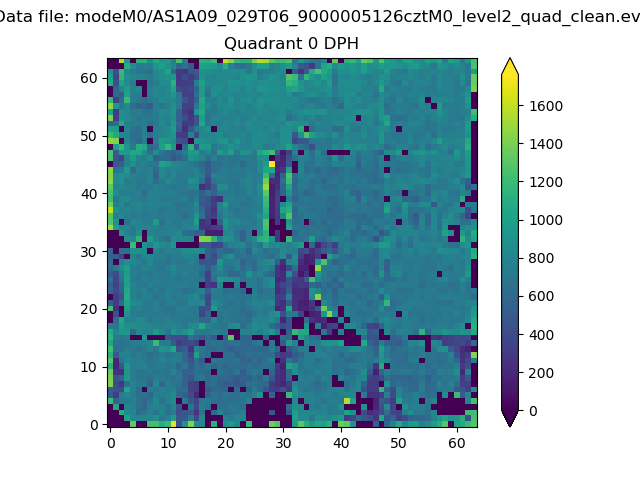 |
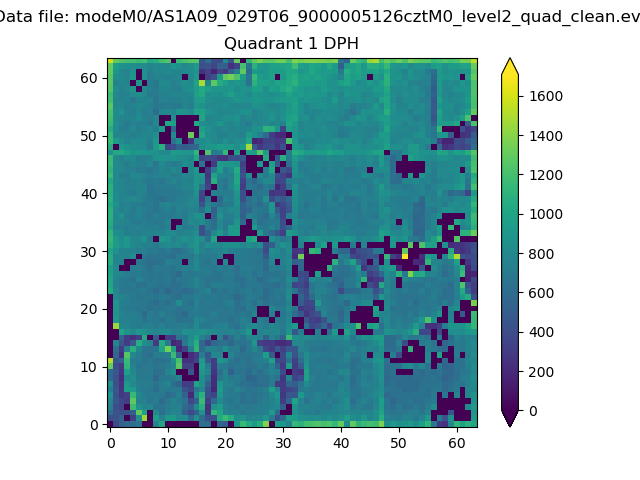 |
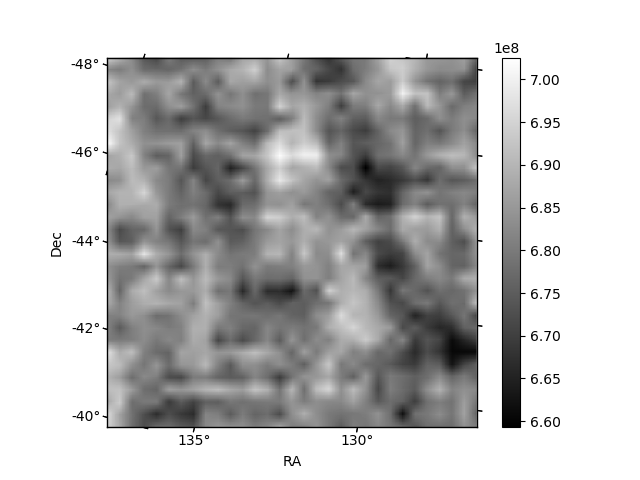
Quadrant B |
|---|---|---|---|
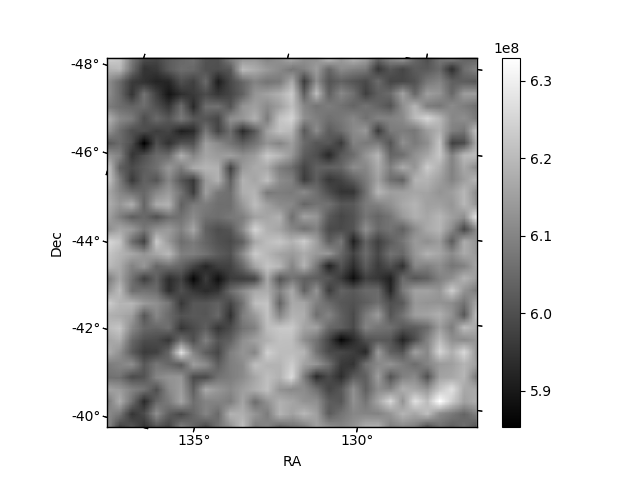
| Quadrant D | 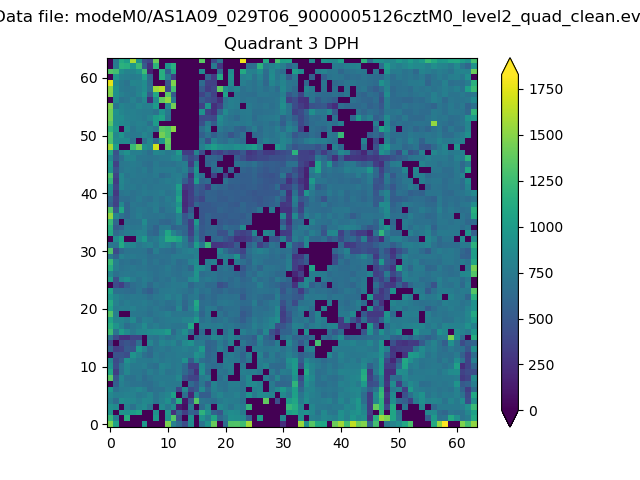 |
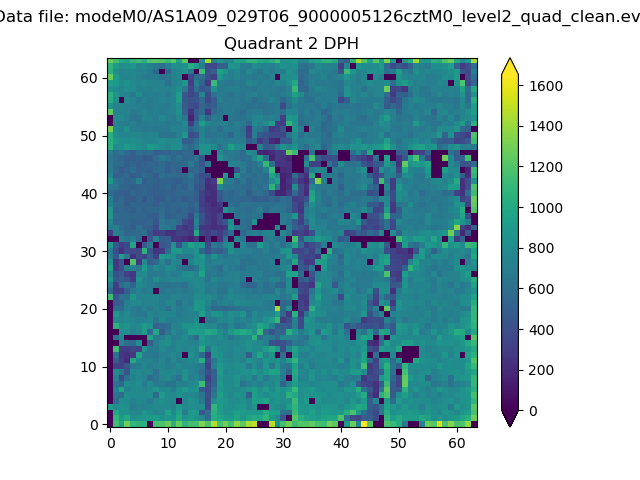 |
Quadrant C |
| Plot type | Count rate plots | Images |
|---|---|---|
| Comparison with Poisson distribution Blue bars denote a histogram of data divided into 1 sec bins. Red curve is a Poisson curve with rate = median count rate of data. |
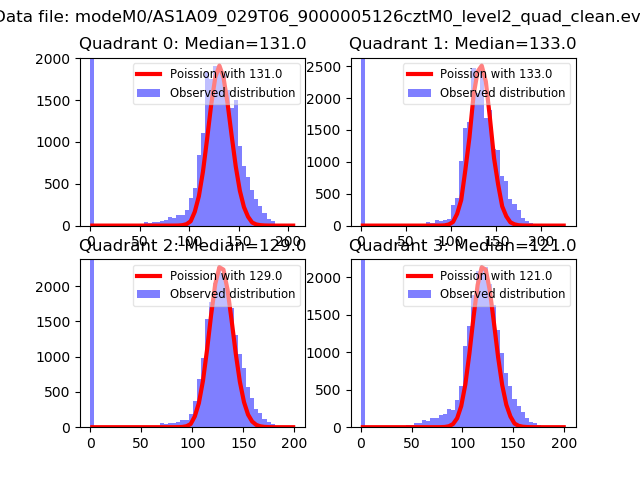 |
 |
| Quadrant-wise count rates Data is divided into 100 sec bins |
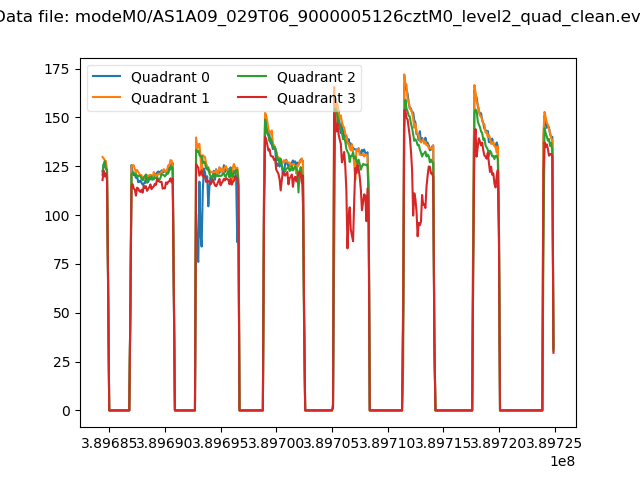 |
|
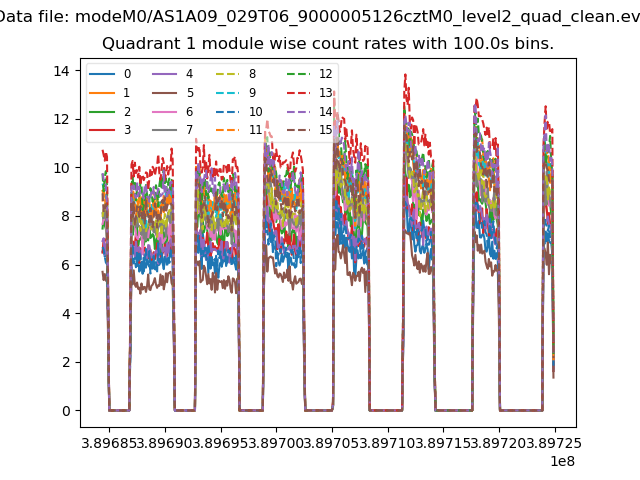
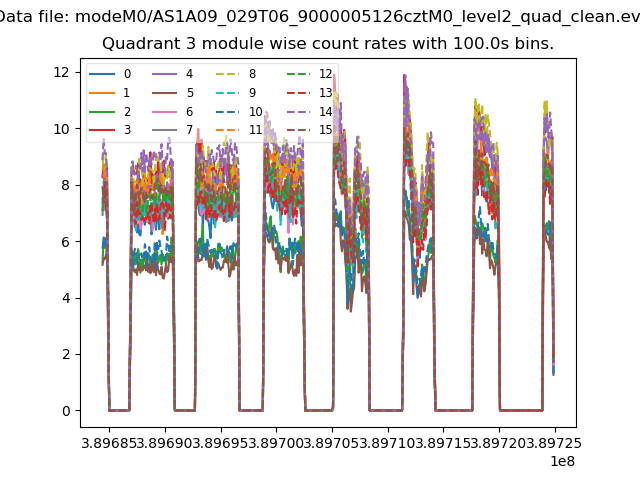
| Module-wise count rates for Quadrant A Data is divided into 100 sec bins |
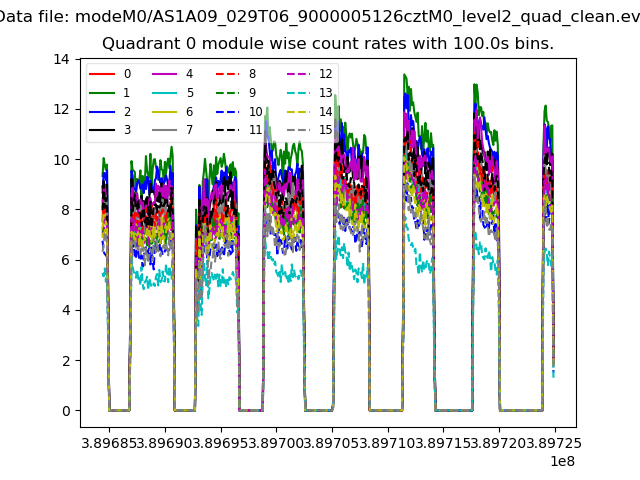 |
 |
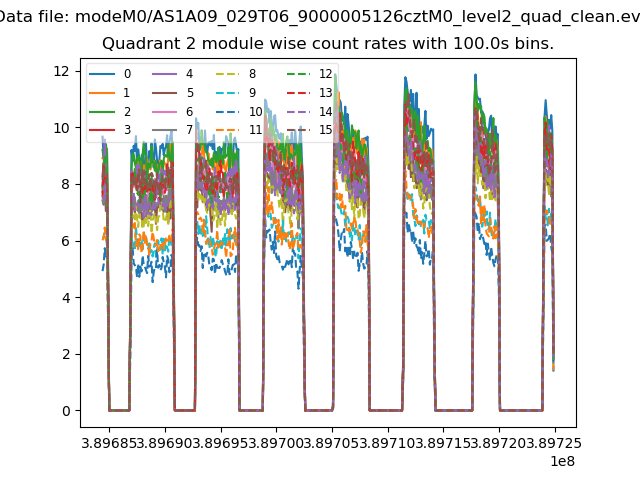
| Module-wise count rates for Quadrant B Data is divided into 100 sec bins |
 |
 |
| Module-wise count rates for Quadrant C Data is divided into 100 sec bins |
 |
 |
| Module-wise count rates for Quadrant D Data is divided into 100 sec bins |
 |
 |
| Parameter | Plot |
|---|---|
| CZT HV Monitor | 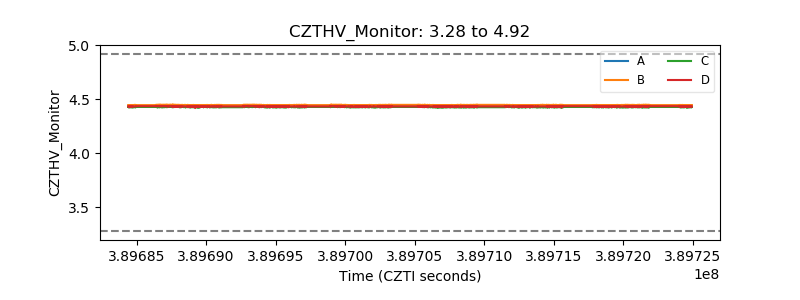 |
| D_VDD | 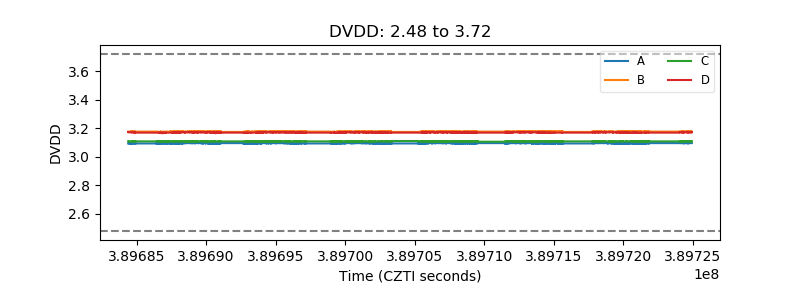 |
| Temperature 1 | 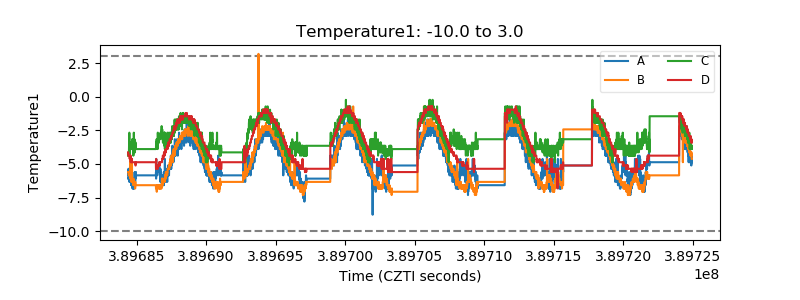 |
| Veto HV Monitor | 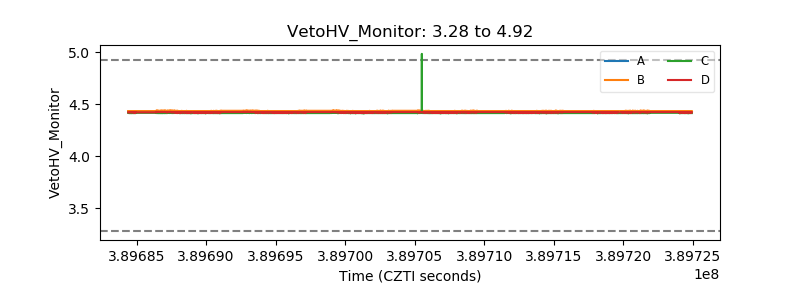 |
| Veto LLD | 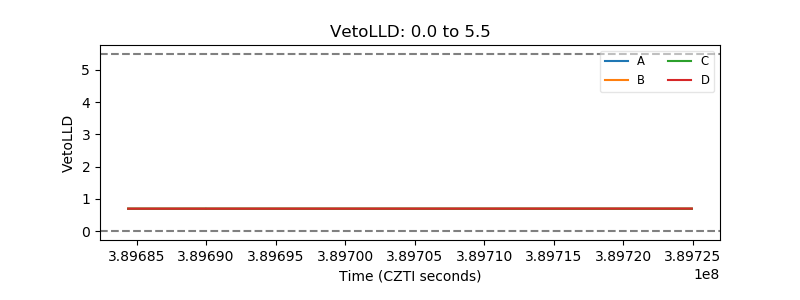 |
| Alpha Counter | 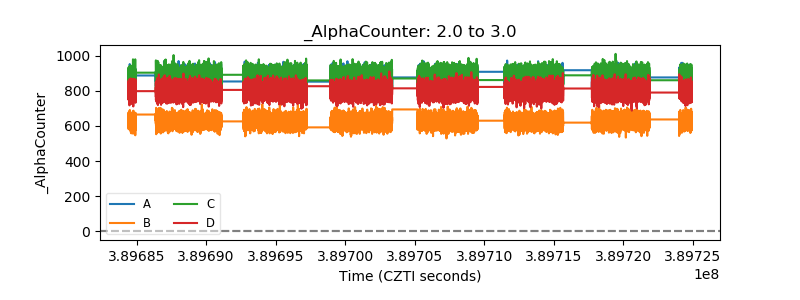 |
| _CPM_Rate | 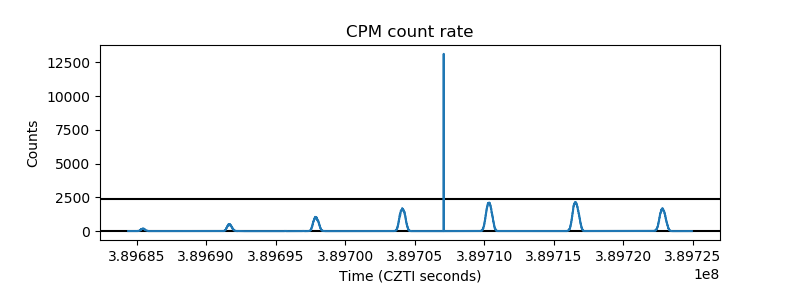 |
| CZT Counter | 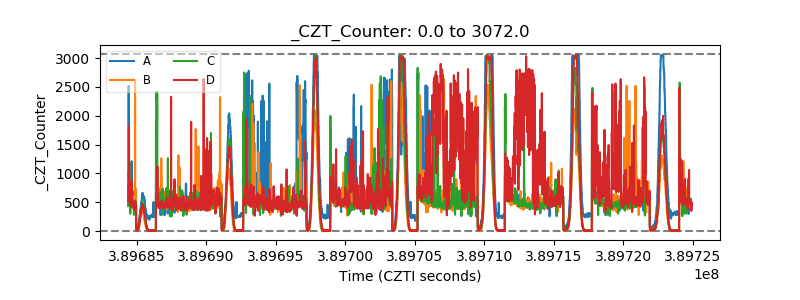 |
| +2.5 Volts monitor | 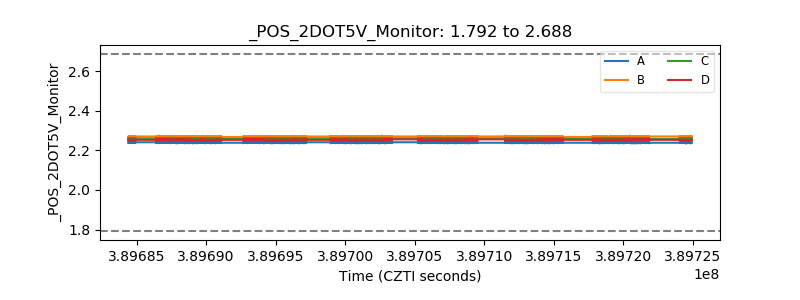 |
| +5 Volts monitor | 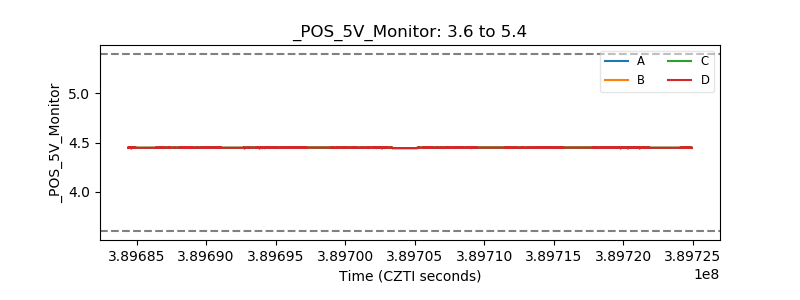 |
| _ROLL_ROT | 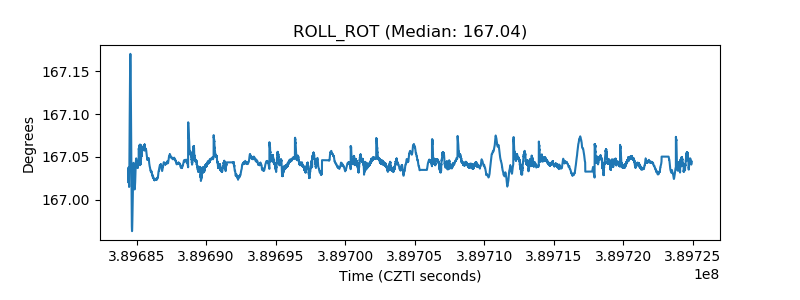 |
| _Roll_DEC | 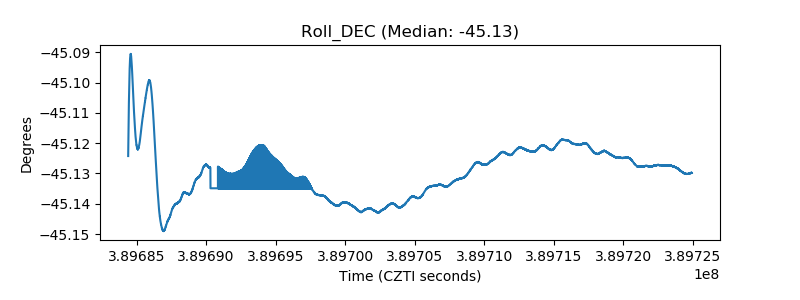 |
| _Roll_RA | 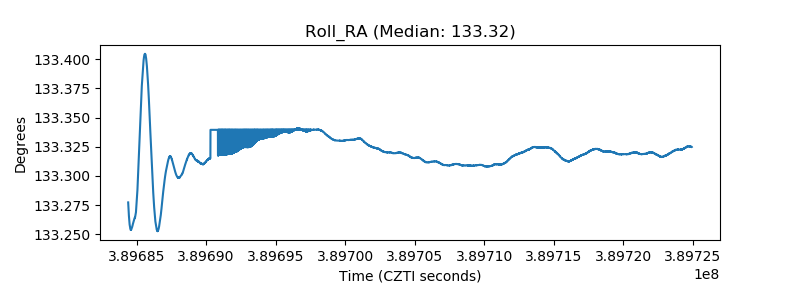 |
| Veto Counter | 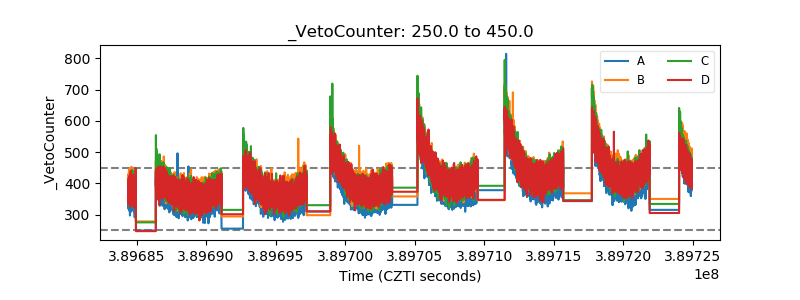 |