| Param | Original file | Final file |
|---|---|---|
| Filename | modeM0/AS1A09_143T09_9000005122_35724cztM0_level2.evt | modeM0/AS1A09_143T09_9000005122_35724cztM0_level2_quad_clean.evt |
| Size (bytes) | 324,296,640 | 61,050,240 |
| Size | 309.3 MB | 58.2 MB |
| Events in quadrant A | 1,712,258 | 412,876 |
| Events in quadrant B | 1,969,081 | 410,088 |
| Events in quadrant C | 1,904,524 | 400,593 |
| Events in quadrant D | 3,992,633 | 372,475 |
| Mode SS | |||
|---|---|---|---|
| Quadrant | BADHDUFLAG | Total packets | Discarded packets |
| A | 0 | 72 | 0 |
| B | 0 | 72 | 0 |
| C | 0 | 72 | 0 |
| D | 0 | 72 | 0 |
| Mode M0 | |||
|---|---|---|---|
| Quadrant | BADHDUFLAG | Total packets | Discarded packets |
| A | 0 | 7255 | 0 |
| B | 0 | 8075 | 0 |
| C | 0 | 7673 | 0 |
| D | 0 | 14290 | 0 |
| Quadrant | Total seconds | Saturated seconds | Saturation percentage |
|---|---|---|---|
| A | 3565 | 2 | 0.056101% |
| B | 3565 | 58 | 1.626928% |
| C | 3565 | 16 | 0.448808% |
| D | 3565 | 80 | 2.244039% |
Noise dominated data is calculated using 1-second bins in cleaned event files. If a bin has >2000 counts, and if more than 50% of those come from <1% of pixels, then it is considered to be noise-dominated and hence unusable.
| Quadrant | # 1 sec bins | Bins with >0 counts | Bins with >2000 counts | High rate bins dominated by noise | Noise dominated (total time) | Noise dominated (detector-on time) | Marked lightcurve |
|---|---|---|---|---|---|---|---|
| A | 3565 | 3565 | 0 | 0 | 0.00% | 0.00% | 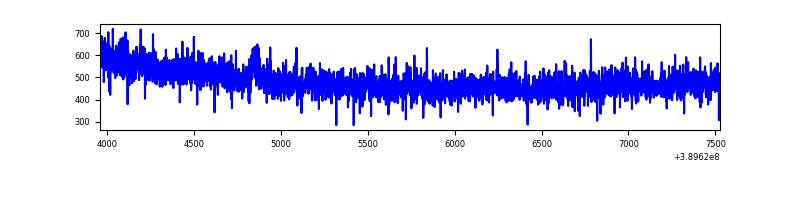 |
| B | 3565 | 3565 | 48 | 48 | 1.35% | 1.35% | 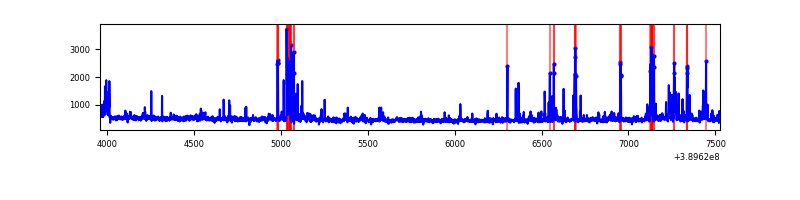 |
| C | 3565 | 3565 | 16 | 16 | 0.45% | 0.45% | 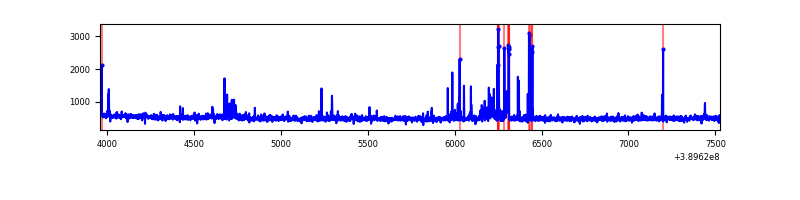 |
| D | 3565 | 3565 | 94 | 94 | 2.64% | 2.64% | 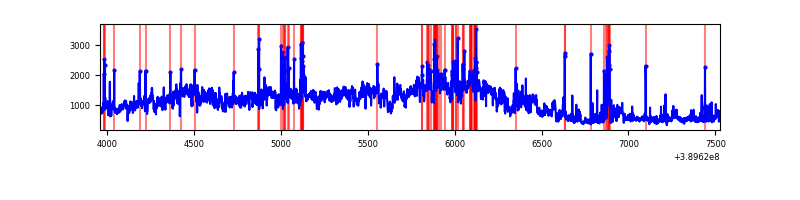 |
Top three noisy pixels from each quadrant. If the there are fewer than three noisy pixels in the level2.evt file, extra rows are filled as -1
| Pixel properties | Quadrant properties | ||||||
|---|---|---|---|---|---|---|---|
| Quadrant | DetID | PixID | Counts | Sigma | Mean | Median | Sigma |
| A | 10 | 83 | 55930 | 651.2 | 422 | 415 | 85.2 |
| A | 13 | 6 | 20877 | 240.02 | 422 | 415 | 85.2 |
| A | 13 | 254 | 5380 | 58.24 | 422 | 415 | 85.2 |
| B | 5 | 172 | 147070 | 1868.15 | 416 | 405 | 78.5 |
| B | 5 | 255 | 136309 | 1731.08 | 416 | 405 | 78.5 |
| B | 0 | 197 | 19722 | 246.05 | 416 | 405 | 78.5 |
| C | 15 | 214 | 145758 | 1523.48 | 412 | 416 | 95.4 |
| C | 1 | 23 | 81436 | 849.25 | 412 | 416 | 95.4 |
| C | 0 | 10 | 54623 | 568.2 | 412 | 416 | 95.4 |
| D | 10 | 203 | 2054125 | 20293.74 | 411 | 400 | 101.2 |
| D | 13 | 249 | 80199 | 788.52 | 411 | 400 | 101.2 |
| D | 7 | 223 | 79388 | 780.51 | 411 | 400 | 101.2 |
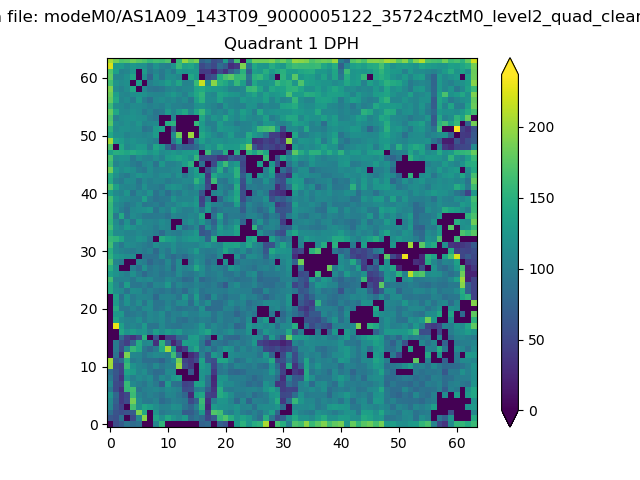
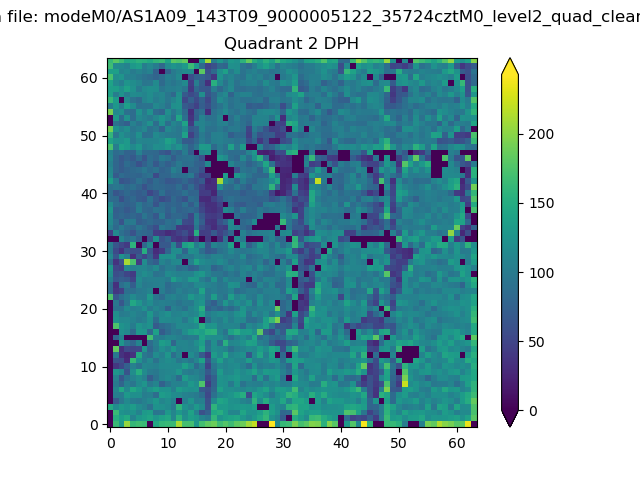
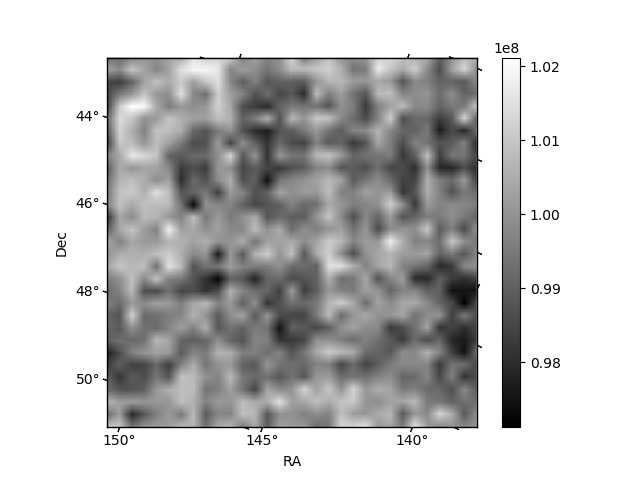
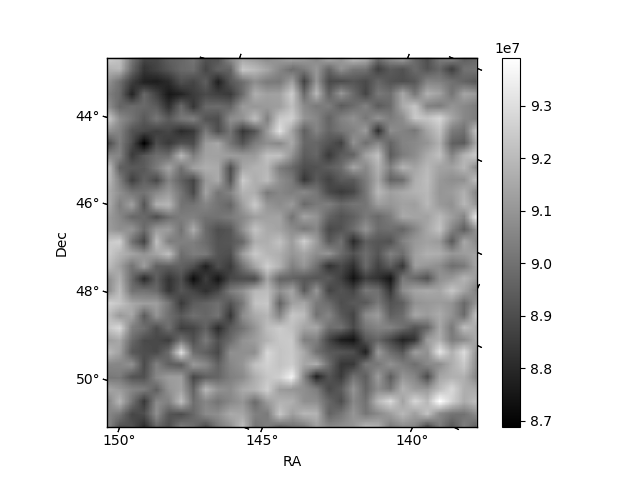
Histogram calculated using DETX and DETY for each event in the final _common_clean file
| Quadrant A |  |
 |
Quadrant B |
|---|---|---|---|
| Quadrant D | 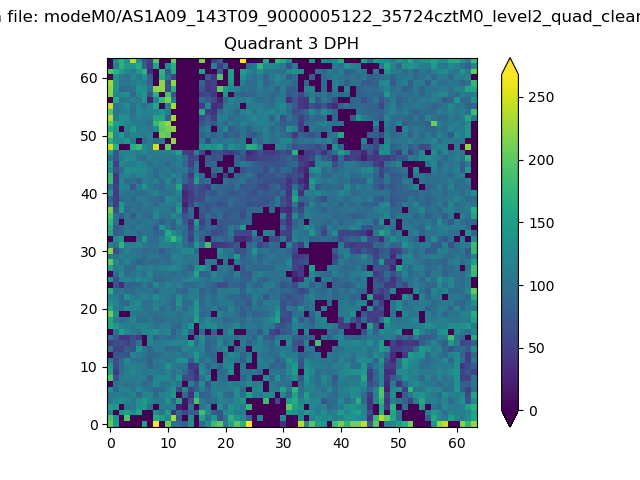 |
 |
Quadrant C |
| Plot type | Count rate plots | Images |
|---|---|---|
| Comparison with Poisson distribution Blue bars denote a histogram of data divided into 1 sec bins. Red curve is a Poisson curve with rate = median count rate of data. |
 |
 |
| Quadrant-wise count rates Data is divided into 100 sec bins |
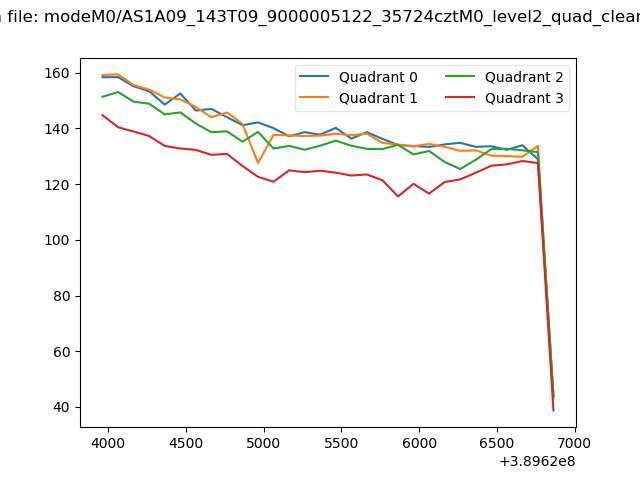 |
|
| Module-wise count rates for Quadrant A Data is divided into 100 sec bins |
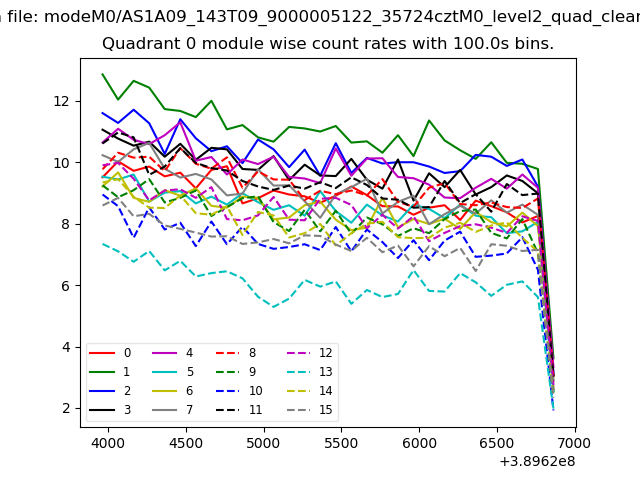 |
 |
| Module-wise count rates for Quadrant B Data is divided into 100 sec bins |
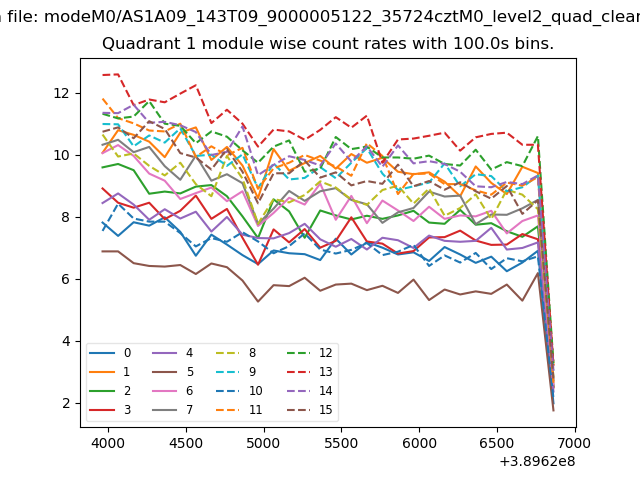 |
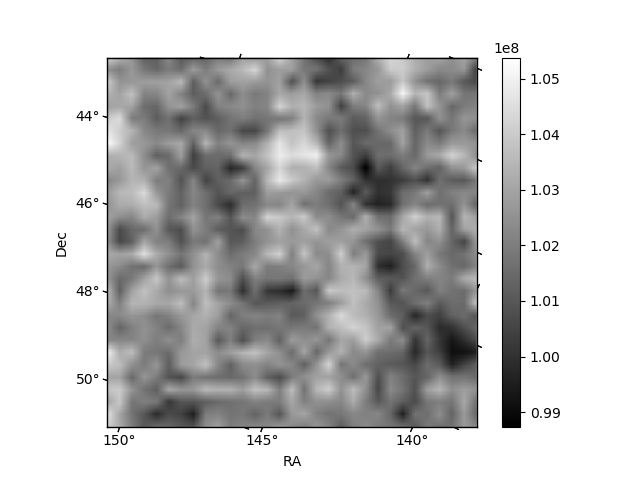 |
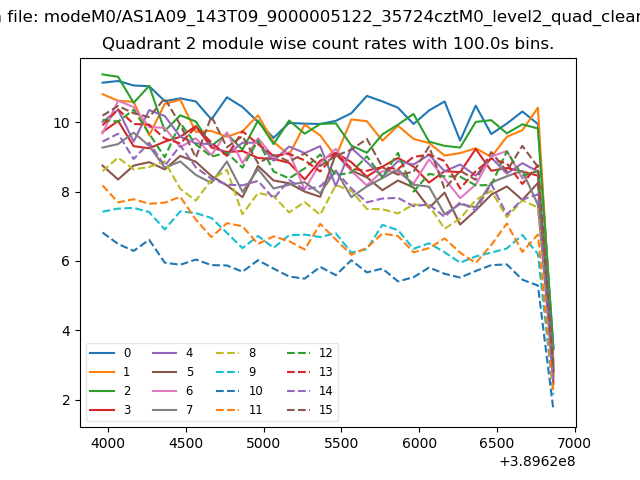
| Module-wise count rates for Quadrant C Data is divided into 100 sec bins |
 |
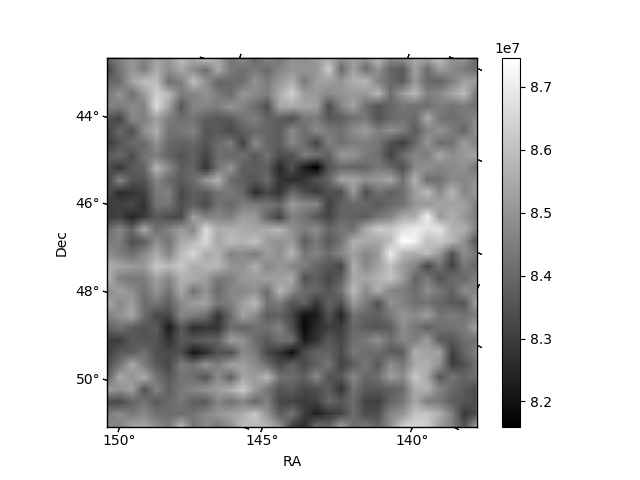 |
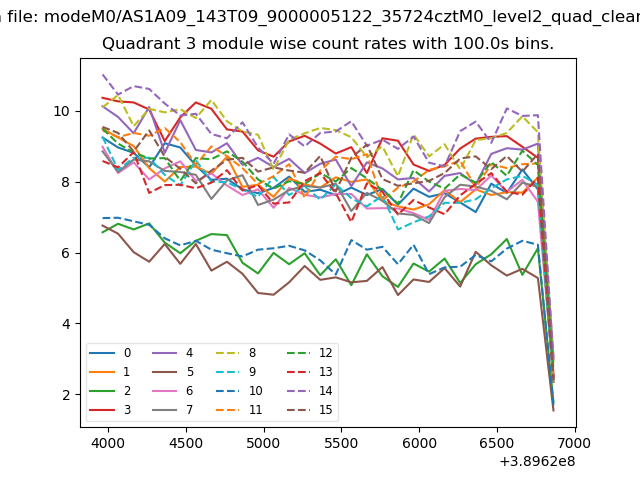
| Module-wise count rates for Quadrant D Data is divided into 100 sec bins |
 |
 |
| Parameter | Plot |
|---|---|
| CZT HV Monitor | 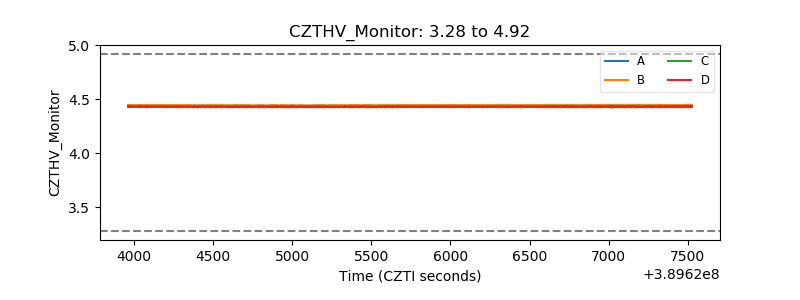 |
| D_VDD | 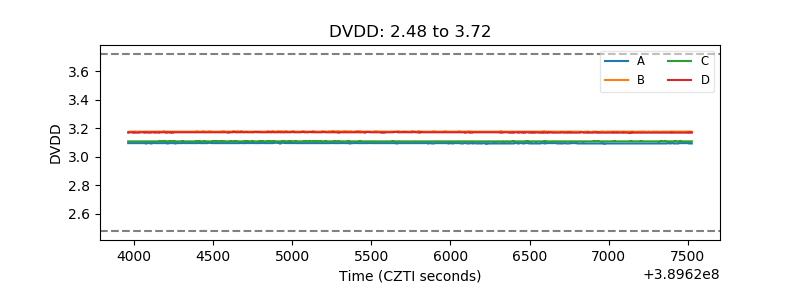 |
| Temperature 1 | 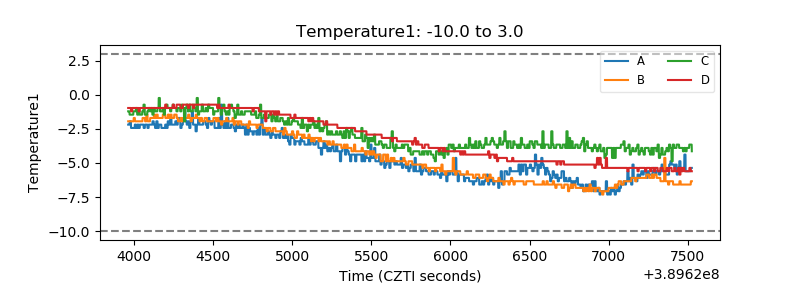 |
| Veto HV Monitor | 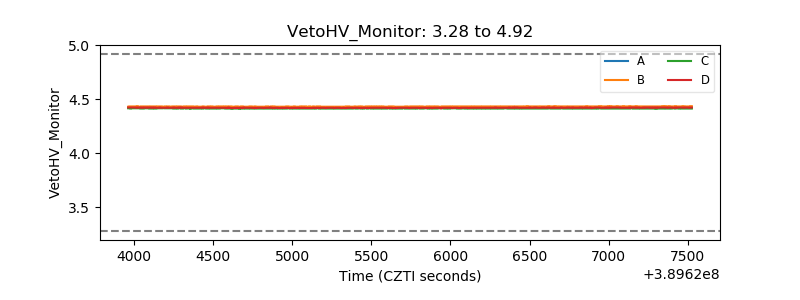 |
| Veto LLD | 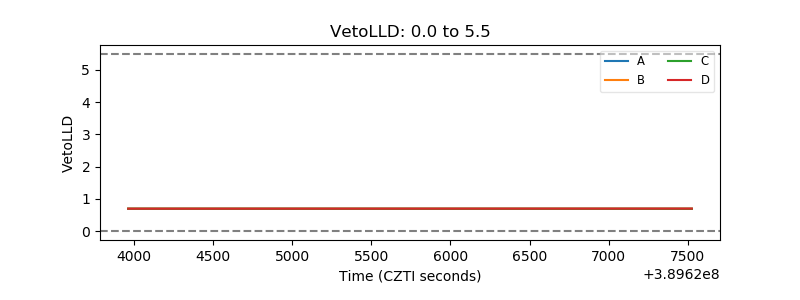 |
| Alpha Counter | 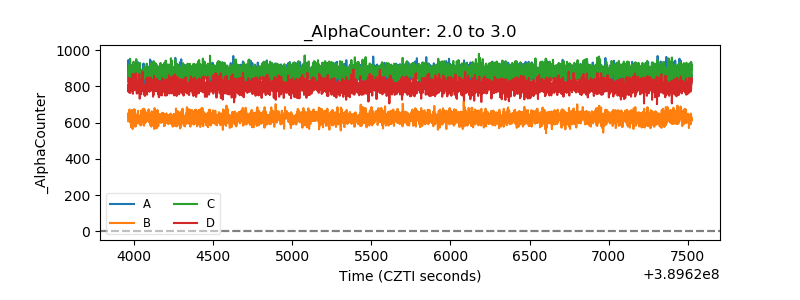 |
| _CPM_Rate | 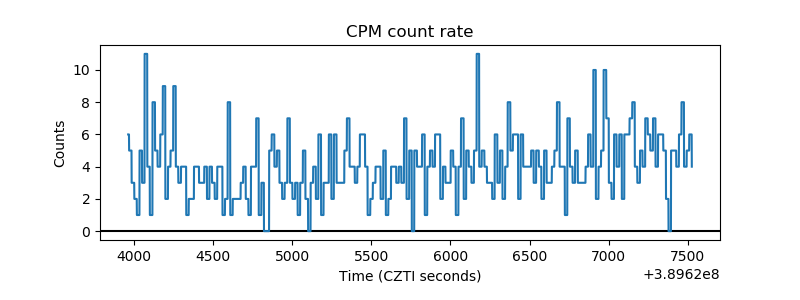 |
| CZT Counter | 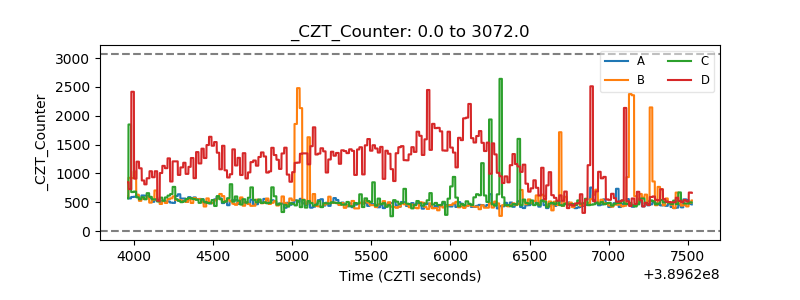 |
| +2.5 Volts monitor | 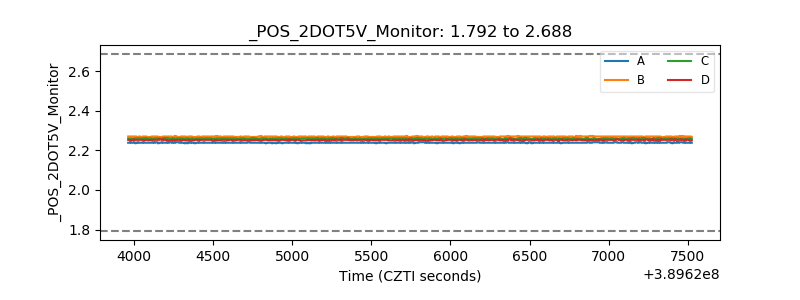 |
| +5 Volts monitor | 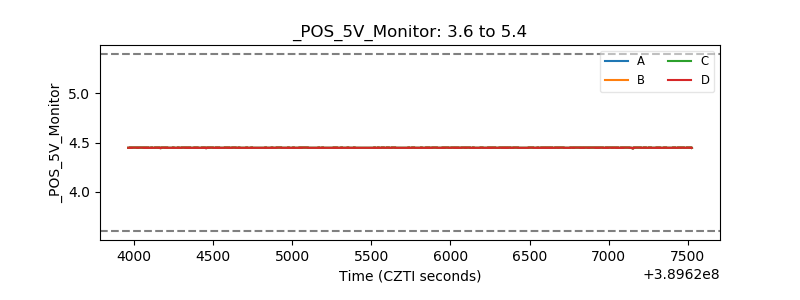 |
| _ROLL_ROT | 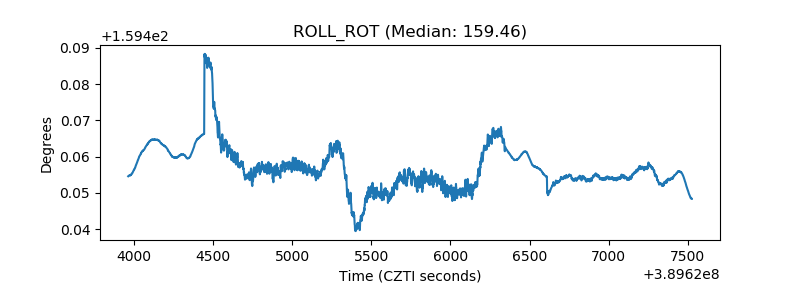 |
| _Roll_DEC | 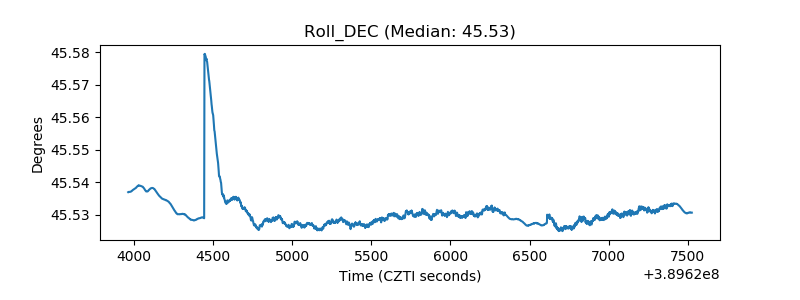 |
| _Roll_RA | 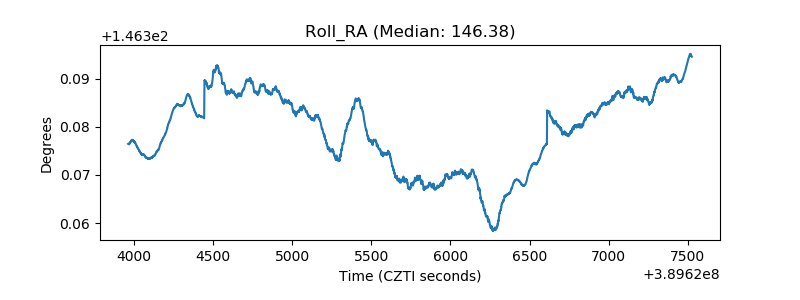 |
| Veto Counter | 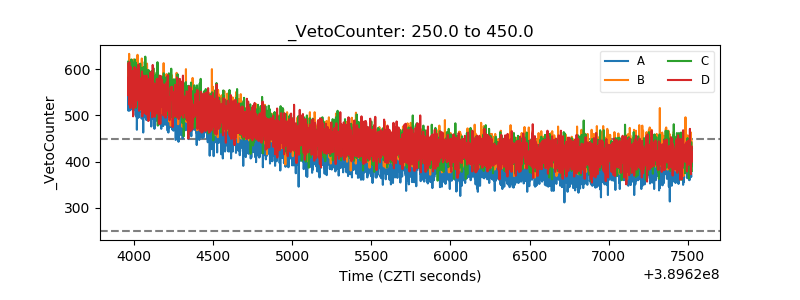 |