| Param | Original file | Final file |
|---|---|---|
| Filename | modeM0/AS1A09_143T04_9000005120_35723cztM0_level2.evt | modeM0/AS1A09_143T04_9000005120_35723cztM0_level2_quad_clean.evt |
| Size (bytes) | 271,635,840 | 75,254,400 |
| Size | 259.1 MB | 71.8 MB |
| Events in quadrant A | 1,858,561 | 514,178 |
| Events in quadrant B | 2,006,835 | 514,412 |
| Events in quadrant C | 2,095,169 | 497,367 |
| Events in quadrant D | 2,005,066 | 483,339 |
| Mode M0 | |||
|---|---|---|---|
| Quadrant | BADHDUFLAG | Total packets | Discarded packets |
| A | 0 | 7939 | 1 |
| B | 0 | 8397 | 1 |
| C | 0 | 8499 | 1 |
| D | 0 | 8355 | 1 |
| Mode SS | |||
|---|---|---|---|
| Quadrant | BADHDUFLAG | Total packets | Discarded packets |
| A | 0 | 78 | 0 |
| B | 0 | 78 | 0 |
| C | 0 | 78 | 0 |
| D | 0 | 78 | 0 |
| Mode M9 | |||
|---|---|---|---|
| Quadrant | BADHDUFLAG | Total packets | Discarded packets |
| A | 0 | 14 | 0 |
| B | 0 | 14 | 0 |
| C | 0 | 14 | 0 |
| D | 0 | 15 | 0 |
| Quadrant | Total seconds | Saturated seconds | Saturation percentage |
|---|---|---|---|
| A | 3811 | 3 | 0.078719% |
| B | 3811 | 42 | 1.102073% |
| C | 3811 | 47 | 1.233272% |
| D | 3811 | 18 | 0.472317% |
Noise dominated data is calculated using 1-second bins in cleaned event files. If a bin has >2000 counts, and if more than 50% of those come from <1% of pixels, then it is considered to be noise-dominated and hence unusable.
| Quadrant | # 1 sec bins | Bins with >0 counts | Bins with >2000 counts | High rate bins dominated by noise | Noise dominated (total time) | Noise dominated (detector-on time) | Marked lightcurve |
|---|---|---|---|---|---|---|---|
| A | 3811 | 3811 | 0 | 0 | 0.00% | 0.00% | 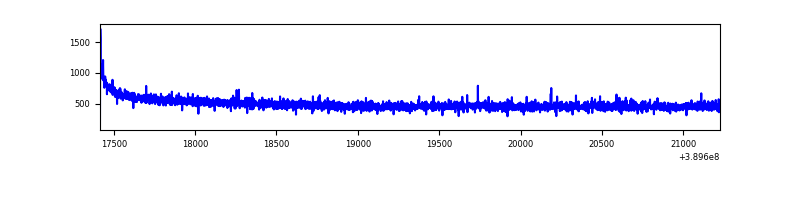 |
| B | 3811 | 3811 | 24 | 24 | 0.63% | 0.63% | 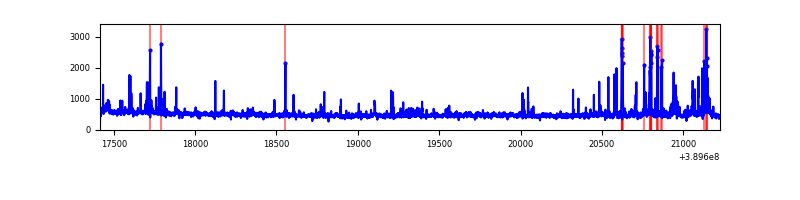 |
| C | 3811 | 3811 | 44 | 44 | 1.15% | 1.15% | 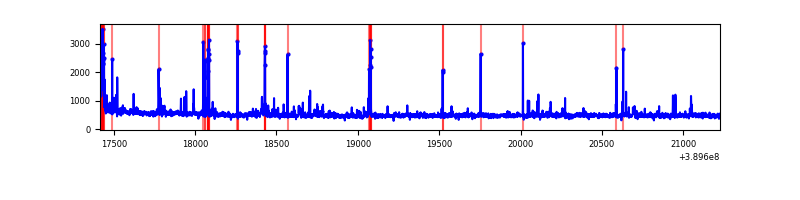 |
| D | 3811 | 3811 | 13 | 13 | 0.34% | 0.34% | 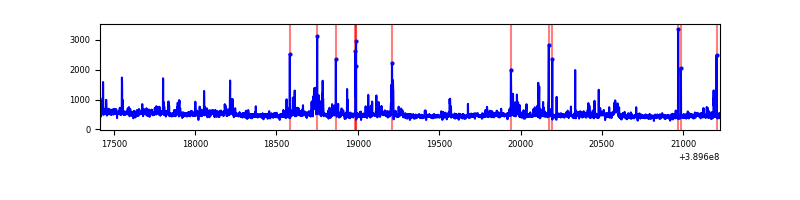 |
Top three noisy pixels from each quadrant. If the there are fewer than three noisy pixels in the level2.evt file, extra rows are filled as -1
| Pixel properties | Quadrant properties | ||||||
|---|---|---|---|---|---|---|---|
| Quadrant | DetID | PixID | Counts | Sigma | Mean | Median | Sigma |
| A | 10 | 83 | 94821 | 1043.9 | 449 | 441 | 90.4 |
| A | 13 | 6 | 10884 | 115.51 | 449 | 441 | 90.4 |
| A | 8 | 144 | 8028 | 83.92 | 449 | 441 | 90.4 |
| B | 5 | 172 | 161668 | 1915.51 | 441 | 430 | 84.2 |
| B | 5 | 255 | 50174 | 590.96 | 441 | 430 | 84.2 |
| B | 0 | 189 | 18932 | 219.8 | 441 | 430 | 84.2 |
| C | 15 | 214 | 158881 | 1570.73 | 434 | 436 | 100.9 |
| C | 0 | 207 | 118270 | 1168.14 | 434 | 436 | 100.9 |
| C | 0 | 10 | 83191 | 820.38 | 434 | 436 | 100.9 |
| D | 8 | 195 | 57028 | 527.07 | 440 | 428 | 107.4 |
| D | 2 | 250 | 40289 | 371.2 | 440 | 428 | 107.4 |
| D | 13 | 249 | 37013 | 340.69 | 440 | 428 | 107.4 |
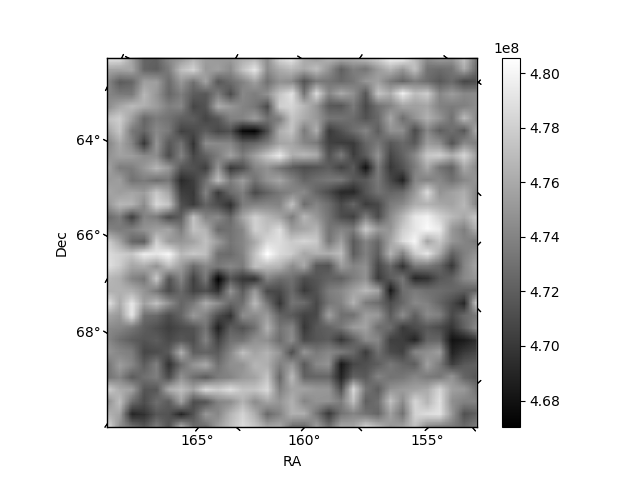
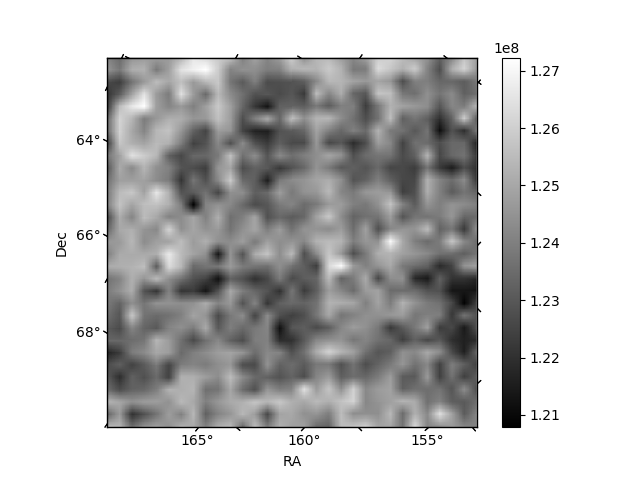
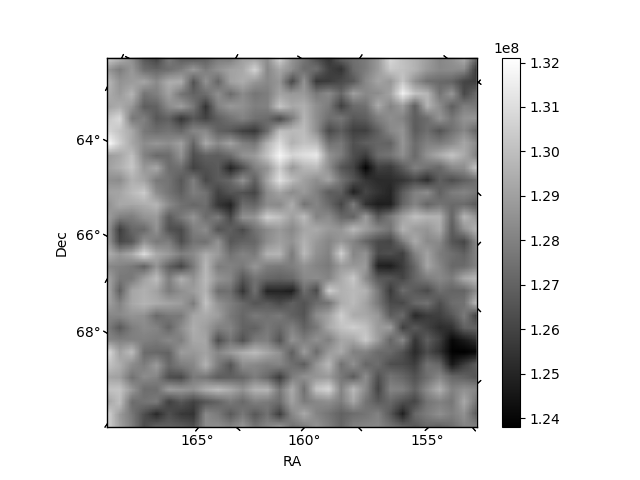
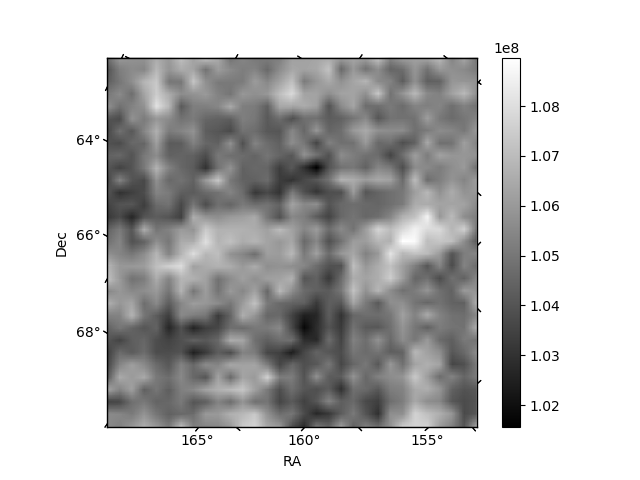
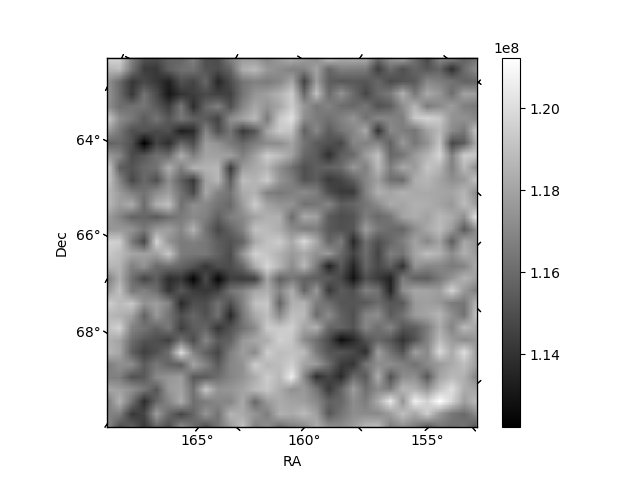
Histogram calculated using DETX and DETY for each event in the final _common_clean file
| Quadrant A | 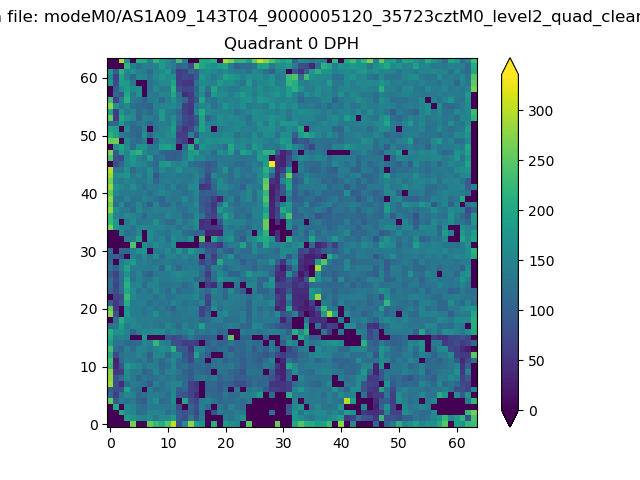 |
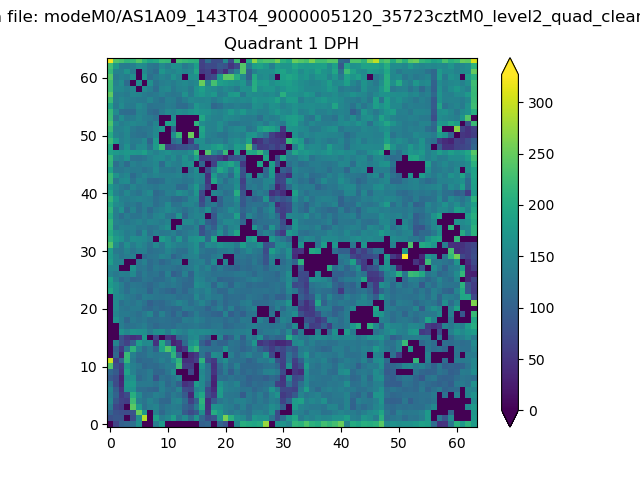 |
Quadrant B |
|---|---|---|---|
| Quadrant D | 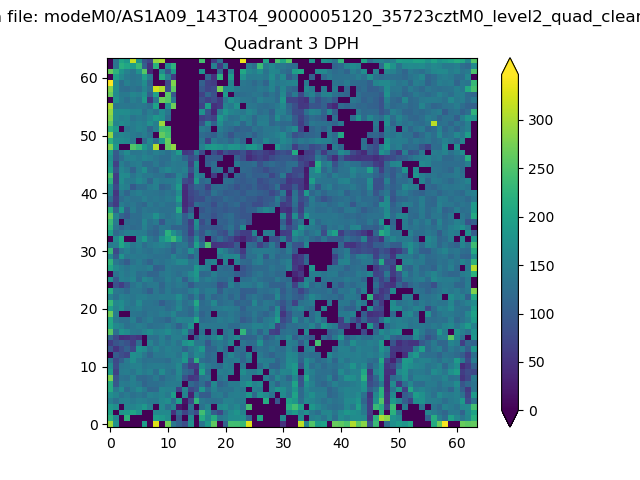 |
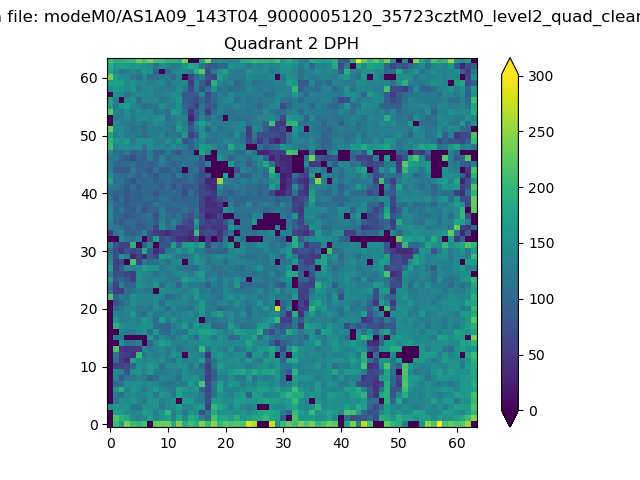 |
Quadrant C |
| Plot type | Count rate plots | Images |
|---|---|---|
| Comparison with Poisson distribution Blue bars denote a histogram of data divided into 1 sec bins. Red curve is a Poisson curve with rate = median count rate of data. |
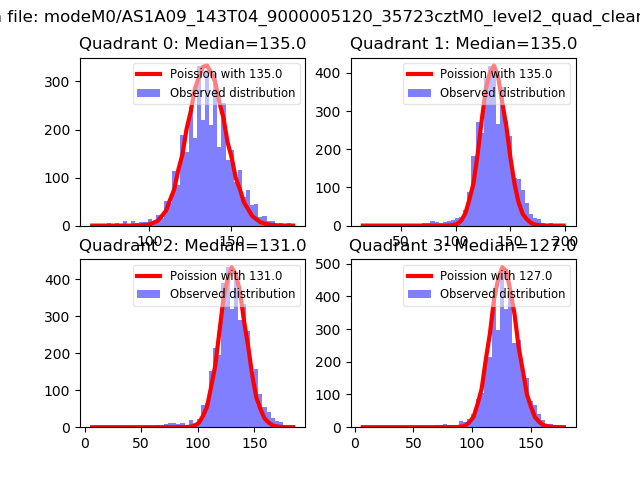 |
 |
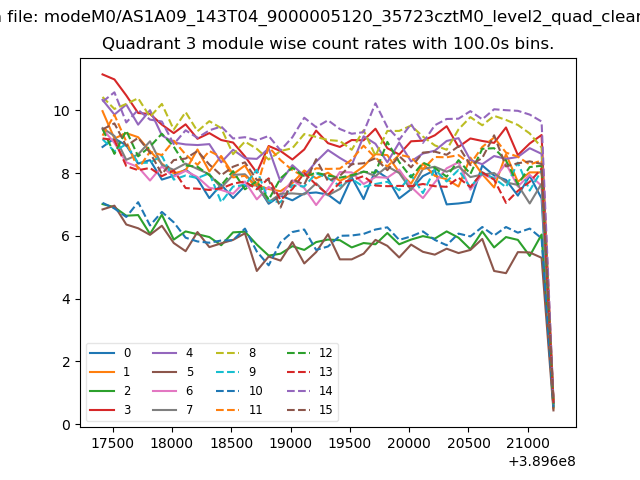
| Quadrant-wise count rates Data is divided into 100 sec bins |
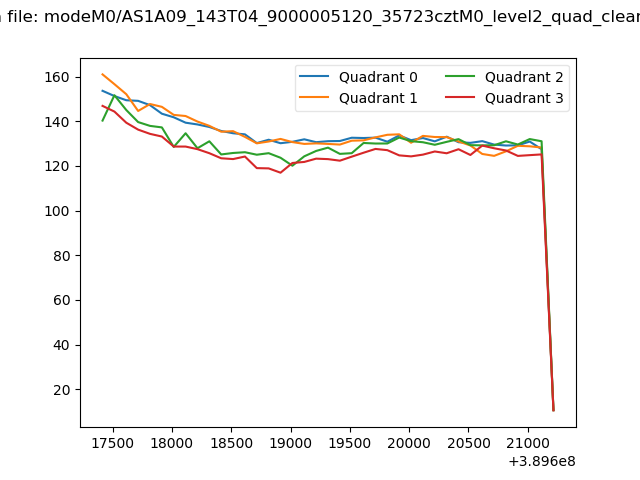 |
|
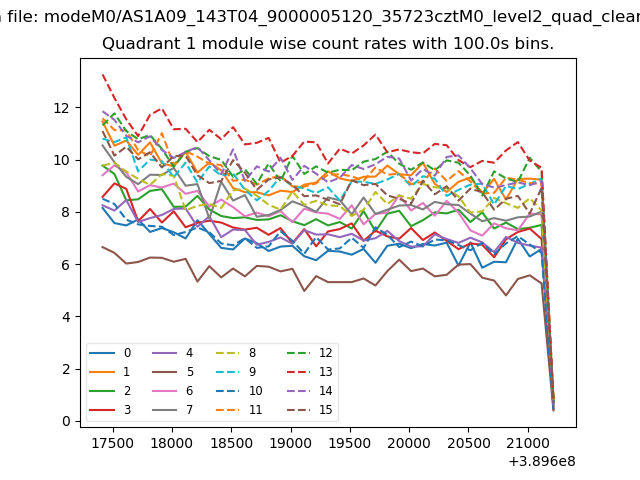
| Module-wise count rates for Quadrant A Data is divided into 100 sec bins |
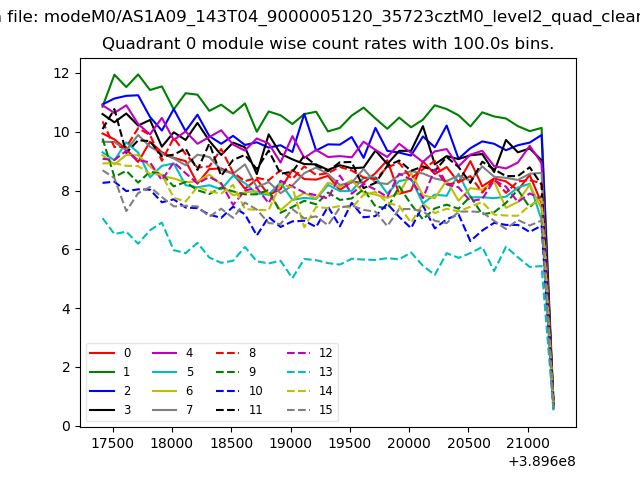 |
 |
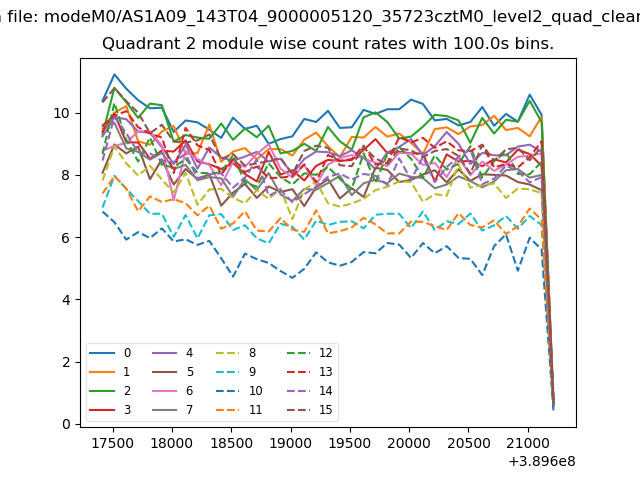
| Module-wise count rates for Quadrant B Data is divided into 100 sec bins |
 |
 |
| Module-wise count rates for Quadrant C Data is divided into 100 sec bins |
 |
 |
| Module-wise count rates for Quadrant D Data is divided into 100 sec bins |
 |
 |
| Parameter | Plot |
|---|---|
| CZT HV Monitor | 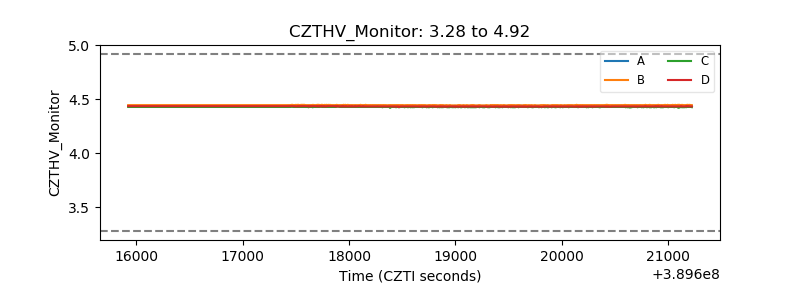 |
| D_VDD | 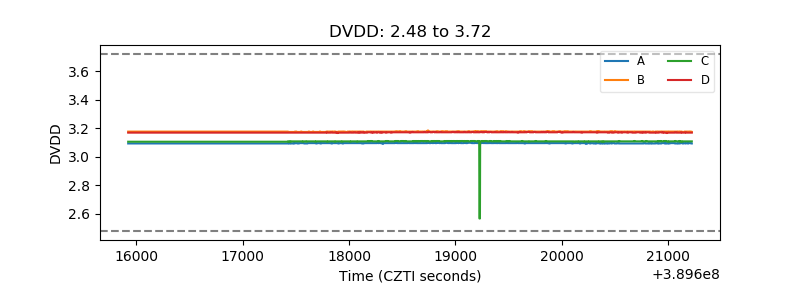 |
| Temperature 1 | 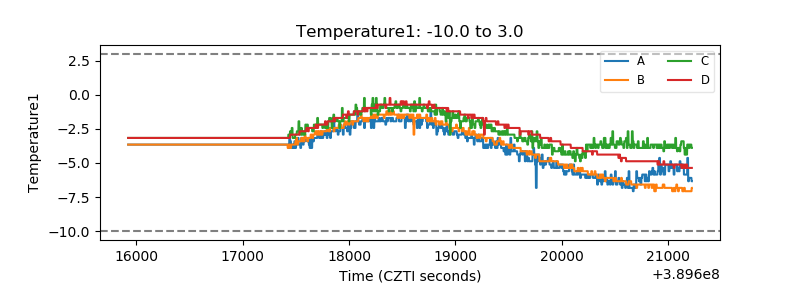 |
| Veto HV Monitor | 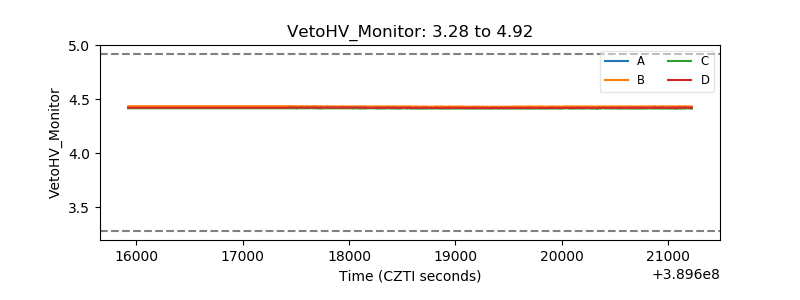 |
| Veto LLD | 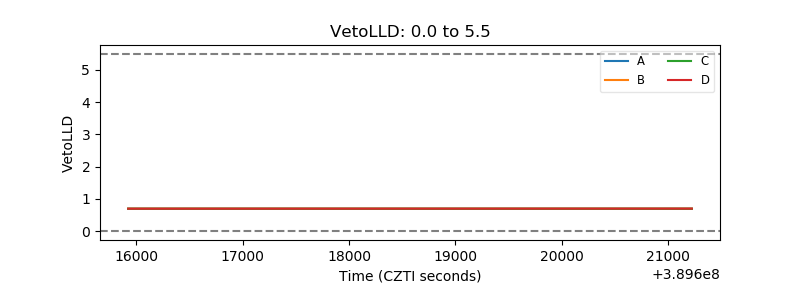 |
| Alpha Counter | 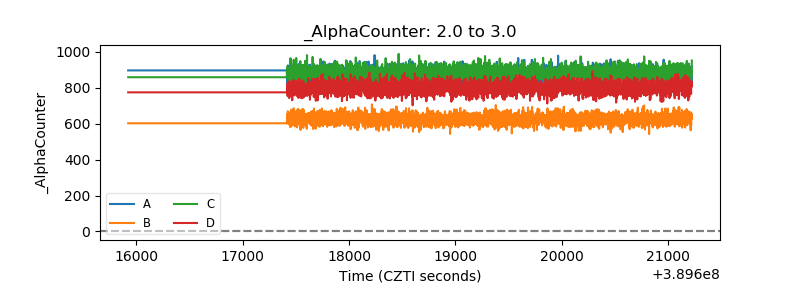 |
| _CPM_Rate | 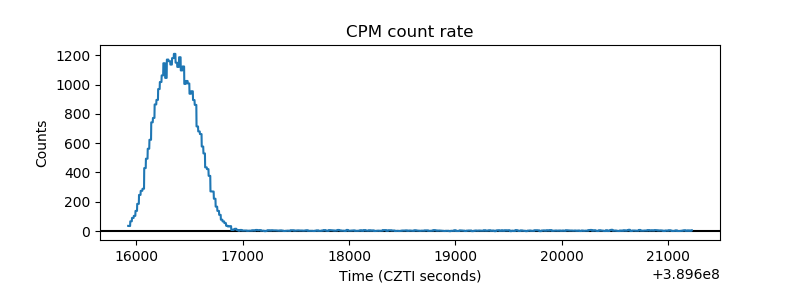 |
| CZT Counter | 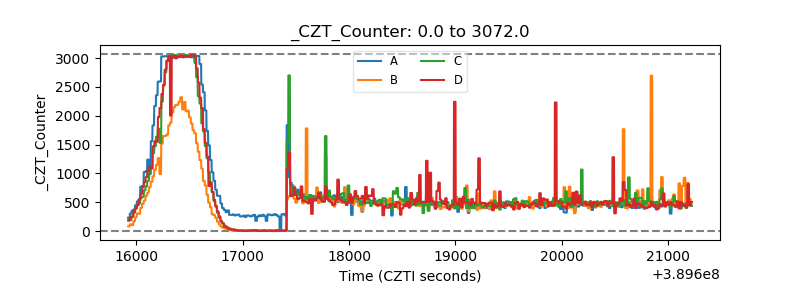 |
| +2.5 Volts monitor | 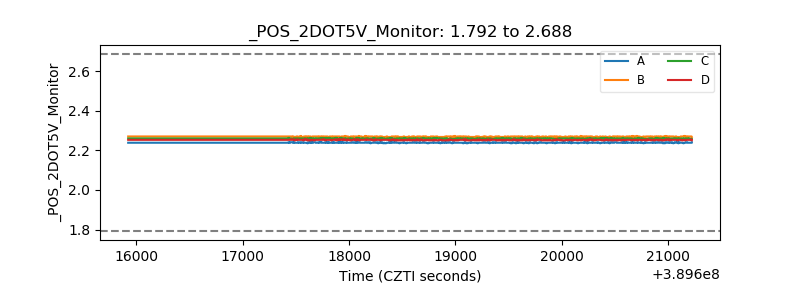 |
| +5 Volts monitor | 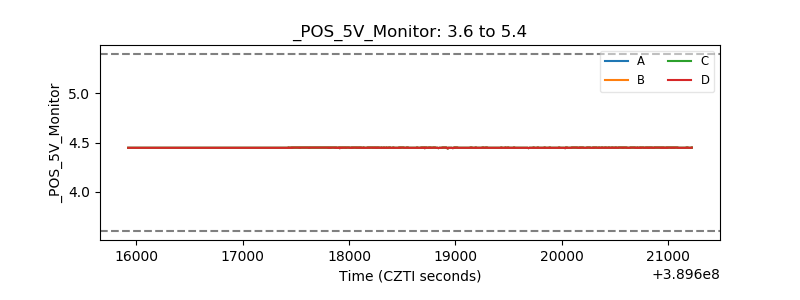 |
| _ROLL_ROT | 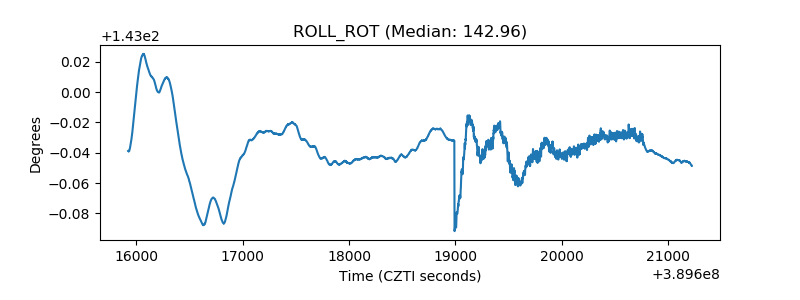 |
| _Roll_DEC | 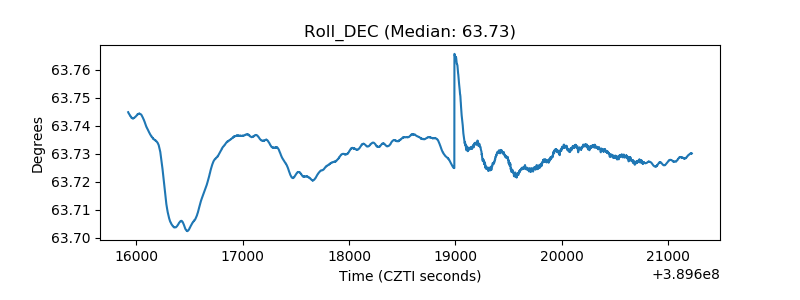 |
| _Roll_RA | 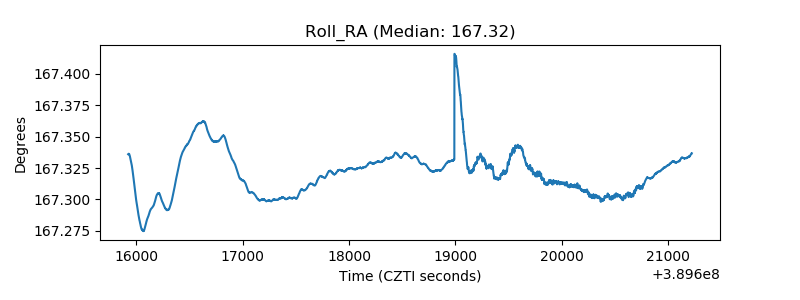 |
| Veto Counter | 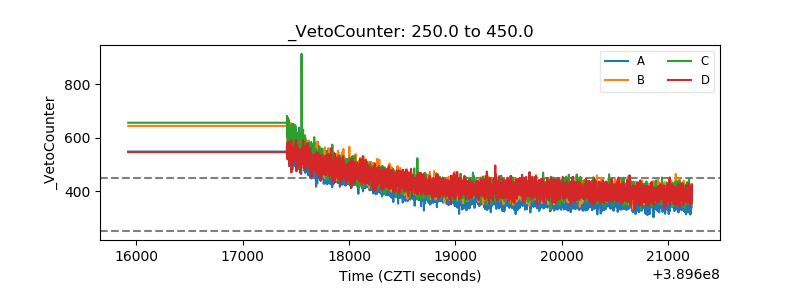 |