| Param | Original file | Final file |
|---|---|---|
| Filename | modeM0/AS1A09_143T04_9000005120_35719cztM0_level2.evt | modeM0/AS1A09_143T04_9000005120_35719cztM0_level2_quad_clean.evt |
| Size (bytes) | 96,382,080 | 8,461,440 |
| Size | 91.9 MB | 8.1 MB |
| Events in quadrant A | 611,880 | 41,986 |
| Events in quadrant B | 865,277 | 41,587 |
| Events in quadrant C | 793,809 | 41,783 |
| Events in quadrant D | 564,445 | 40,371 |
| Mode M0 | |||
|---|---|---|---|
| Quadrant | BADHDUFLAG | Total packets | Discarded packets |
| A | 0 | 2528 | 2 |
| B | 0 | 3323 | 1 |
| C | 0 | 3045 | 1 |
| D | 0 | 2462 | 1 |
| Mode SS | |||
|---|---|---|---|
| Quadrant | BADHDUFLAG | Total packets | Discarded packets |
| A | 0 | 26 | 0 |
| B | 0 | 26 | 0 |
| C | 0 | 26 | 0 |
| D | 0 | 26 | 0 |
| Mode M9 | |||
|---|---|---|---|
| Quadrant | BADHDUFLAG | Total packets | Discarded packets |
| A | 0 | 15 | 0 |
| B | 0 | 15 | 0 |
| C | 0 | 15 | 0 |
| D | 0 | 15 | 0 |
| Quadrant | Total seconds | Saturated seconds | Saturation percentage |
|---|---|---|---|
| A | 1185 | 4 | 0.337553% |
| B | 1185 | 70 | 5.907173% |
| C | 1185 | 53 | 4.472574% |
| D | 1185 | 4 | 0.337553% |
Noise dominated data is calculated using 1-second bins in cleaned event files. If a bin has >2000 counts, and if more than 50% of those come from <1% of pixels, then it is considered to be noise-dominated and hence unusable.
| Quadrant | # 1 sec bins | Bins with >0 counts | Bins with >2000 counts | High rate bins dominated by noise | Noise dominated (total time) | Noise dominated (detector-on time) | Marked lightcurve |
|---|---|---|---|---|---|---|---|
| A | 2679 | 1186 | 0 | 0 | 0.00% | 0.00% | 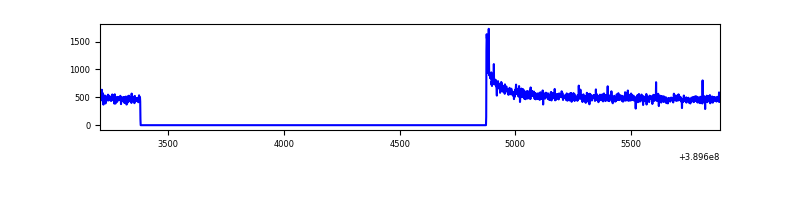 |
| B | 2679 | 1186 | 35 | 35 | 1.31% | 2.95% | 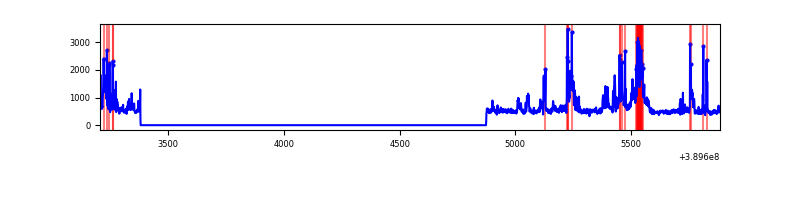 |
| C | 2679 | 1186 | 51 | 51 | 1.90% | 4.30% | 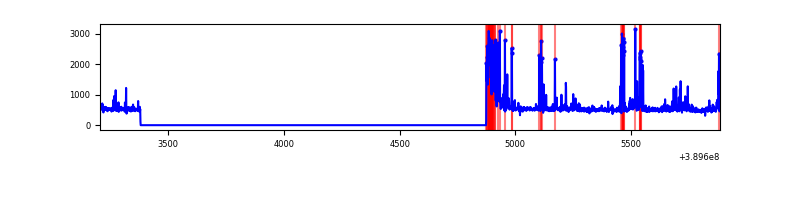 |
| D | 2679 | 1186 | 2 | 2 | 0.07% | 0.17% | 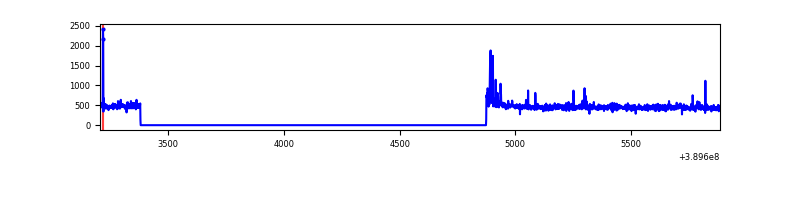 |
Top three noisy pixels from each quadrant. If the there are fewer than three noisy pixels in the level2.evt file, extra rows are filled as -1
| Pixel properties | Quadrant properties | ||||||
|---|---|---|---|---|---|---|---|
| Quadrant | DetID | PixID | Counts | Sigma | Mean | Median | Sigma |
| A | 10 | 83 | 53574 | 1713.31 | 142 | 138 | 31.2 |
| A | 7 | 16 | 4197 | 130.14 | 142 | 138 | 31.2 |
| A | 13 | 6 | 2011 | 60.05 | 142 | 138 | 31.2 |
| B | 5 | 172 | 294179 | 10051.29 | 140 | 136 | 29.3 |
| B | 5 | 255 | 10893 | 367.71 | 140 | 136 | 29.3 |
| B | 0 | 155 | 6413 | 214.57 | 140 | 136 | 29.3 |
| C | 0 | 10 | 111366 | 3399.29 | 134 | 135 | 32.7 |
| C | 0 | 207 | 96043 | 2931.01 | 134 | 135 | 32.7 |
| C | 15 | 214 | 53523 | 1631.57 | 134 | 135 | 32.7 |
| D | 13 | 249 | 24016 | 678.71 | 136 | 132 | 35.2 |
| D | 10 | 203 | 4848 | 134.01 | 136 | 132 | 35.2 |
| D | 2 | 234 | 4376 | 120.6 | 136 | 132 | 35.2 |
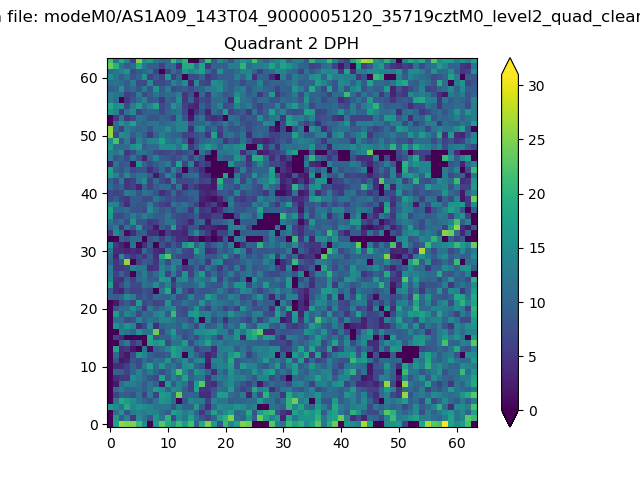
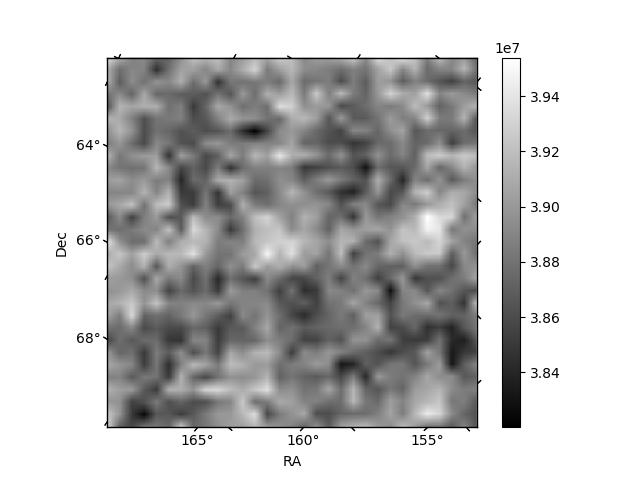
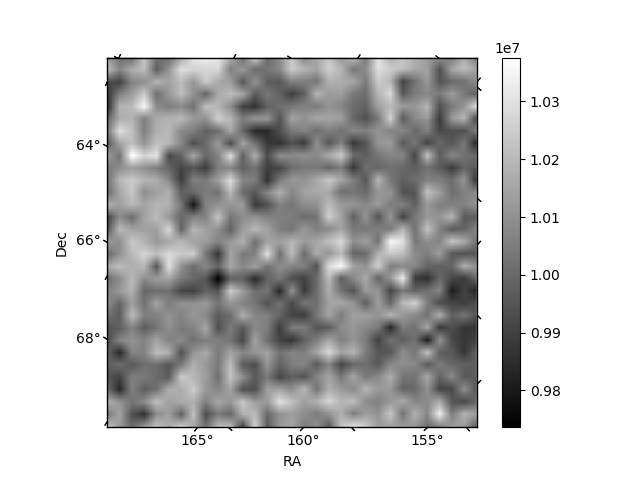
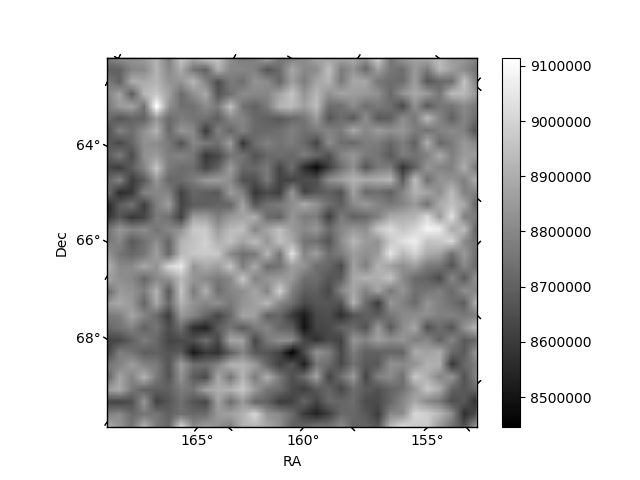
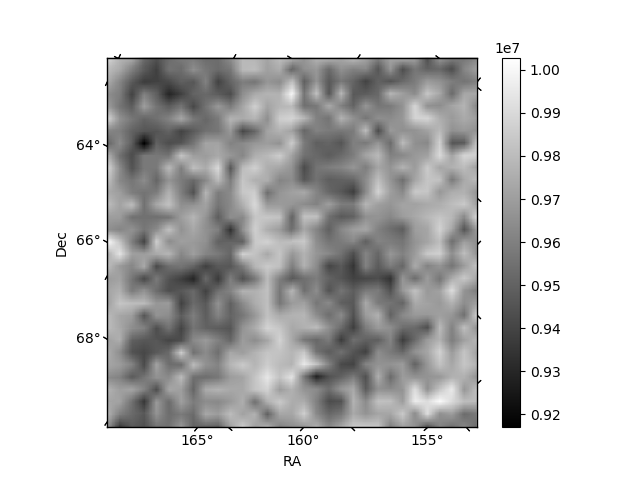
Histogram calculated using DETX and DETY for each event in the final _common_clean file
| Quadrant A | 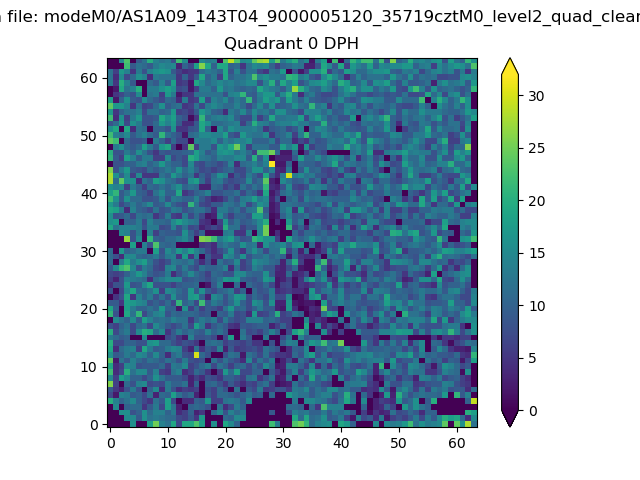 |
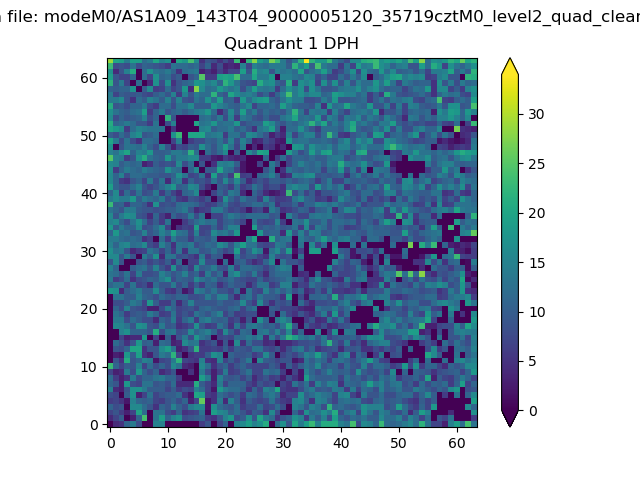 |
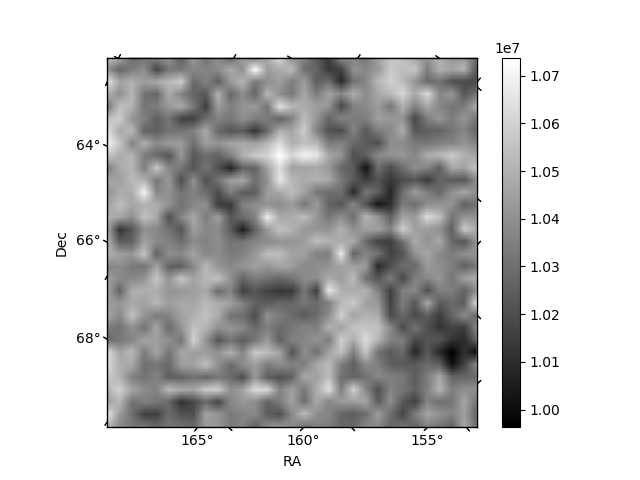
Quadrant B |
|---|---|---|---|
| Quadrant D | 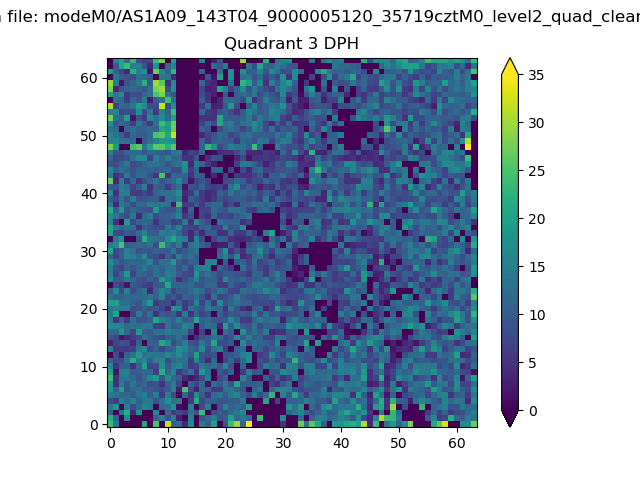 |
 |
Quadrant C |
| Plot type | Count rate plots | Images |
|---|---|---|
| Comparison with Poisson distribution Blue bars denote a histogram of data divided into 1 sec bins. Red curve is a Poisson curve with rate = median count rate of data. |
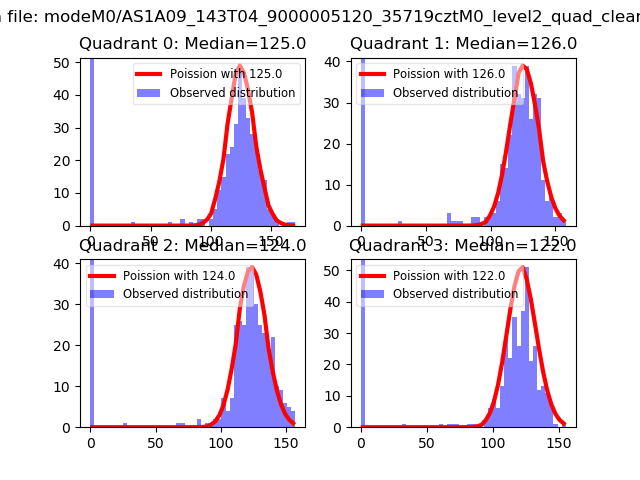 |
 |
| Quadrant-wise count rates Data is divided into 100 sec bins |
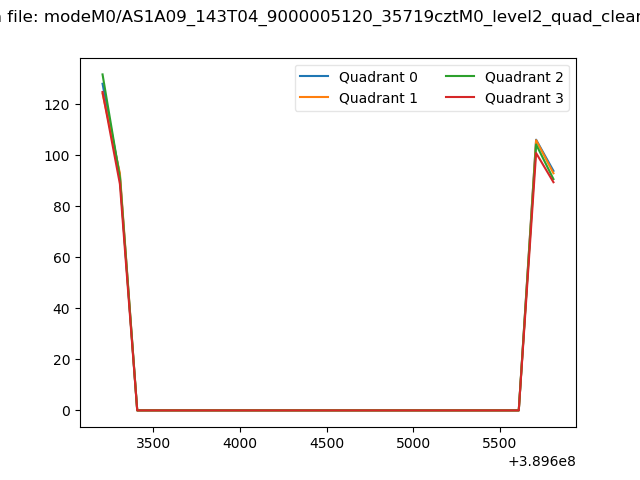 |
|
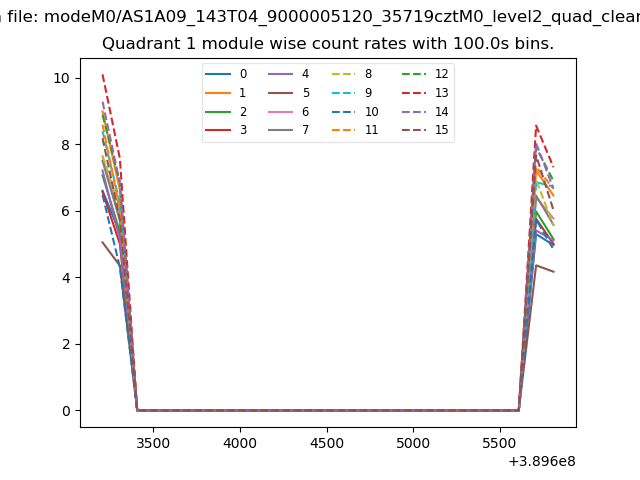
| Module-wise count rates for Quadrant A Data is divided into 100 sec bins |
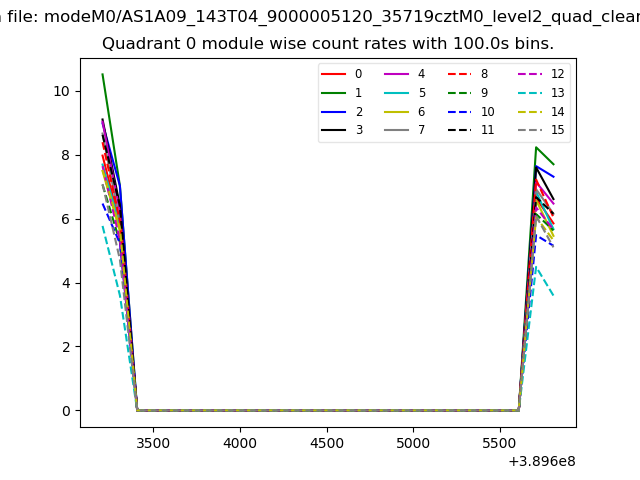 |
 |
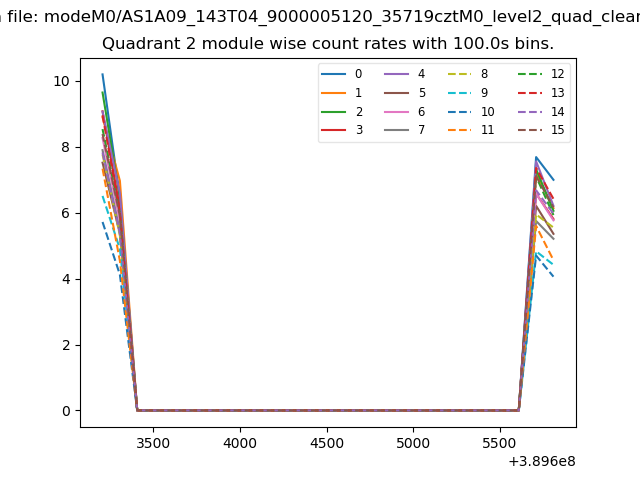
| Module-wise count rates for Quadrant B Data is divided into 100 sec bins |
 |
 |
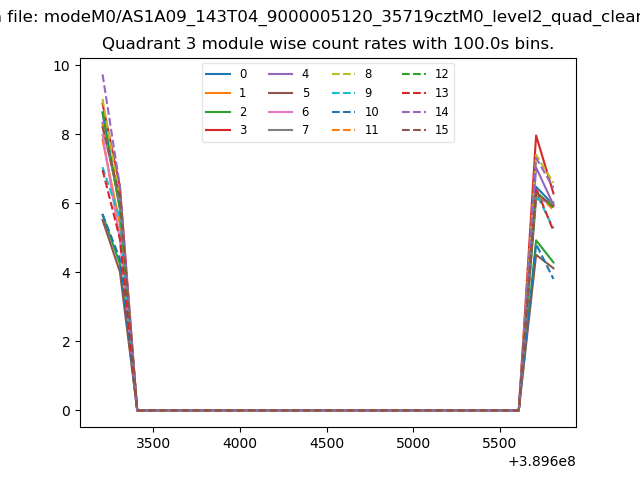
| Module-wise count rates for Quadrant C Data is divided into 100 sec bins |
 |
 |
| Module-wise count rates for Quadrant D Data is divided into 100 sec bins |
 |
 |
| Parameter | Plot |
|---|---|
| CZT HV Monitor | 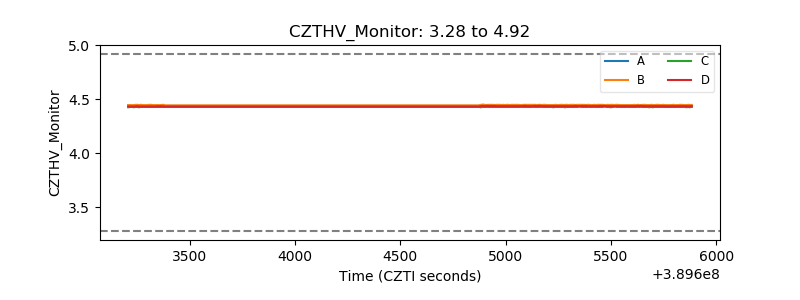 |
| D_VDD | 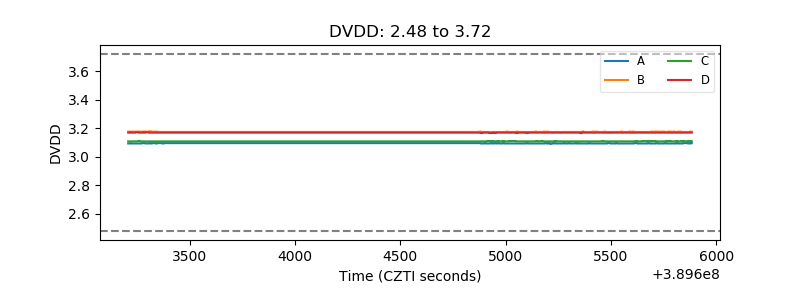 |
| Temperature 1 | 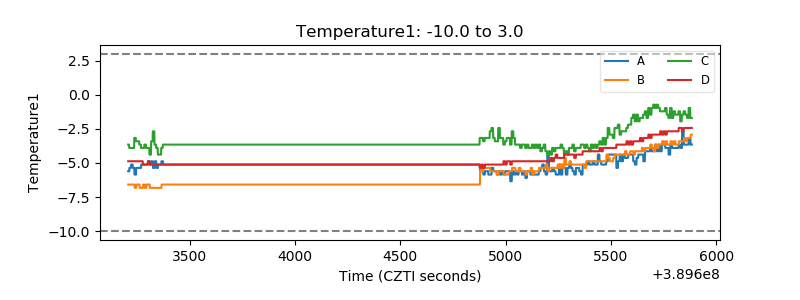 |
| Veto HV Monitor | 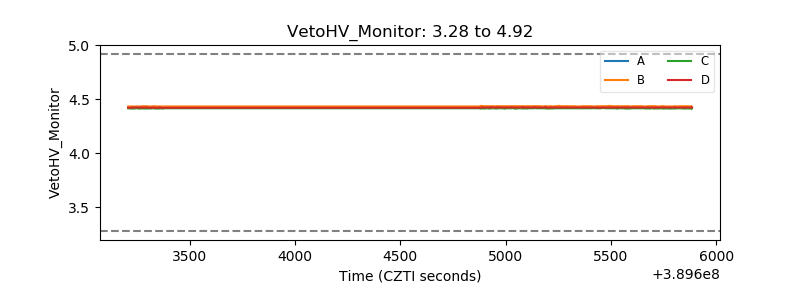 |
| Veto LLD | 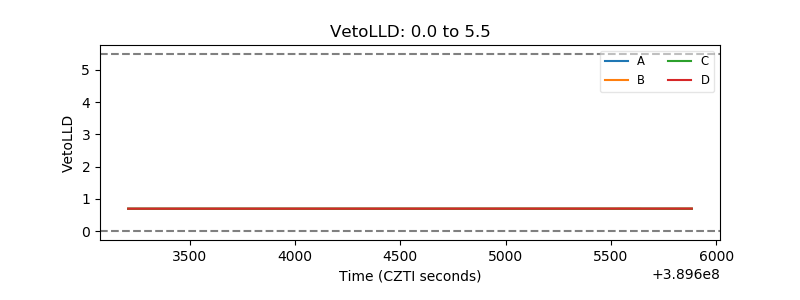 |
| Alpha Counter | 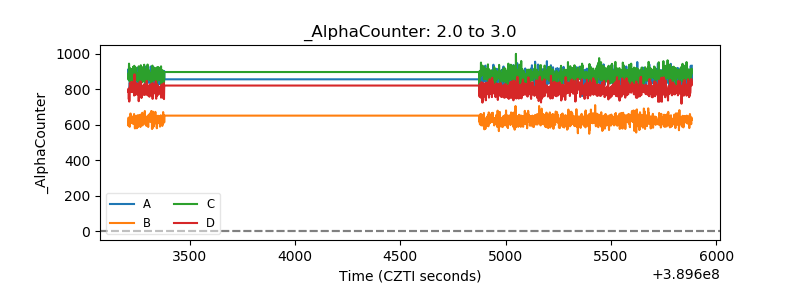 |
| _CPM_Rate | 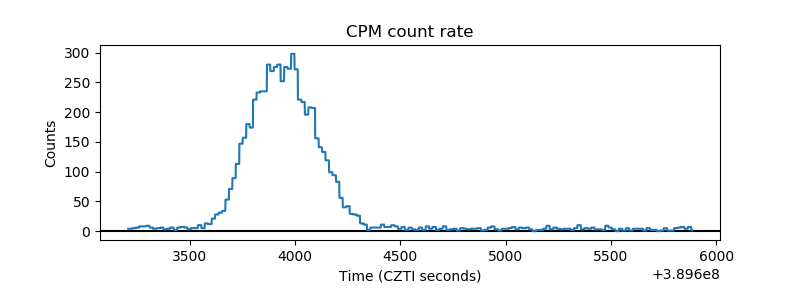 |
| CZT Counter | 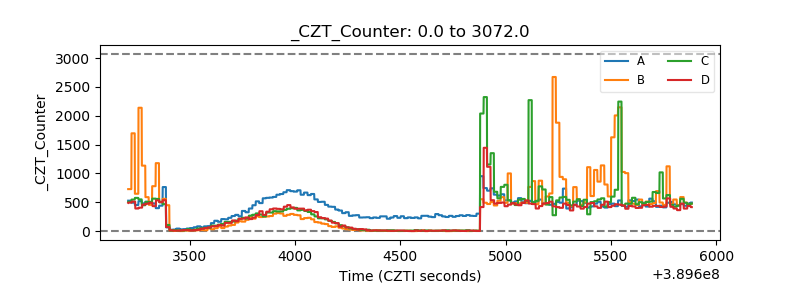 |
| +2.5 Volts monitor | 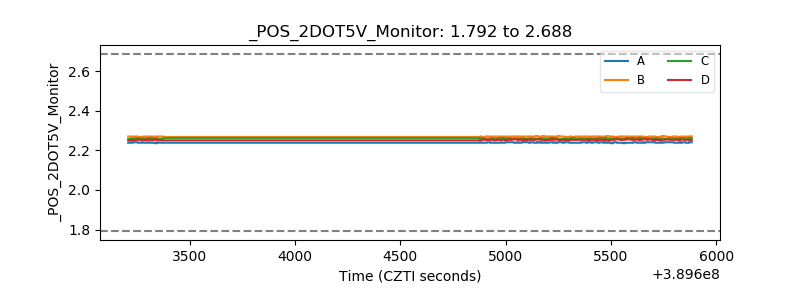 |
| +5 Volts monitor | 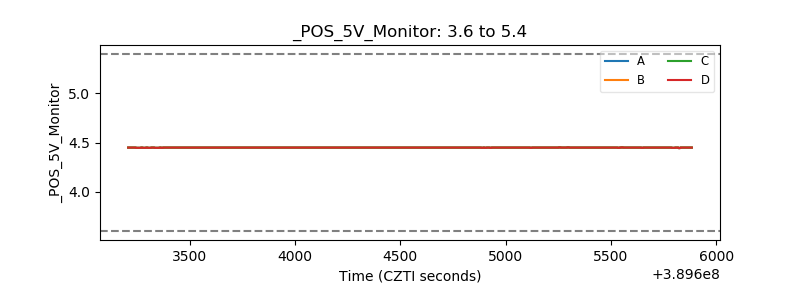 |
| _ROLL_ROT | 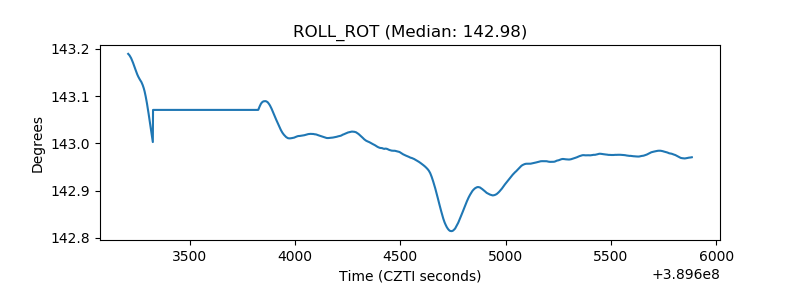 |
| _Roll_DEC | 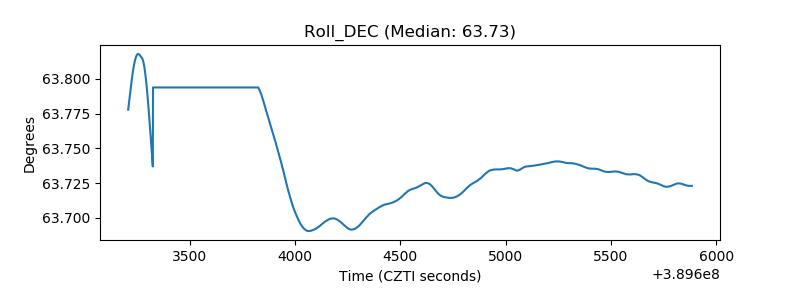 |
| _Roll_RA | 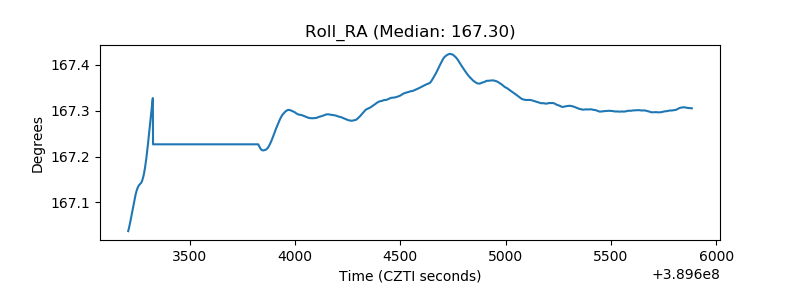 |
| Veto Counter | 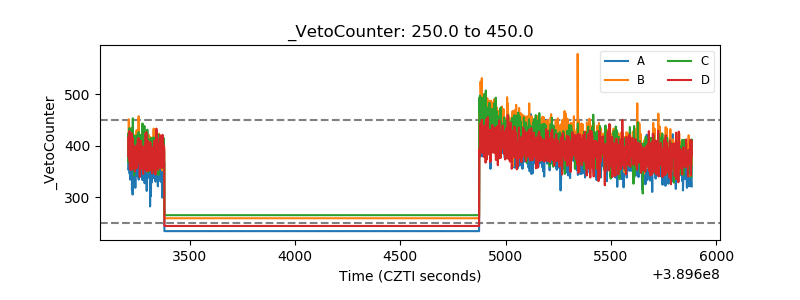 |