| Param | Original file | Final file |
|---|---|---|
| Filename | modeM0/AS1A09_143T04_9000005120cztM0_level2_bc.evt | modeM0/AS1A09_143T04_9000005120cztM0_level2_quad_clean.evt |
| Size (bytes) | 560,367,360 | 226,094,400 |
| Size | 534.4 MB | 215.6 MB |
| Events in quadrant A | 3,038,557 | 1,522,150 |
| Events in quadrant B | 3,673,340 | 1,516,408 |
| Events in quadrant C | 4,539,505 | 1,475,472 |
| Events in quadrant D | 4,815,381 | 1,423,303 |
| Mode M0 | |||
|---|---|---|---|
| Quadrant | BADHDUFLAG | Total packets | Discarded packets |
| A | 0 | 27219 | 0 |
| B | 0 | 30394 | 0 |
| C | 0 | 31849 | 0 |
| D | 0 | 32851 | 0 |
| Mode SS | |||
|---|---|---|---|
| Quadrant | BADHDUFLAG | Total packets | Discarded packets |
| A | 0 | 272 | 0 |
| B | 0 | 272 | 0 |
| C | 0 | 272 | 0 |
| D | 0 | 272 | 0 |
| Mode M9 | |||
|---|---|---|---|
| Quadrant | BADHDUFLAG | Total packets | Discarded packets |
| A | 0 | 48 | 0 |
| B | 0 | 48 | 0 |
| C | 0 | 48 | 0 |
| D | 0 | 48 | 0 |
| Quadrant | Total seconds | Saturated seconds | Saturation percentage |
|---|---|---|---|
| A | 13181 | 11 | 0.083453% |
| B | 13181 | 288 | 2.184963% |
| C | 13181 | 299 | 2.268417% |
| D | 13181 | 143 | 1.084895% |
Noise dominated data is calculated using 1-second bins in cleaned event files. If a bin has >2000 counts, and if more than 50% of those come from <1% of pixels, then it is considered to be noise-dominated and hence unusable.
| Quadrant | # 1 sec bins | Bins with >0 counts | Bins with >2000 counts | High rate bins dominated by noise | Noise dominated (total time) | Noise dominated (detector-on time) | Marked lightcurve |
|---|---|---|---|---|---|---|---|
| A | 18021 | 13184 | 0 | 0 | 0.00% | 0.00% | 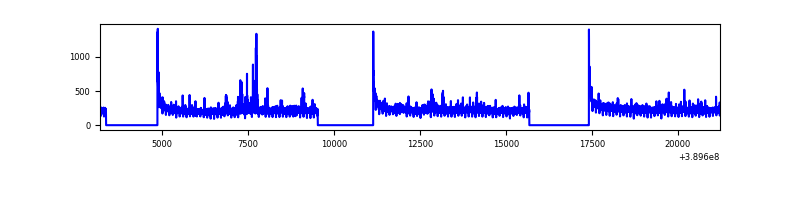 |
| B | 18021 | 13182 | 17 | 17 | 0.09% | 0.13% | 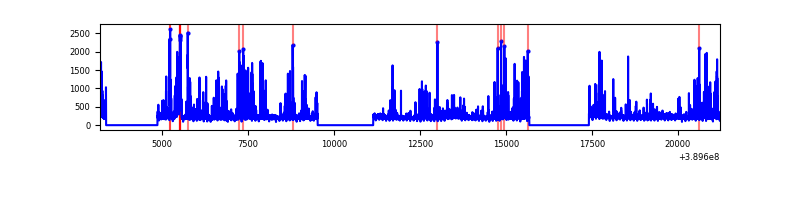 |
| C | 18021 | 13180 | 90 | 90 | 0.50% | 0.68% | 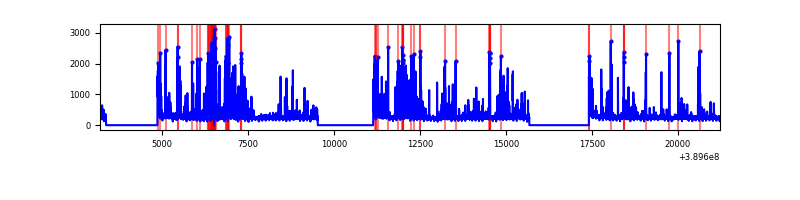 |
| D | 18021 | 13181 | 41 | 41 | 0.23% | 0.31% | 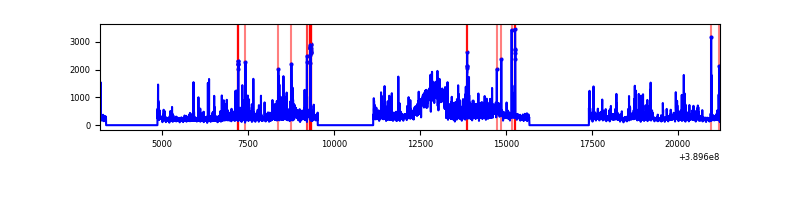 |
Top three noisy pixels from each quadrant. If the there are fewer than three noisy pixels in the level2.evt file, extra rows are filled as -1
| Pixel properties | Quadrant properties | ||||||
|---|---|---|---|---|---|---|---|
| Quadrant | DetID | PixID | Counts | Sigma | Mean | Median | Sigma |
| A | 10 | 83 | 294472 | 1937.97 | 673 | 661 | 151.6 |
| A | 7 | 3 | 38197 | 247.59 | 673 | 661 | 151.6 |
| A | 13 | 6 | 35937 | 232.68 | 673 | 661 | 151.6 |
| B | 5 | 172 | 544959 | 4036.01 | 669 | 655 | 134.9 |
| B | 5 | 255 | 265502 | 1963.84 | 669 | 655 | 134.9 |
| B | 0 | 218 | 49641 | 363.23 | 669 | 655 | 134.9 |
| C | 0 | 207 | 841429 | 5618.74 | 646 | 640 | 149.6 |
| C | 15 | 214 | 523961 | 3497.2 | 646 | 640 | 149.6 |
| C | 0 | 10 | 354637 | 2365.65 | 646 | 640 | 149.6 |
| D | 10 | 203 | 1338665 | 8362.33 | 658 | 637 | 160.0 |
| D | 13 | 249 | 213680 | 1331.46 | 658 | 637 | 160.0 |
| D | 2 | 153 | 139218 | 866.1 | 658 | 637 | 160.0 |
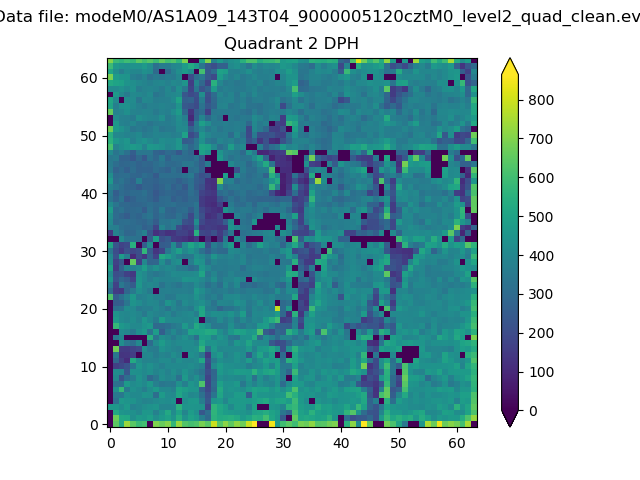
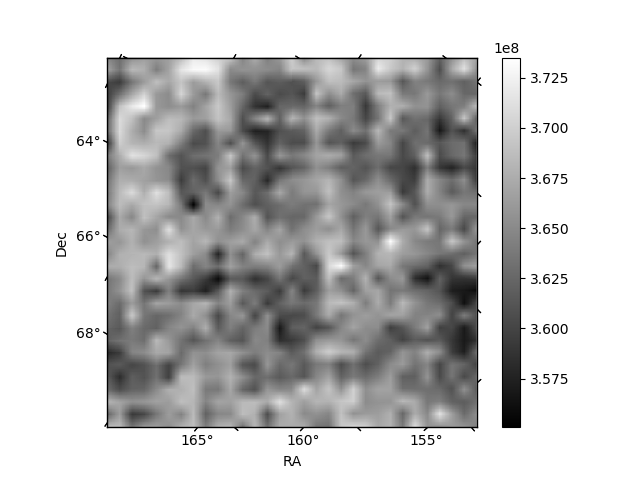
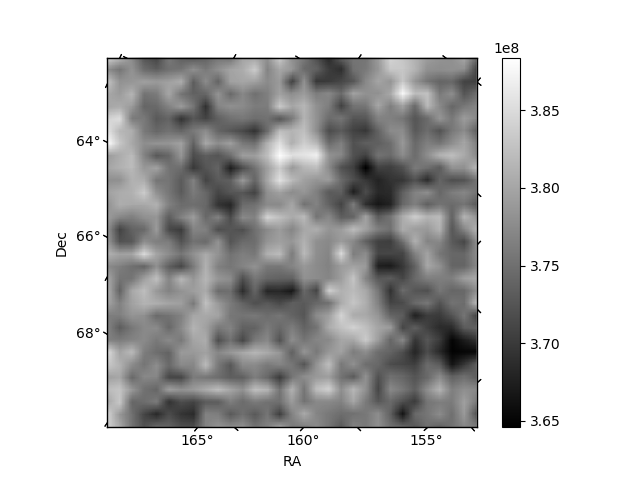
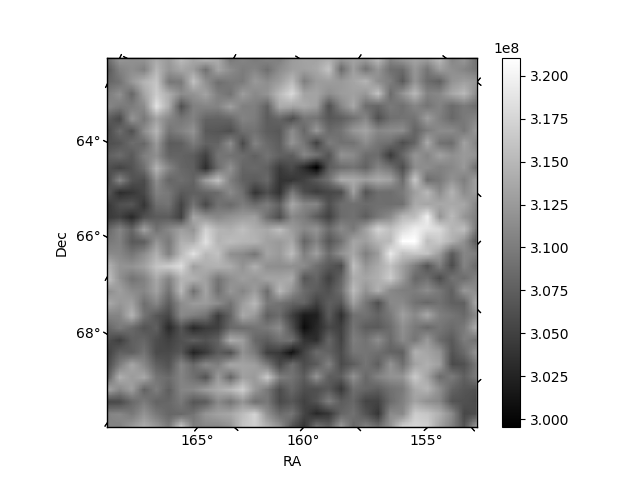
Histogram calculated using DETX and DETY for each event in the final _common_clean file
| Quadrant A | 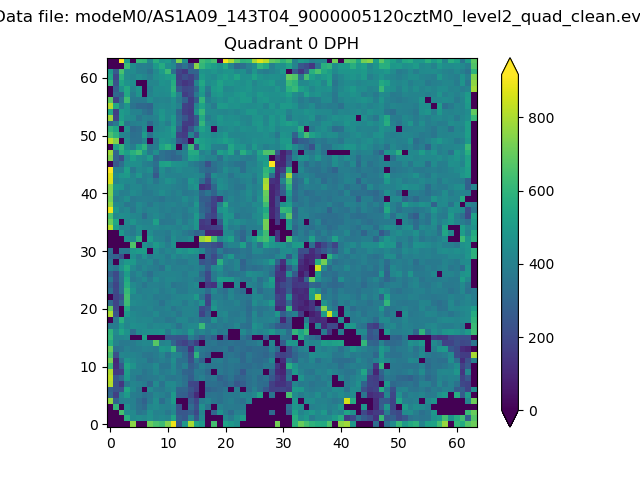 |
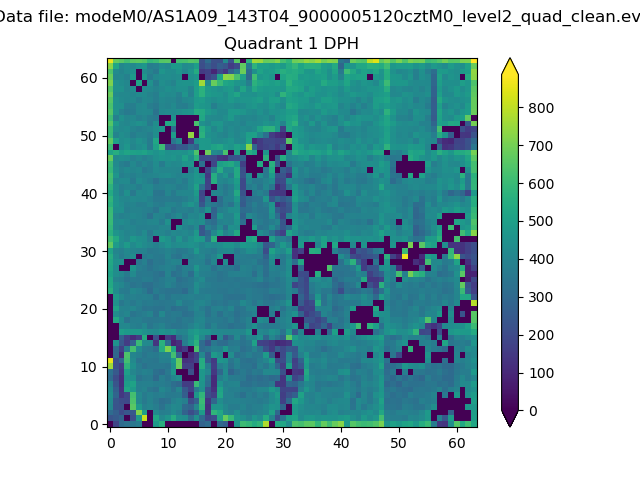 |
Quadrant B |
|---|---|---|---|
| Quadrant D | 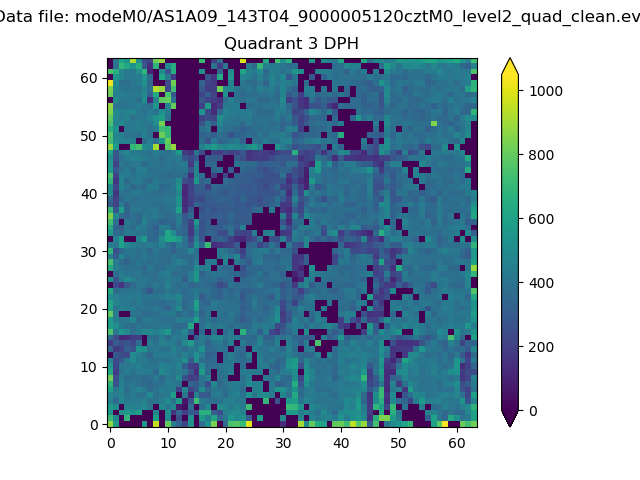 |
 |
Quadrant C |
| Plot type | Count rate plots | Images |
|---|---|---|
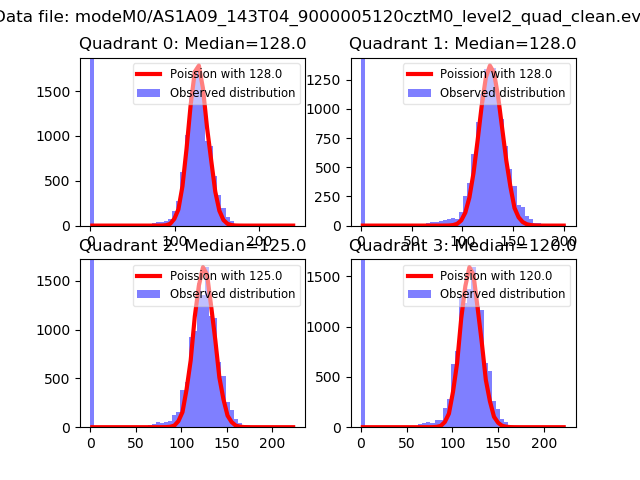
| Comparison with Poisson distribution Blue bars denote a histogram of data divided into 1 sec bins. Red curve is a Poisson curve with rate = median count rate of data. |
 |
 |
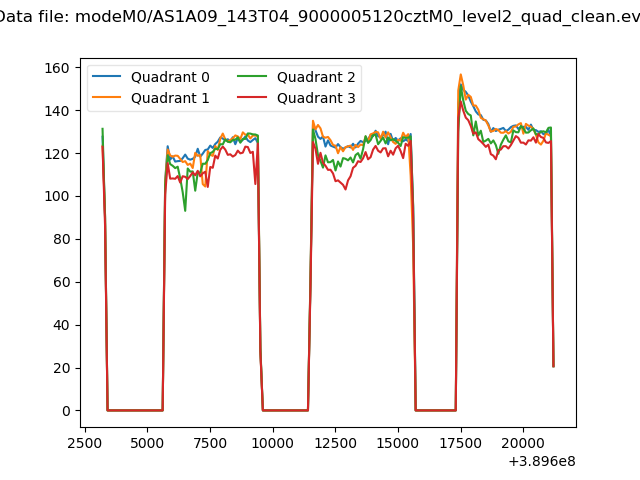
| Quadrant-wise count rates Data is divided into 100 sec bins |
 |
|
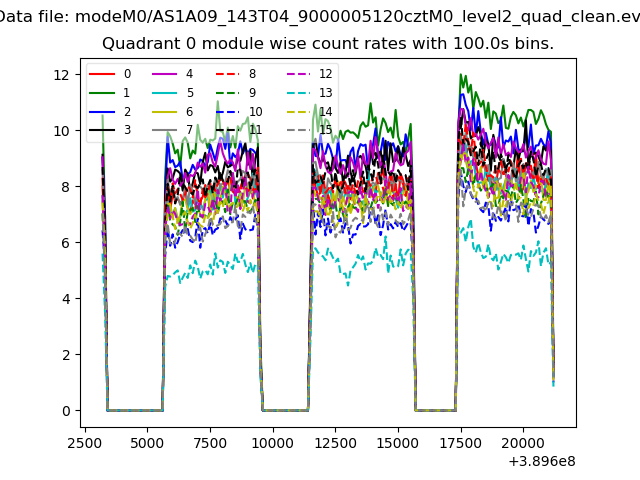
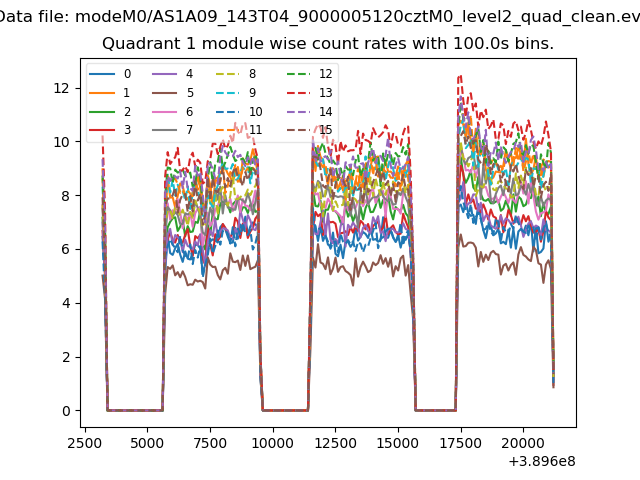
| Module-wise count rates for Quadrant A Data is divided into 100 sec bins |
 |
 |
| Module-wise count rates for Quadrant B Data is divided into 100 sec bins |
 |
 |
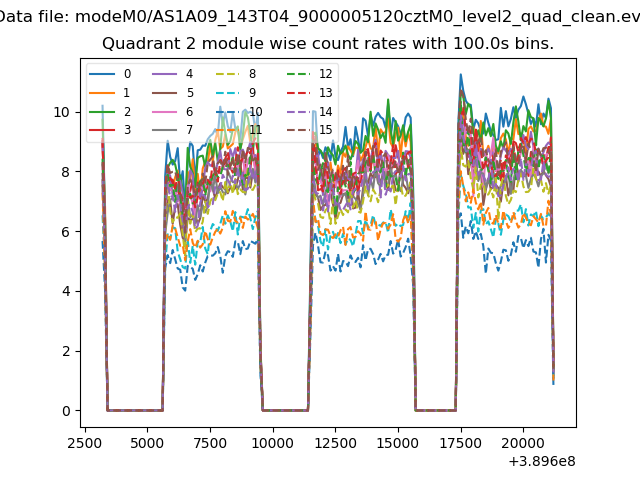
| Module-wise count rates for Quadrant C Data is divided into 100 sec bins |
 |
 |
| Module-wise count rates for Quadrant D Data is divided into 100 sec bins |
 |
 |
| Parameter | Plot |
|---|---|
| CZT HV Monitor | 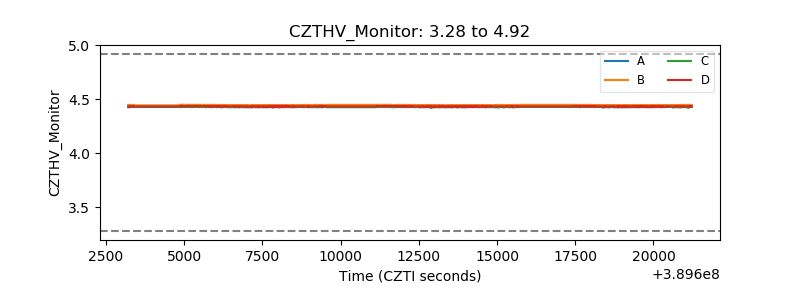 |
| D_VDD | 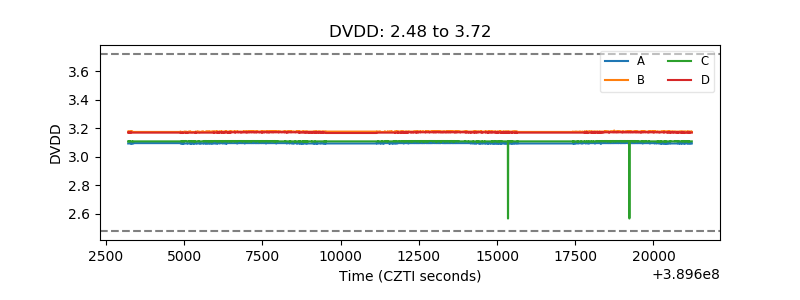 |
| Temperature 1 | 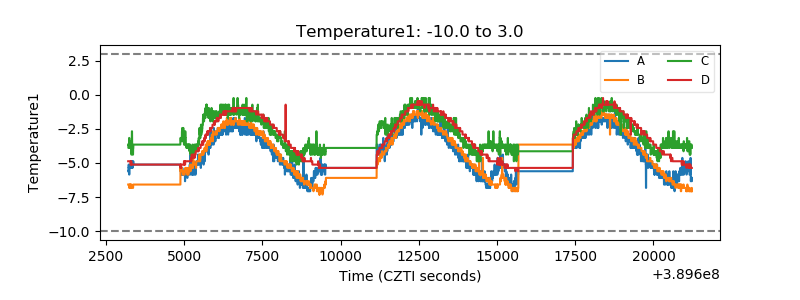 |
| Veto HV Monitor | 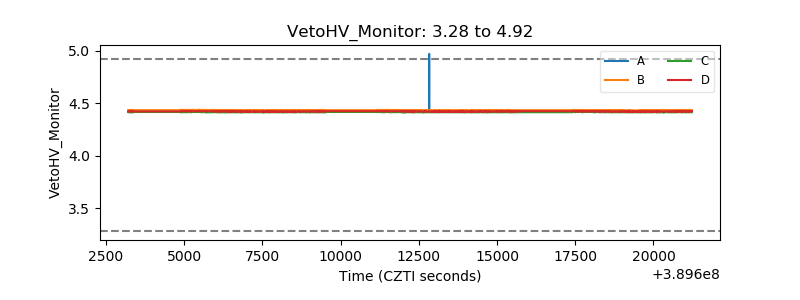 |
| Veto LLD | 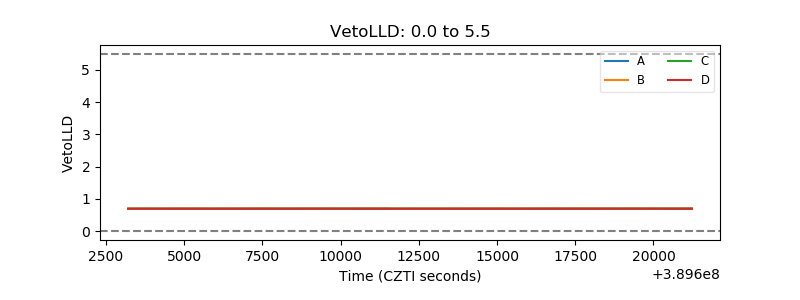 |
| Alpha Counter | 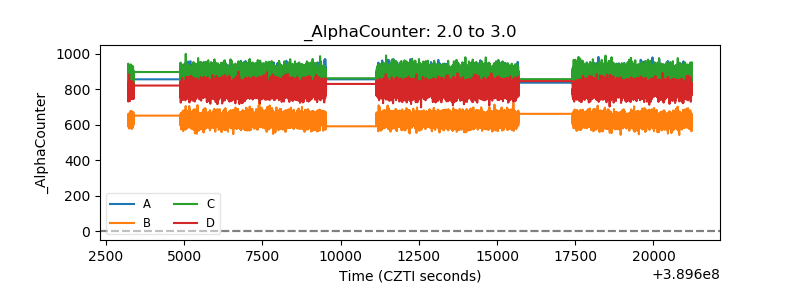 |
| _CPM_Rate | 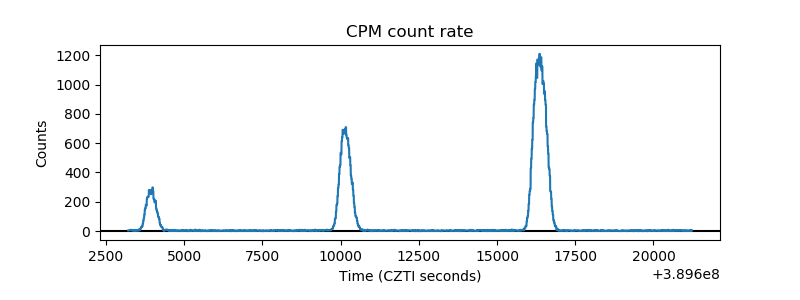 |
| CZT Counter | 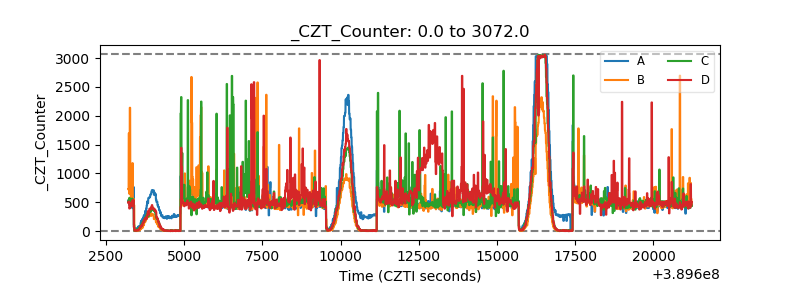 |
| +2.5 Volts monitor | 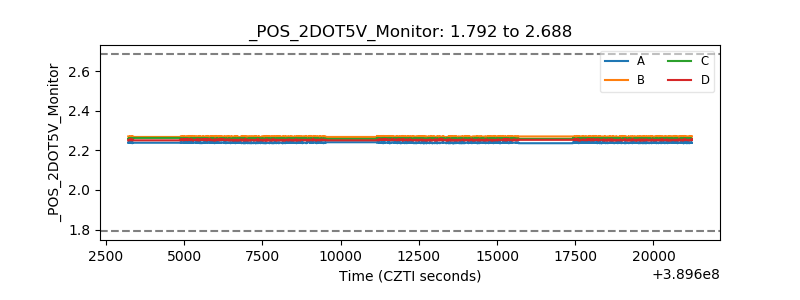 |
| +5 Volts monitor | 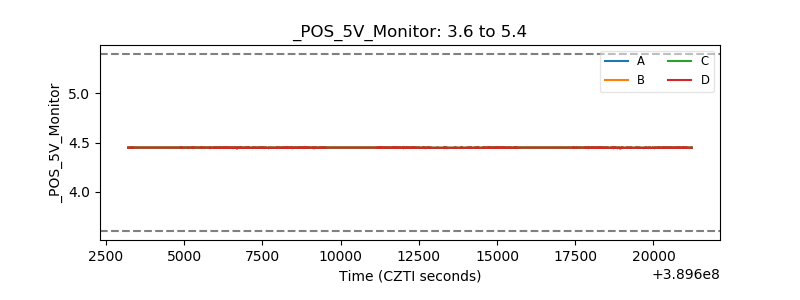 |
| _ROLL_ROT | 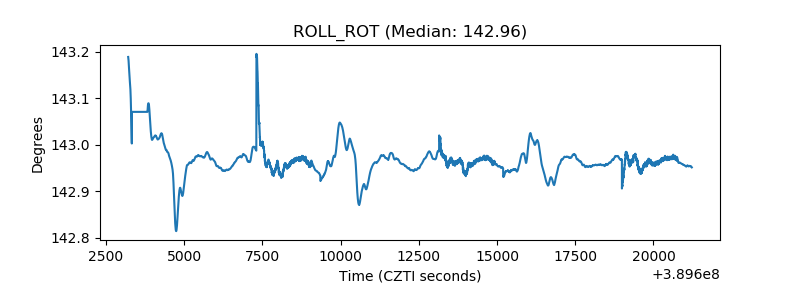 |
| _Roll_DEC | 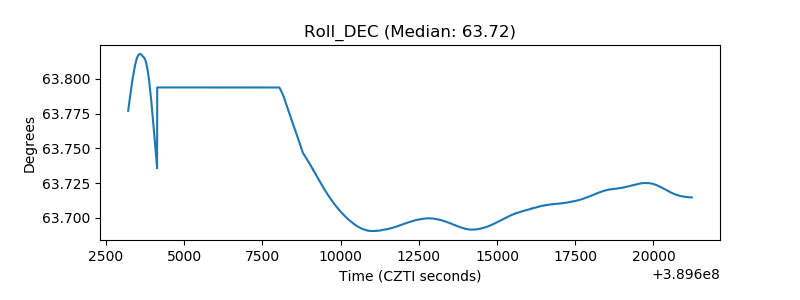 |
| _Roll_RA |  |
| Veto Counter | 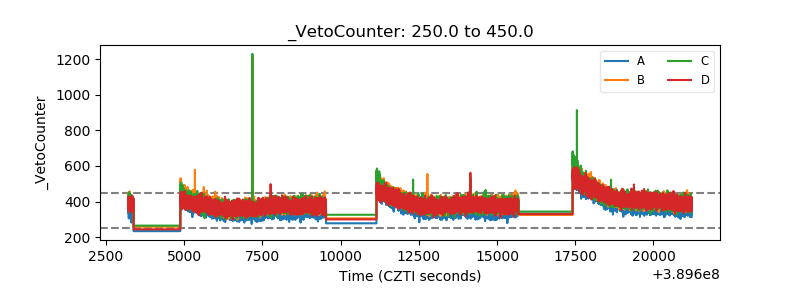 |