| Param | Original file | Final file |
|---|---|---|
| Filename | modeM0/AS1A09_029T05_9000005124_35728cztM0_level2.evt | modeM0/AS1A09_029T05_9000005124_35728cztM0_level2_quad_clean.evt |
| Size (bytes) | 367,361,280 | 63,636,480 |
| Size | 350.3 MB | 60.7 MB |
| Events in quadrant A | 2,426,137 | 401,301 |
| Events in quadrant B | 2,587,372 | 405,576 |
| Events in quadrant C | 2,760,592 | 388,168 |
| Events in quadrant D | 3,004,399 | 374,240 |
| Mode SS | |||
|---|---|---|---|
| Quadrant | BADHDUFLAG | Total packets | Discarded packets |
| A | 0 | 104 | 0 |
| B | 0 | 104 | 0 |
| C | 0 | 104 | 0 |
| D | 0 | 104 | 0 |
| Mode M0 | |||
|---|---|---|---|
| Quadrant | BADHDUFLAG | Total packets | Discarded packets |
| A | 0 | 10516 | 3 |
| B | 0 | 11046 | 2 |
| C | 0 | 11347 | 2 |
| D | 0 | 12542 | 2 |
| Mode M9 | |||
|---|---|---|---|
| Quadrant | BADHDUFLAG | Total packets | Discarded packets |
| A | 0 | 26 | 0 |
| B | 0 | 26 | 0 |
| C | 0 | 26 | 0 |
| D | 0 | 27 | 0 |
| Quadrant | Total seconds | Saturated seconds | Saturation percentage |
|---|---|---|---|
| A | 5099 | 9 | 0.176505% |
| B | 5099 | 43 | 0.843303% |
| C | 5099 | 71 | 1.392430% |
| D | 5099 | 92 | 1.804275% |
Noise dominated data is calculated using 1-second bins in cleaned event files. If a bin has >2000 counts, and if more than 50% of those come from <1% of pixels, then it is considered to be noise-dominated and hence unusable.
| Quadrant | # 1 sec bins | Bins with >0 counts | Bins with >2000 counts | High rate bins dominated by noise | Noise dominated (total time) | Noise dominated (detector-on time) | Marked lightcurve |
|---|---|---|---|---|---|---|---|
| A | 6982 | 5100 | 1 | 1 | 0.01% | 0.02% | 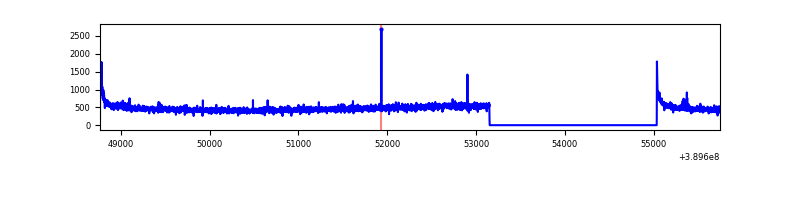 |
| B | 6982 | 5100 | 26 | 26 | 0.37% | 0.51% | 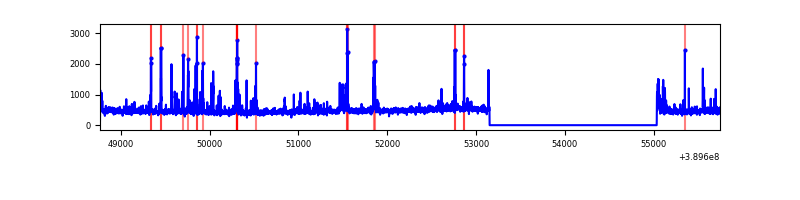 |
| C | 6982 | 5100 | 70 | 70 | 1.00% | 1.37% | 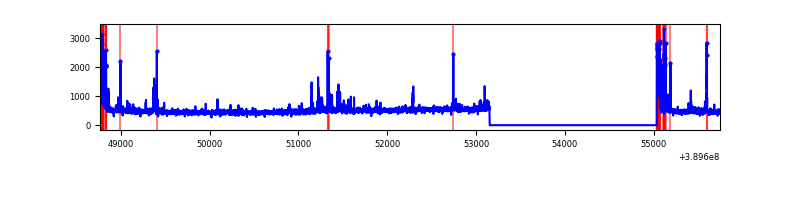 |
| D | 6982 | 5100 | 98 | 98 | 1.40% | 1.92% | 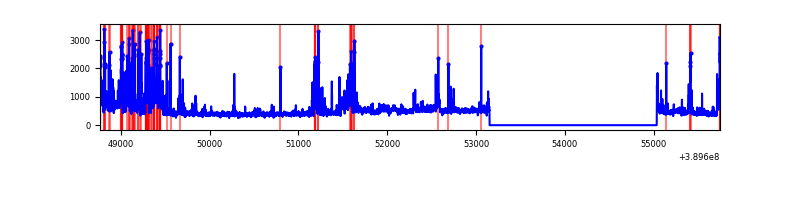 |
Top three noisy pixels from each quadrant. If the there are fewer than three noisy pixels in the level2.evt file, extra rows are filled as -1
| Pixel properties | Quadrant properties | ||||||
|---|---|---|---|---|---|---|---|
| Quadrant | DetID | PixID | Counts | Sigma | Mean | Median | Sigma |
| A | 10 | 83 | 142676 | 1199.99 | 579 | 568 | 118.4 |
| A | 13 | 6 | 18129 | 148.29 | 579 | 568 | 118.4 |
| A | 7 | 48 | 11145 | 89.31 | 579 | 568 | 118.4 |
| B | 5 | 172 | 203552 | 1835.43 | 576 | 560 | 110.6 |
| B | 5 | 255 | 55947 | 500.8 | 576 | 560 | 110.6 |
| B | 4 | 81 | 30457 | 270.33 | 576 | 560 | 110.6 |
| C | 0 | 10 | 219430 | 1680.29 | 555 | 558 | 130.3 |
| C | 15 | 214 | 214393 | 1641.62 | 555 | 558 | 130.3 |
| C | 9 | 187 | 72126 | 549.43 | 555 | 558 | 130.3 |
| D | 14 | 52 | 404931 | 2944.52 | 555 | 539 | 137.3 |
| D | 13 | 249 | 167848 | 1218.24 | 555 | 539 | 137.3 |
| D | 2 | 120 | 105515 | 764.37 | 555 | 539 | 137.3 |
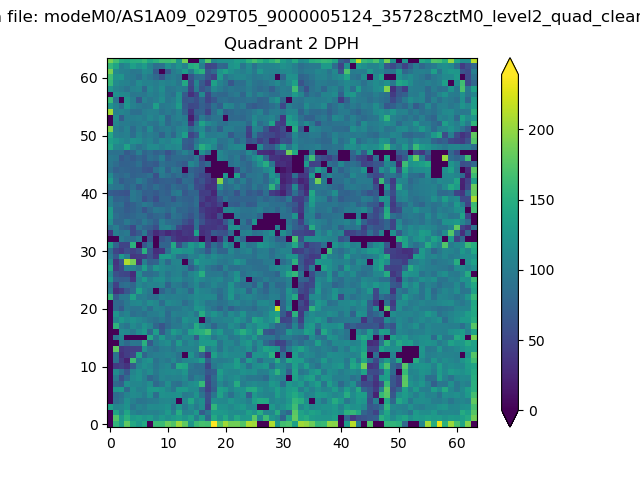
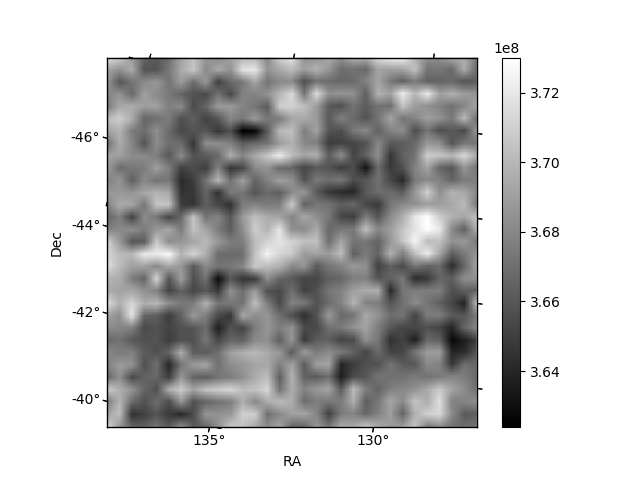
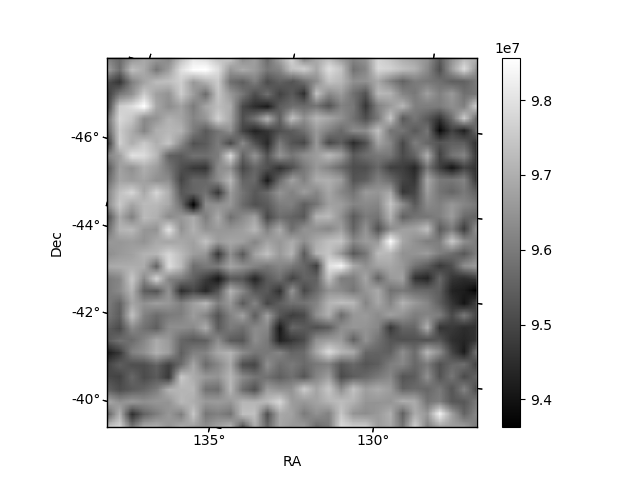
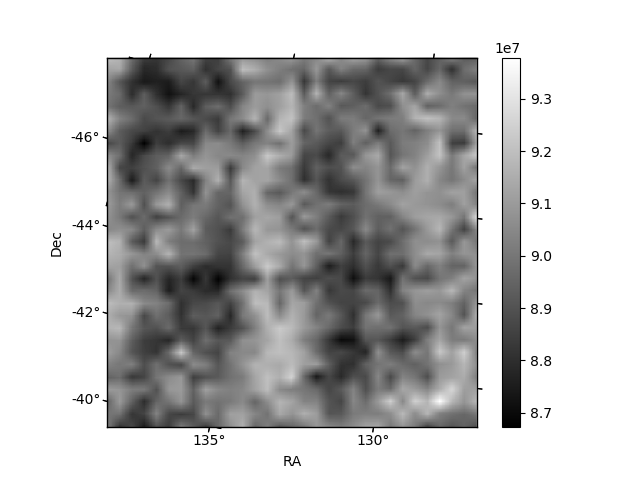
Histogram calculated using DETX and DETY for each event in the final _common_clean file
| Quadrant A | 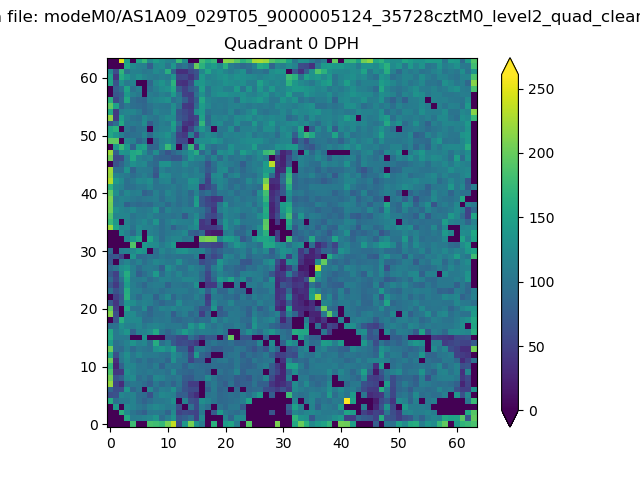 |
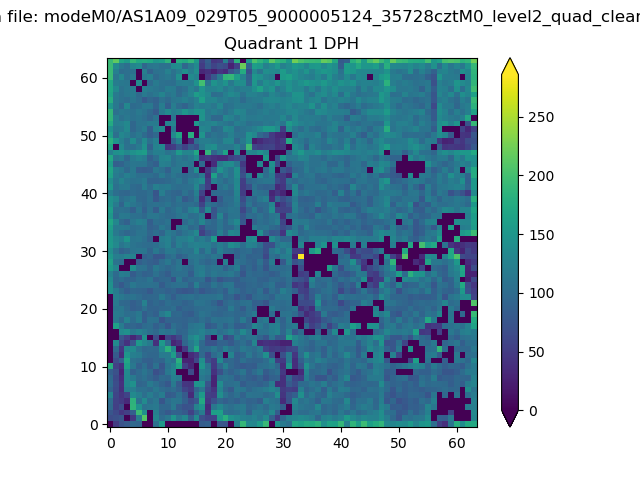 |
Quadrant B |
|---|---|---|---|
| Quadrant D | 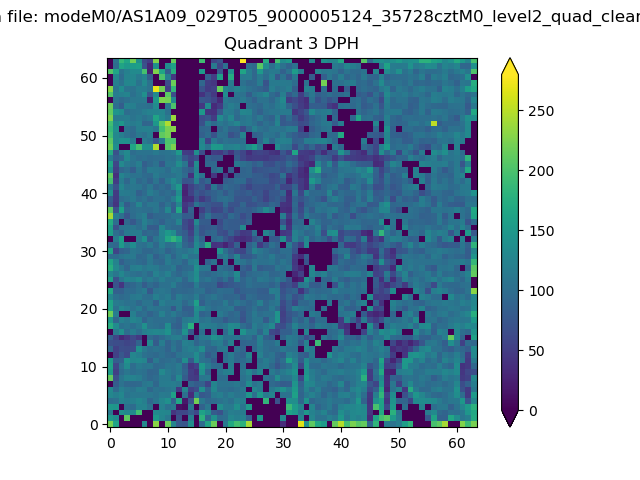 |
 |
Quadrant C |
| Plot type | Count rate plots | Images |
|---|---|---|
| Comparison with Poisson distribution Blue bars denote a histogram of data divided into 1 sec bins. Red curve is a Poisson curve with rate = median count rate of data. |
 |
 |
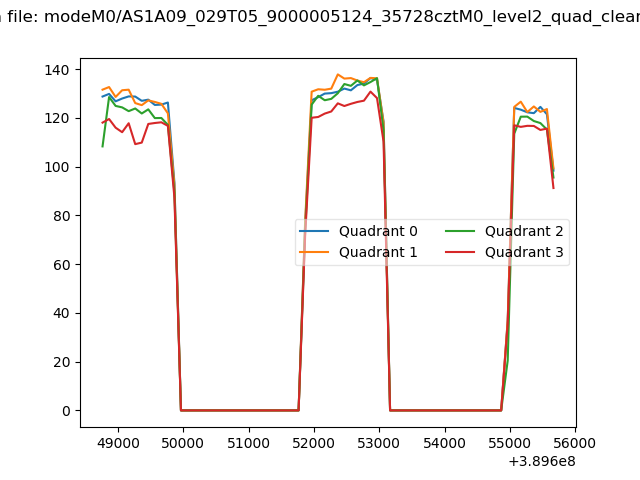
| Quadrant-wise count rates Data is divided into 100 sec bins |
 |
|
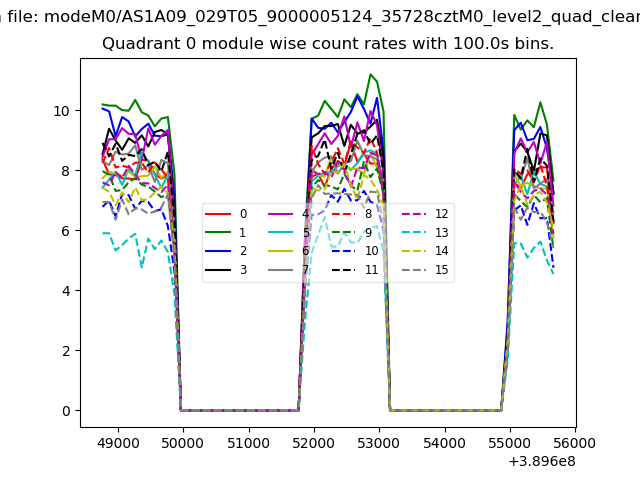
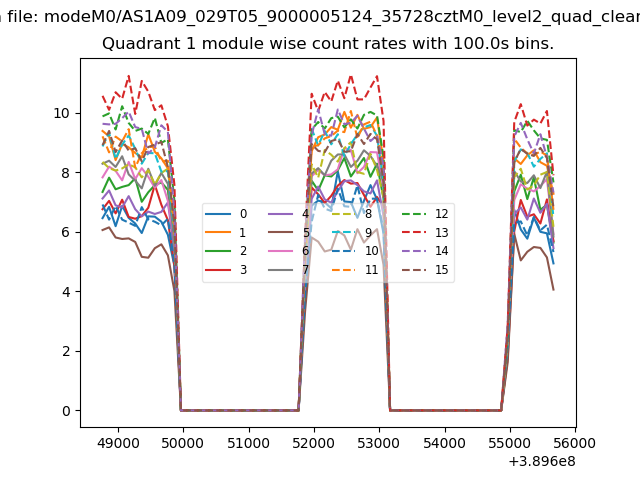
| Module-wise count rates for Quadrant A Data is divided into 100 sec bins |
 |
 |
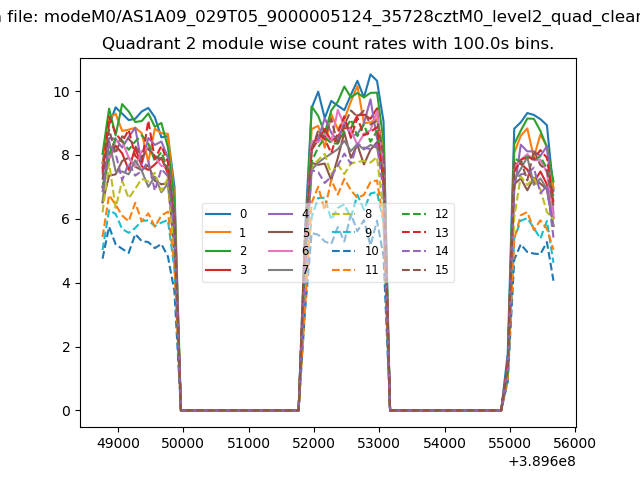
| Module-wise count rates for Quadrant B Data is divided into 100 sec bins |
 |
 |
| Module-wise count rates for Quadrant C Data is divided into 100 sec bins |
 |
 |
| Module-wise count rates for Quadrant D Data is divided into 100 sec bins |
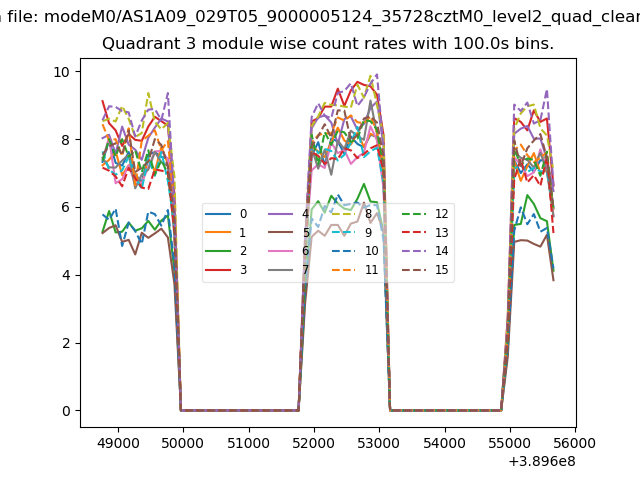 |
 |
| Parameter | Plot |
|---|---|
| CZT HV Monitor | 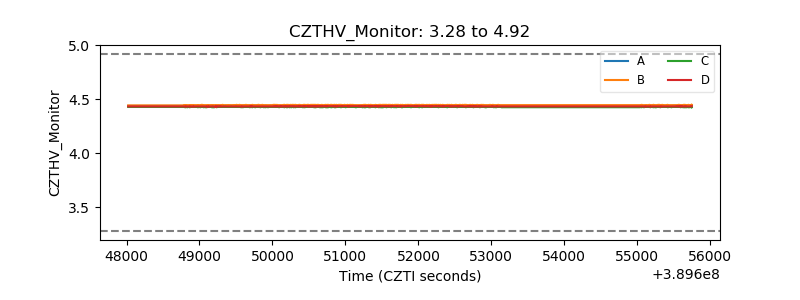 |
| D_VDD | 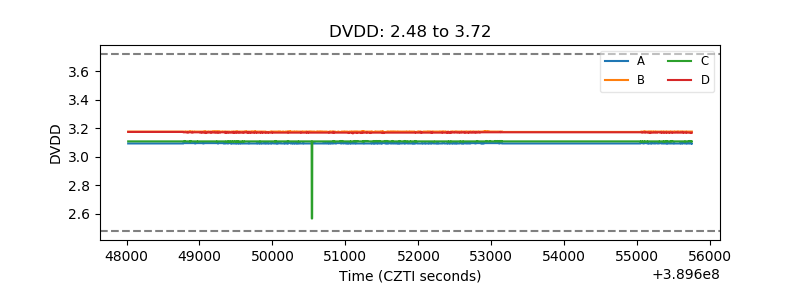 |
| Temperature 1 | 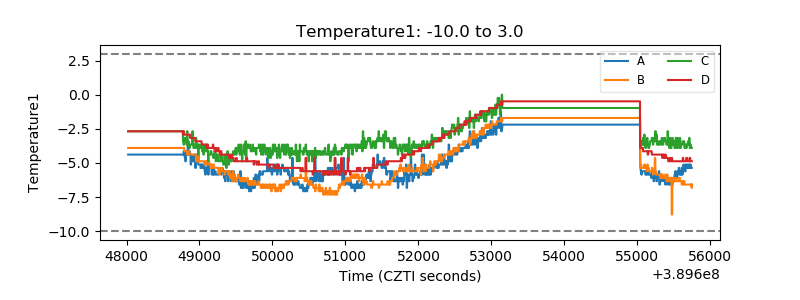 |
| Veto HV Monitor | 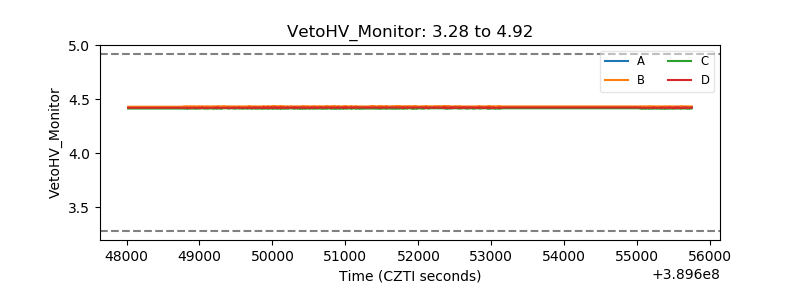 |
| Veto LLD | 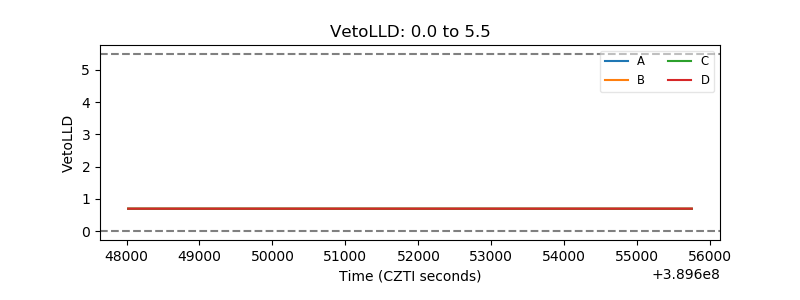 |
| Alpha Counter | 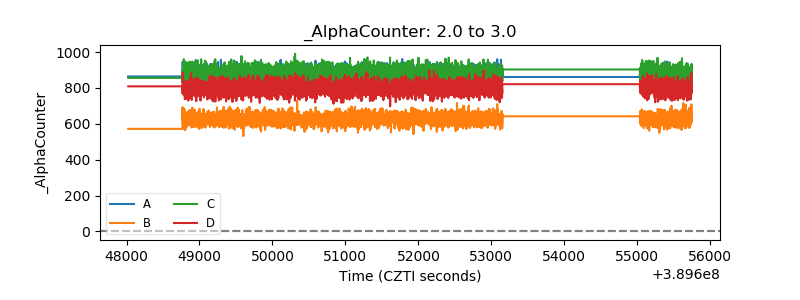 |
| _CPM_Rate | 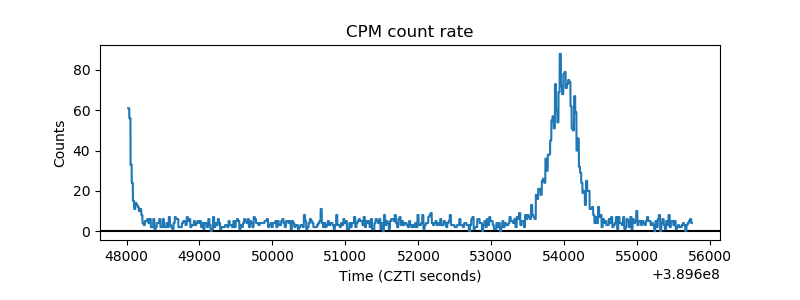 |
| CZT Counter | 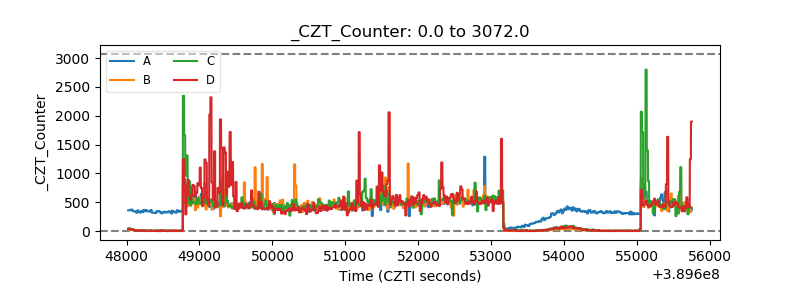 |
| +2.5 Volts monitor | 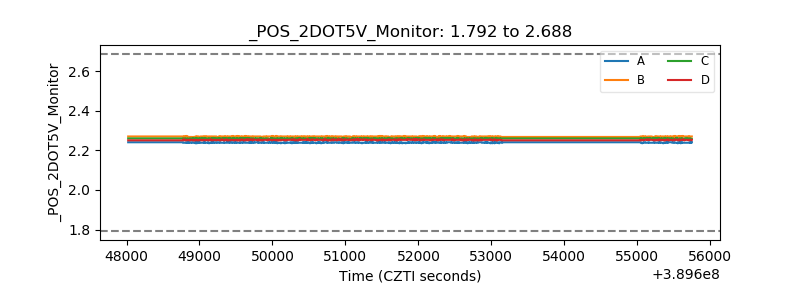 |
| +5 Volts monitor | 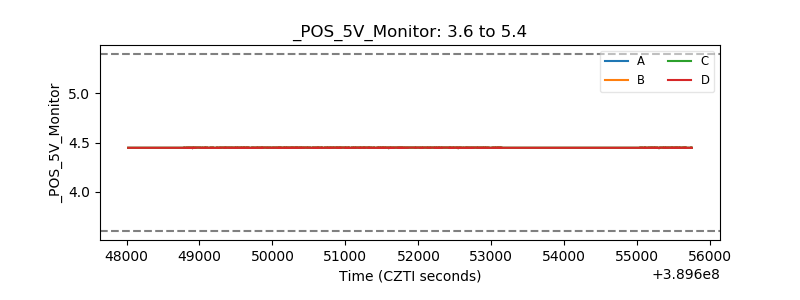 |
| _ROLL_ROT | 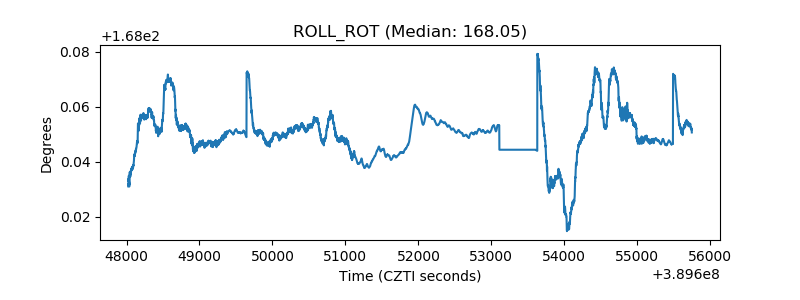 |
| _Roll_DEC | 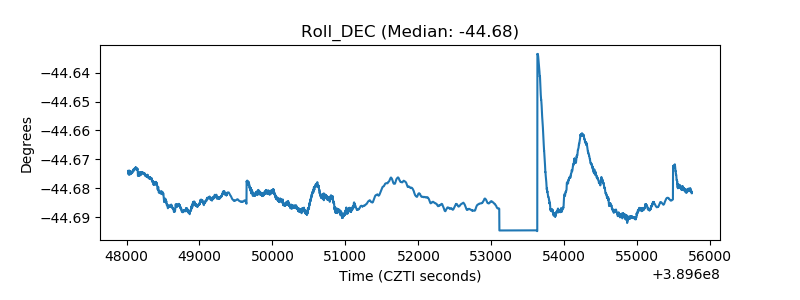 |
| _Roll_RA | 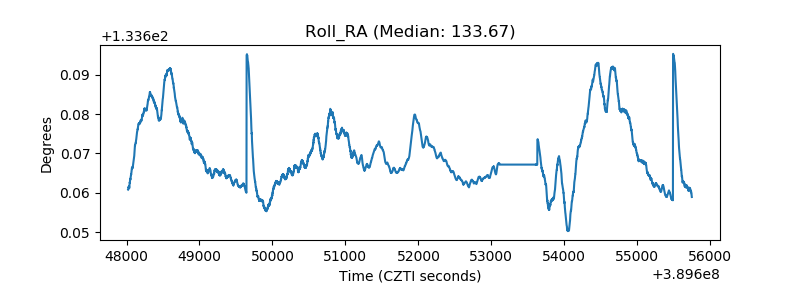 |
| Veto Counter | 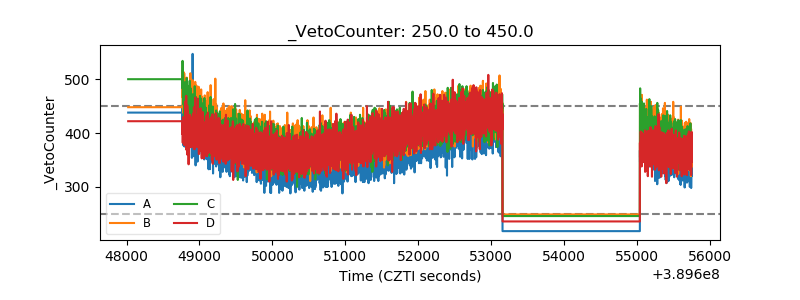 |