| Param | Original file | Final file |
|---|---|---|
| Filename | modeM0/AS1A09_029T05_9000005124_35726cztM0_level2.evt | modeM0/AS1A09_029T05_9000005124_35726cztM0_level2_quad_clean.evt |
| Size (bytes) | 384,111,360 | 65,301,120 |
| Size | 366.3 MB | 62.3 MB |
| Events in quadrant A | 2,448,102 | 420,577 |
| Events in quadrant B | 2,656,103 | 420,514 |
| Events in quadrant C | 3,373,768 | 397,521 |
| Events in quadrant D | 2,819,116 | 392,234 |
| Mode SS | |||
|---|---|---|---|
| Quadrant | BADHDUFLAG | Total packets | Discarded packets |
| A | 0 | 100 | 0 |
| B | 0 | 100 | 0 |
| C | 0 | 100 | 0 |
| D | 0 | 100 | 0 |
| Mode M0 | |||
|---|---|---|---|
| Quadrant | BADHDUFLAG | Total packets | Discarded packets |
| A | 0 | 10329 | 3 |
| B | 0 | 10914 | 2 |
| C | 0 | 13329 | 2 |
| D | 0 | 11661 | 2 |
| Mode M9 | |||
|---|---|---|---|
| Quadrant | BADHDUFLAG | Total packets | Discarded packets |
| A | 0 | 28 | 0 |
| B | 0 | 28 | 0 |
| C | 0 | 28 | 0 |
| D | 0 | 29 | 0 |
| Quadrant | Total seconds | Saturated seconds | Saturation percentage |
|---|---|---|---|
| A | 4940 | 11 | 0.222672% |
| B | 4940 | 67 | 1.356275% |
| C | 4940 | 98 | 1.983806% |
| D | 4940 | 88 | 1.781377% |
Noise dominated data is calculated using 1-second bins in cleaned event files. If a bin has >2000 counts, and if more than 50% of those come from <1% of pixels, then it is considered to be noise-dominated and hence unusable.
| Quadrant | # 1 sec bins | Bins with >0 counts | Bins with >2000 counts | High rate bins dominated by noise | Noise dominated (total time) | Noise dominated (detector-on time) | Marked lightcurve |
|---|---|---|---|---|---|---|---|
| A | 7063 | 4941 | 0 | 0 | 0.00% | 0.00% | 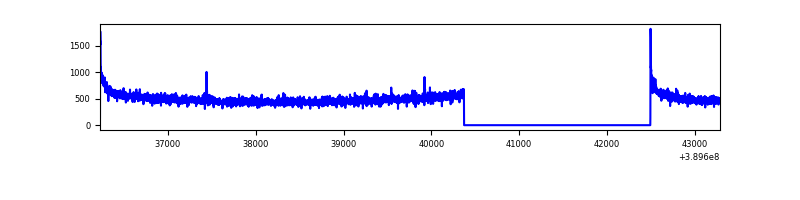 |
| B | 7063 | 4941 | 52 | 52 | 0.74% | 1.05% | 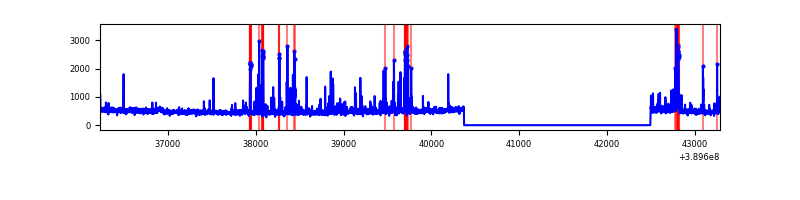 |
| C | 7063 | 4941 | 105 | 105 | 1.49% | 2.13% | 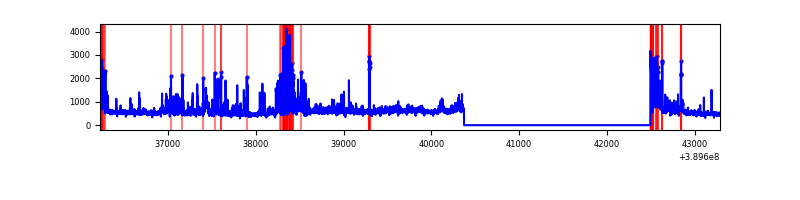 |
| D | 7063 | 4940 | 80 | 80 | 1.13% | 1.62% | 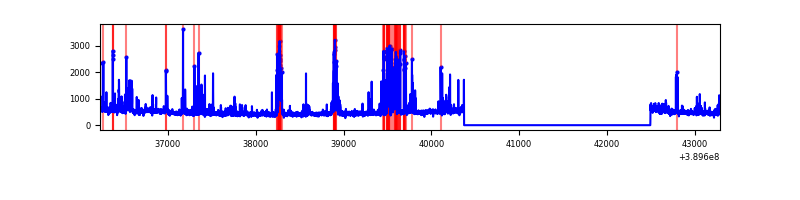 |
Top three noisy pixels from each quadrant. If the there are fewer than three noisy pixels in the level2.evt file, extra rows are filled as -1
| Pixel properties | Quadrant properties | ||||||
|---|---|---|---|---|---|---|---|
| Quadrant | DetID | PixID | Counts | Sigma | Mean | Median | Sigma |
| A | 10 | 83 | 148612 | 1256.43 | 590 | 580 | 117.8 |
| A | 13 | 254 | 8147 | 64.23 | 590 | 580 | 117.8 |
| A | 13 | 6 | 7624 | 59.79 | 590 | 580 | 117.8 |
| B | 5 | 172 | 185413 | 1666.87 | 583 | 569 | 110.9 |
| B | 15 | 85 | 49984 | 445.61 | 583 | 569 | 110.9 |
| B | 5 | 255 | 33536 | 297.29 | 583 | 569 | 110.9 |
| C | 0 | 207 | 624163 | 4845.19 | 555 | 558 | 128.7 |
| C | 15 | 214 | 208588 | 1616.32 | 555 | 558 | 128.7 |
| C | 1 | 23 | 159689 | 1236.39 | 555 | 558 | 128.7 |
| D | 13 | 249 | 240467 | 1763.24 | 559 | 543 | 136.1 |
| D | 10 | 199 | 172681 | 1265.07 | 559 | 543 | 136.1 |
| D | 2 | 249 | 94768 | 692.47 | 559 | 543 | 136.1 |
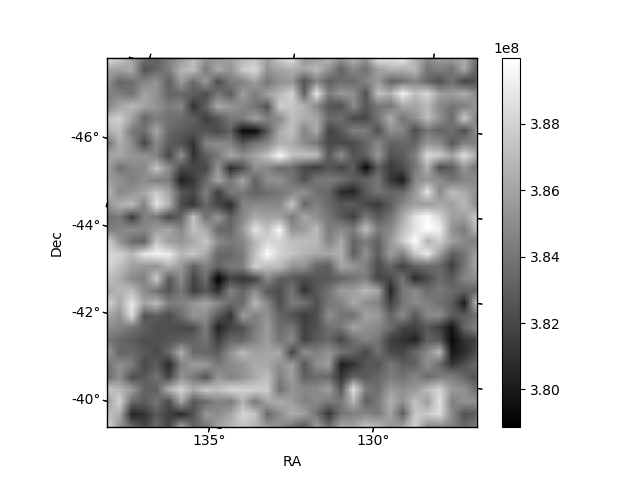
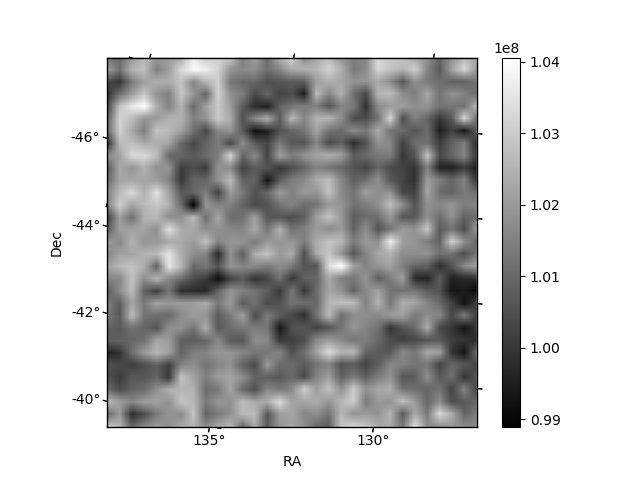
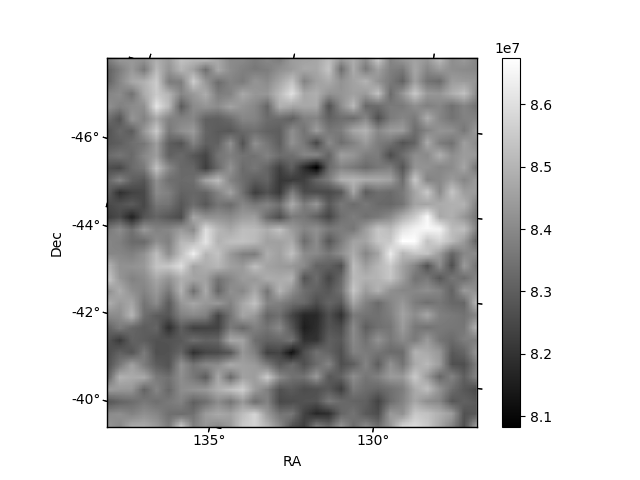
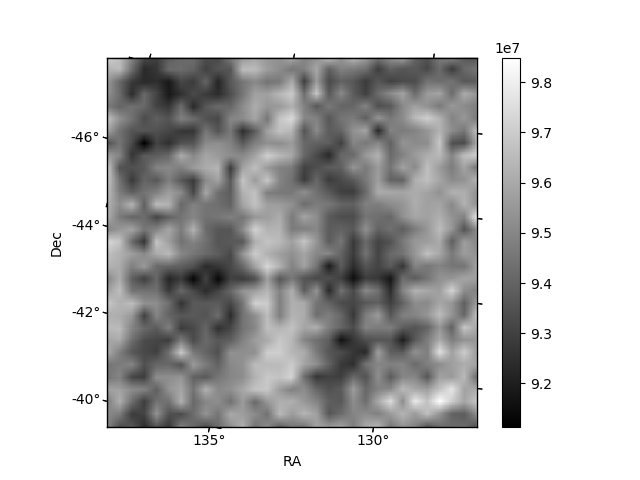
Histogram calculated using DETX and DETY for each event in the final _common_clean file
| Quadrant A | 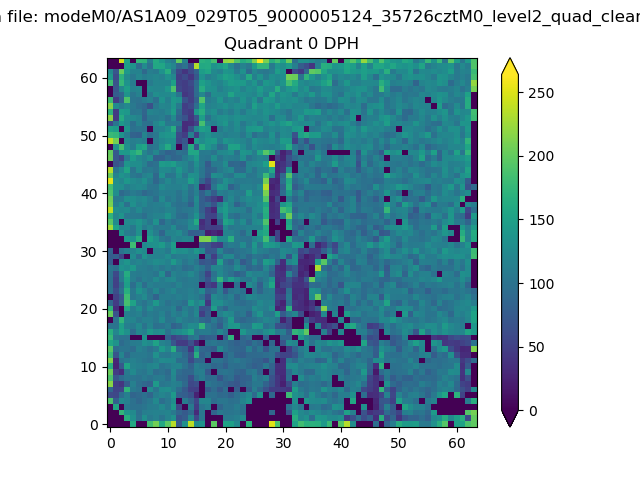 |
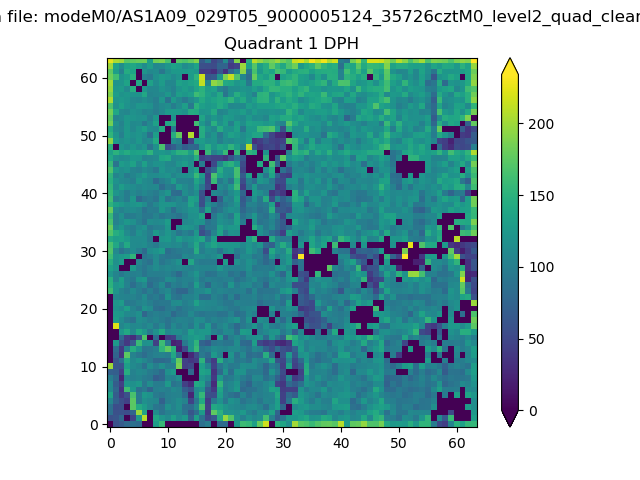 |
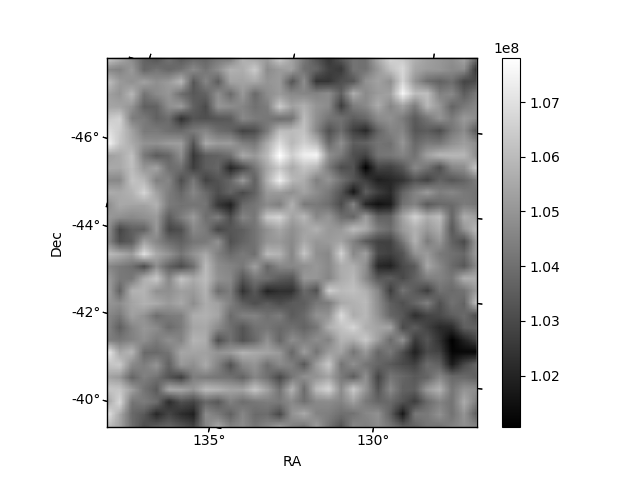
Quadrant B |
|---|---|---|---|
| Quadrant D | 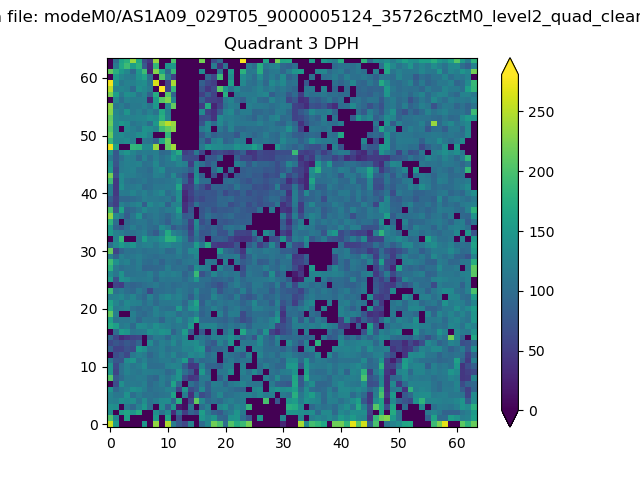 |
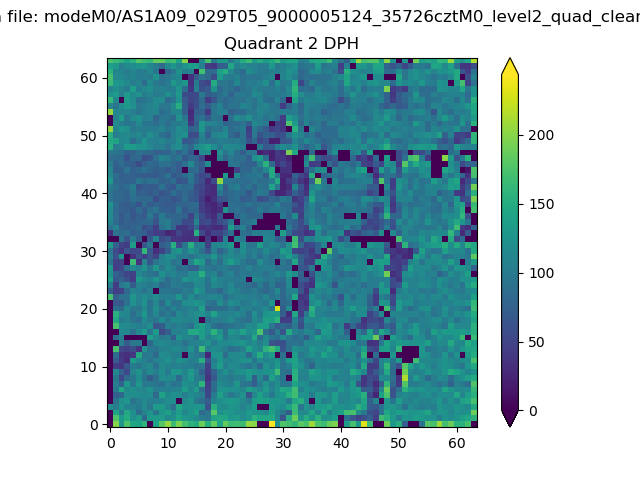 |
Quadrant C |
| Plot type | Count rate plots | Images |
|---|---|---|
| Comparison with Poisson distribution Blue bars denote a histogram of data divided into 1 sec bins. Red curve is a Poisson curve with rate = median count rate of data. |
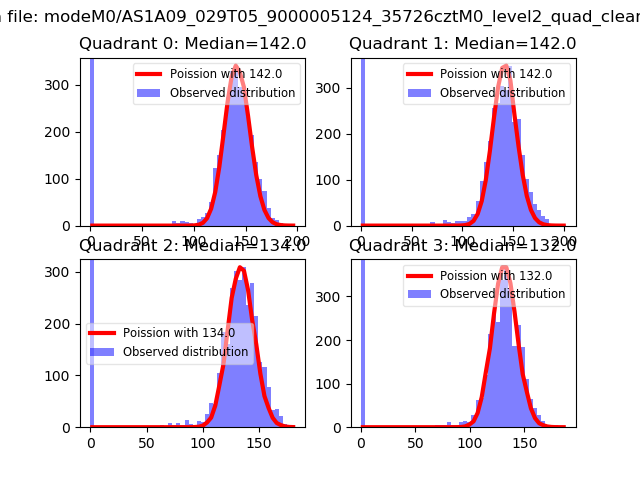 |
 |
| Quadrant-wise count rates Data is divided into 100 sec bins |
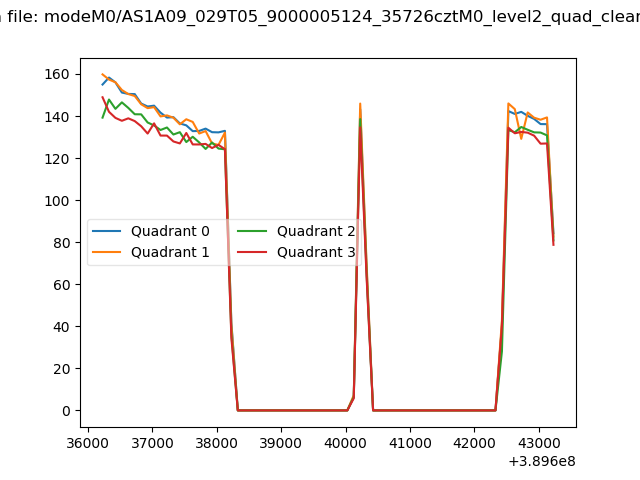 |
|
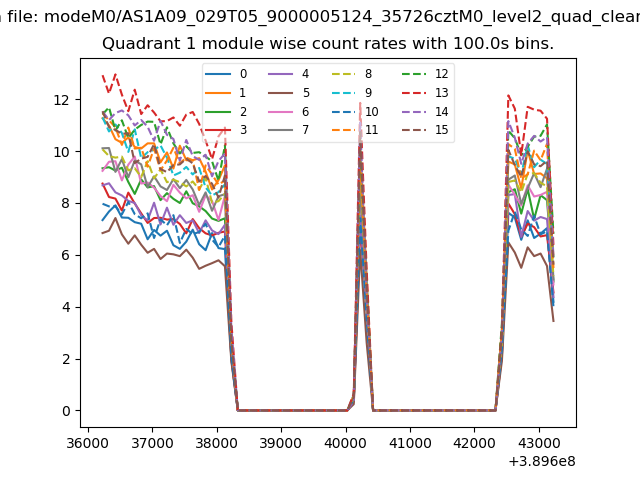
| Module-wise count rates for Quadrant A Data is divided into 100 sec bins |
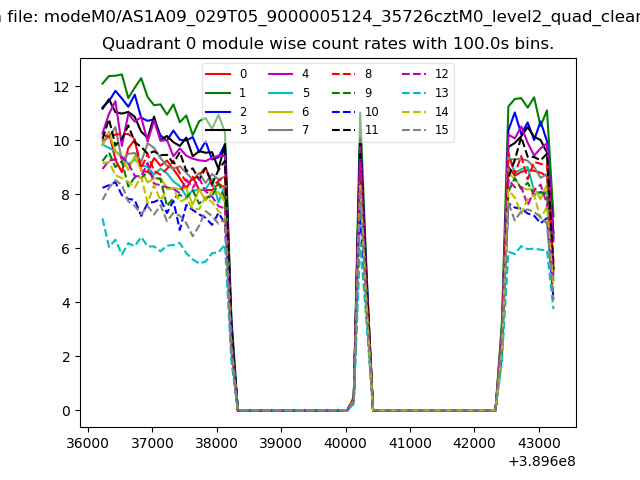 |
 |
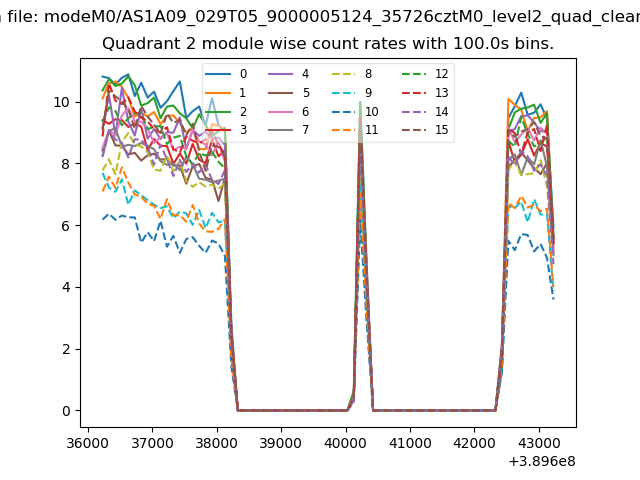
| Module-wise count rates for Quadrant B Data is divided into 100 sec bins |
 |
 |
| Module-wise count rates for Quadrant C Data is divided into 100 sec bins |
 |
 |
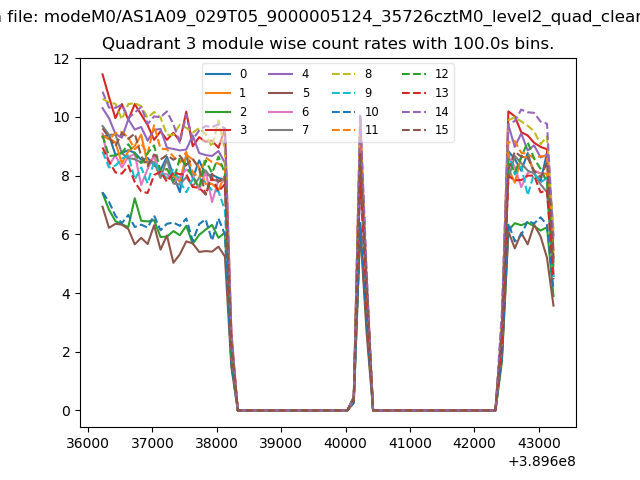
| Module-wise count rates for Quadrant D Data is divided into 100 sec bins |
 |
 |
| Parameter | Plot |
|---|---|
| CZT HV Monitor | 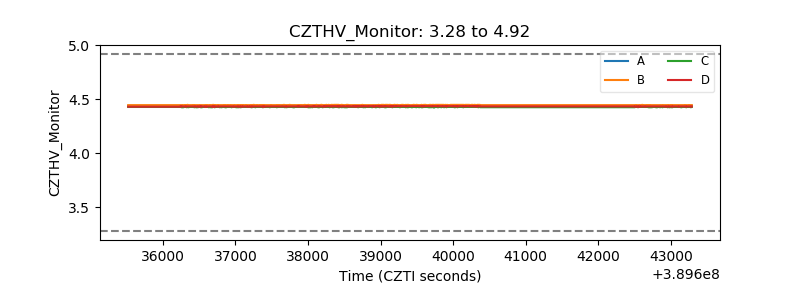 |
| D_VDD | 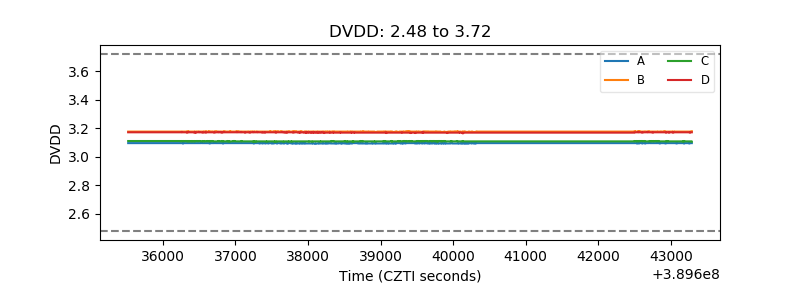 |
| Temperature 1 | 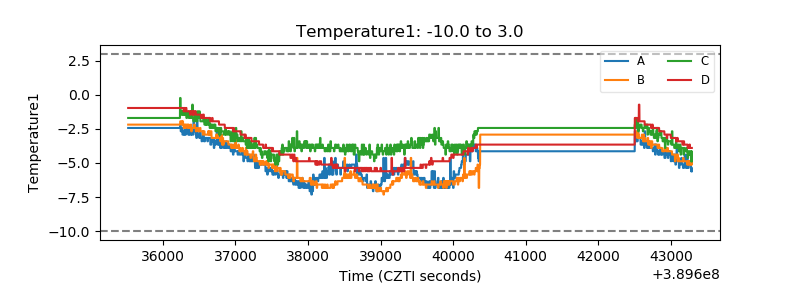 |
| Veto HV Monitor |  |
| Veto LLD | 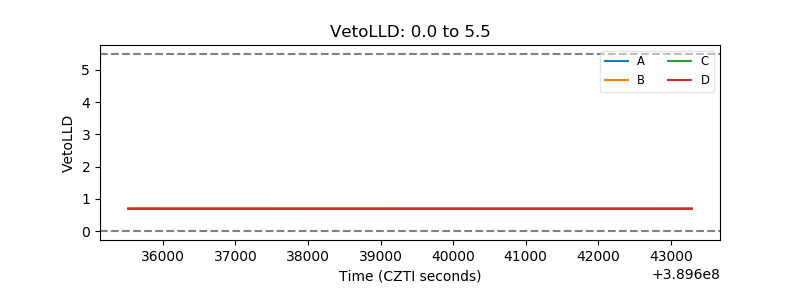 |
| Alpha Counter | 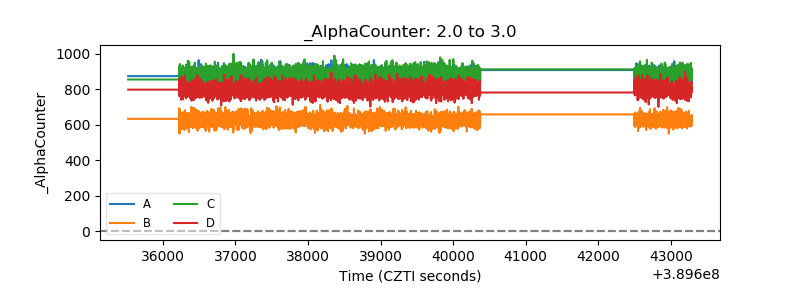 |
| _CPM_Rate | 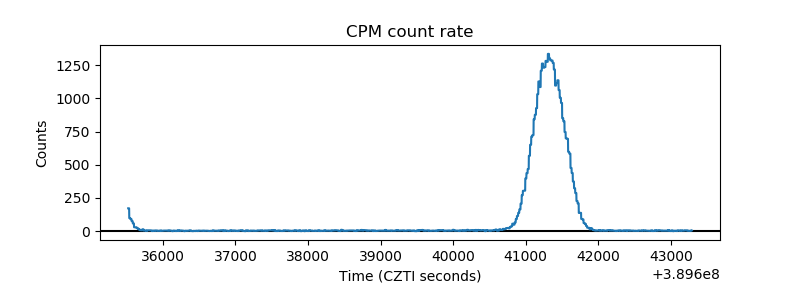 |
| CZT Counter | 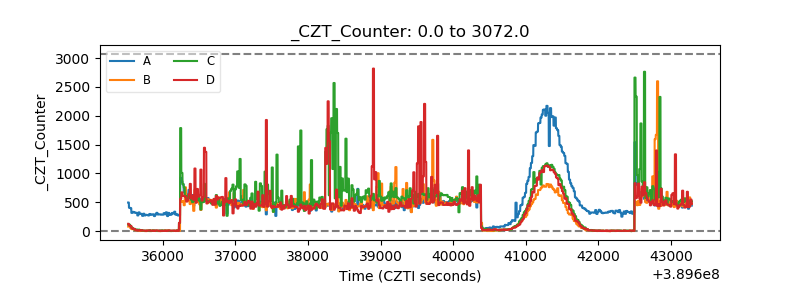 |
| +2.5 Volts monitor | 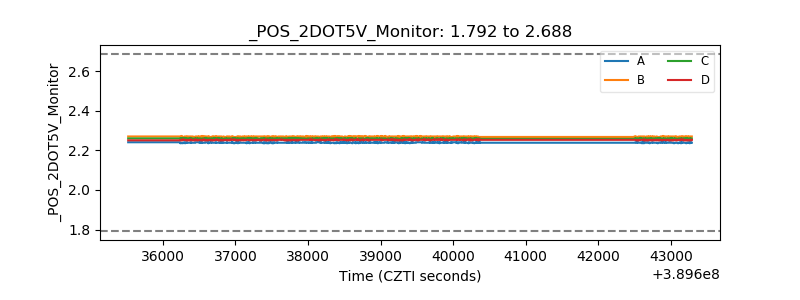 |
| +5 Volts monitor | 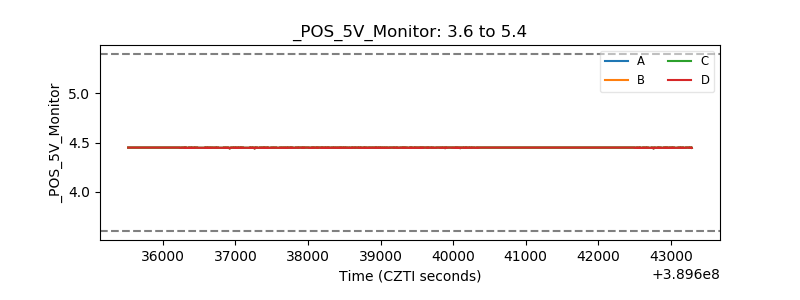 |
| _ROLL_ROT | 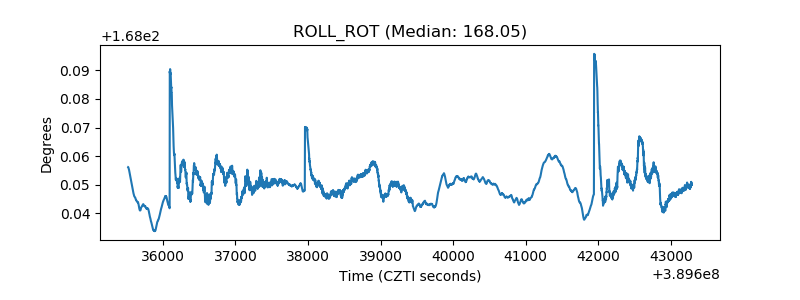 |
| _Roll_DEC | 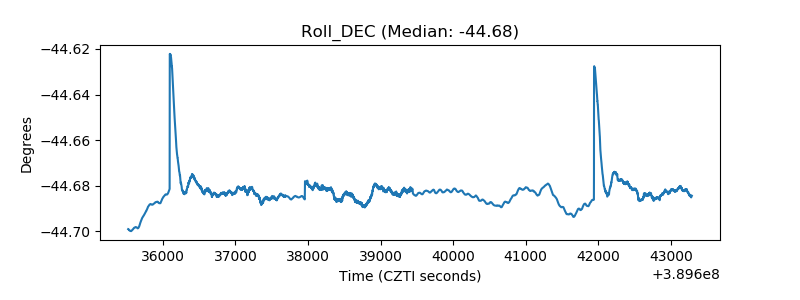 |
| _Roll_RA | 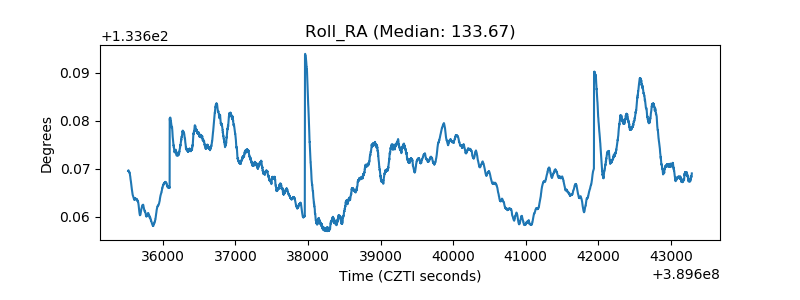 |
| Veto Counter | 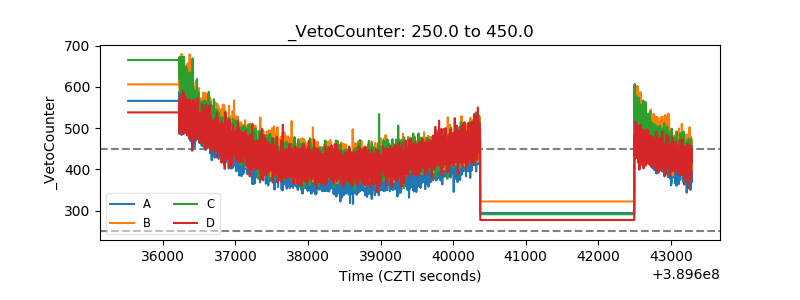 |