| Param | Original file | Final file |
|---|---|---|
| Filename | modeM0/AS1A09_142T05_9000005118_35719cztM0_level2.evt | modeM0/AS1A09_142T05_9000005118_35719cztM0_level2_quad_clean.evt |
| Size (bytes) | 1,072,344,960 | 172,667,520 |
| Size | 1022.7 MB | 164.7 MB |
| Events in quadrant A | 6,976,403 | 1,071,468 |
| Events in quadrant B | 7,798,365 | 1,078,802 |
| Events in quadrant C | 9,070,394 | 1,049,288 |
| Events in quadrant D | 7,633,438 | 1,011,046 |
| Mode M0 | |||
|---|---|---|---|
| Quadrant | BADHDUFLAG | Total packets | Discarded packets |
| A | 0 | 29959 | 3 |
| B | 0 | 32555 | 3 |
| C | 0 | 35955 | 3 |
| D | 0 | 32772 | 3 |
| Mode SS | |||
|---|---|---|---|
| Quadrant | BADHDUFLAG | Total packets | Discarded packets |
| A | 0 | 302 | 0 |
| B | 0 | 302 | 0 |
| C | 0 | 302 | 0 |
| D | 0 | 302 | 0 |
| Mode M9 | |||
|---|---|---|---|
| Quadrant | BADHDUFLAG | Total packets | Discarded packets |
| A | 0 | 39 | 0 |
| B | 0 | 39 | 0 |
| C | 0 | 39 | 0 |
| D | 0 | 39 | 0 |
| Quadrant | Total seconds | Saturated seconds | Saturation percentage |
|---|---|---|---|
| A | 14755 | 19 | 0.128770% |
| B | 14755 | 209 | 1.416469% |
| C | 14755 | 372 | 2.521179% |
| D | 14755 | 154 | 1.043714% |
Noise dominated data is calculated using 1-second bins in cleaned event files. If a bin has >2000 counts, and if more than 50% of those come from <1% of pixels, then it is considered to be noise-dominated and hence unusable.
| Quadrant | # 1 sec bins | Bins with >0 counts | Bins with >2000 counts | High rate bins dominated by noise | Noise dominated (total time) | Noise dominated (detector-on time) | Marked lightcurve |
|---|---|---|---|---|---|---|---|
| A | 18726 | 14758 | 1 | 1 | 0.01% | 0.01% | 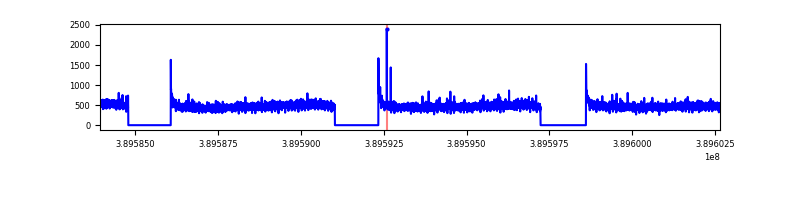 |
| B | 18726 | 14758 | 164 | 164 | 0.88% | 1.11% | 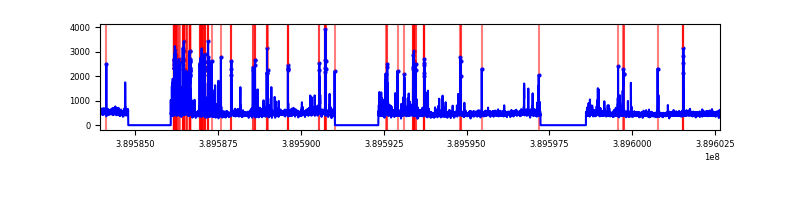 |
| C | 18726 | 14758 | 344 | 344 | 1.84% | 2.33% | 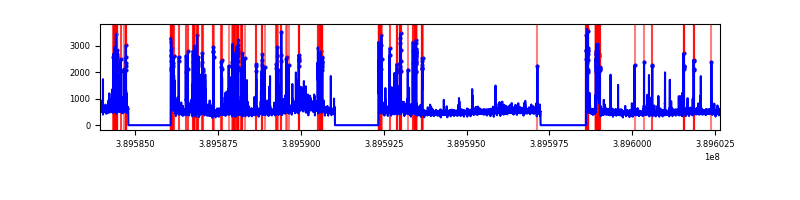 |
| D | 18726 | 14758 | 129 | 129 | 0.69% | 0.87% | 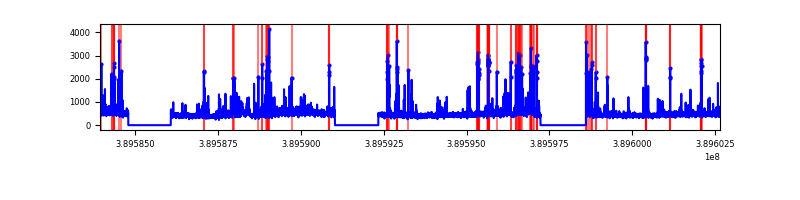 |
Top three noisy pixels from each quadrant. If the there are fewer than three noisy pixels in the level2.evt file, extra rows are filled as -1
| Pixel properties | Quadrant properties | ||||||
|---|---|---|---|---|---|---|---|
| Quadrant | DetID | PixID | Counts | Sigma | Mean | Median | Sigma |
| A | 10 | 83 | 303522 | 869.03 | 1712 | 1671 | 347.3 |
| A | 13 | 6 | 28463 | 77.13 | 1712 | 1671 | 347.3 |
| A | 13 | 254 | 19150 | 50.32 | 1712 | 1671 | 347.3 |
| B | 5 | 172 | 763514 | 2349.03 | 1689 | 1642 | 324.3 |
| B | 5 | 255 | 174237 | 532.15 | 1689 | 1642 | 324.3 |
| B | 4 | 206 | 124672 | 379.33 | 1689 | 1642 | 324.3 |
| C | 0 | 207 | 1024615 | 2665.15 | 1656 | 1667 | 383.8 |
| C | 0 | 10 | 784589 | 2039.79 | 1656 | 1667 | 383.8 |
| C | 15 | 214 | 608790 | 1581.77 | 1656 | 1667 | 383.8 |
| D | 13 | 249 | 622113 | 1518.89 | 1668 | 1621 | 408.5 |
| D | 2 | 249 | 138635 | 335.39 | 1668 | 1621 | 408.5 |
| D | 10 | 118 | 131013 | 316.74 | 1668 | 1621 | 408.5 |
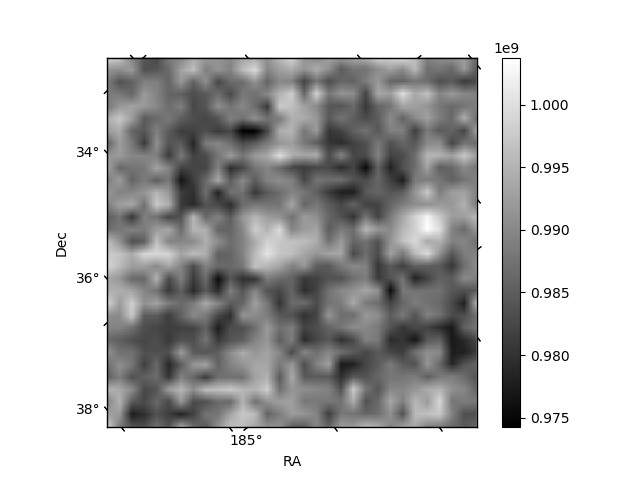
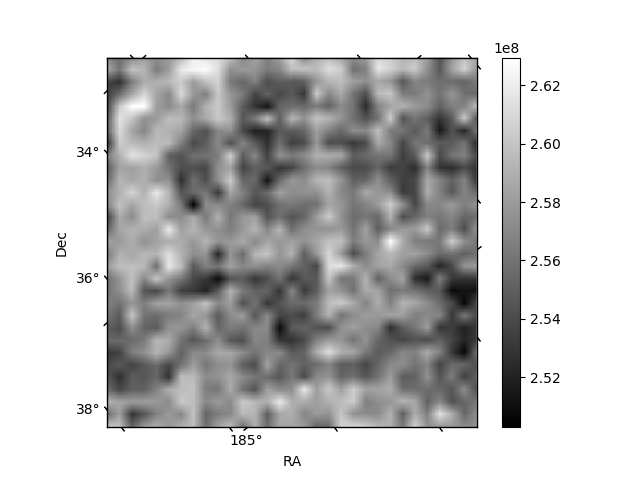
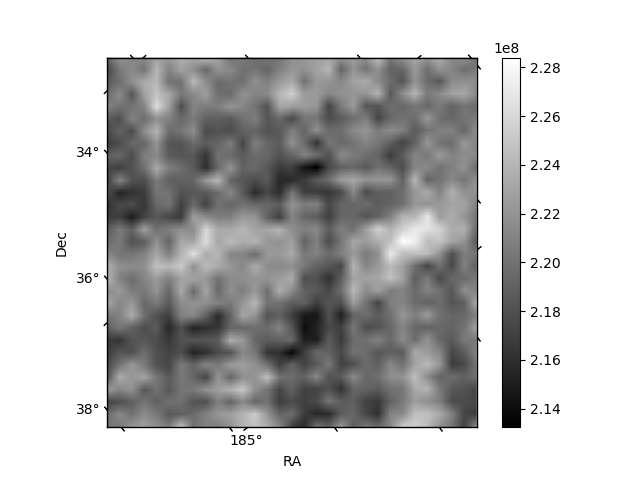
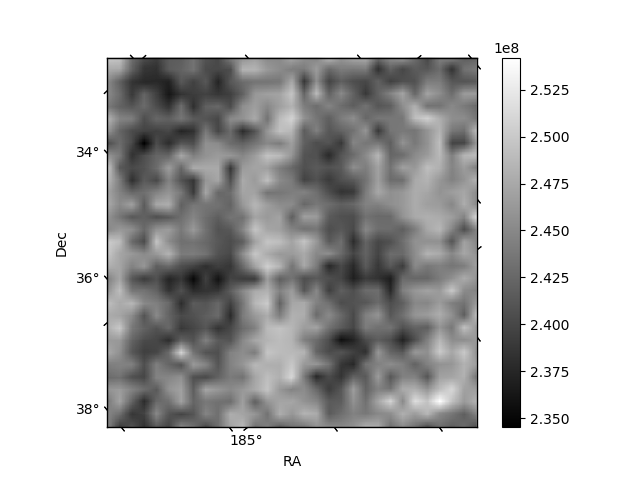
Histogram calculated using DETX and DETY for each event in the final _common_clean file
| Quadrant A | 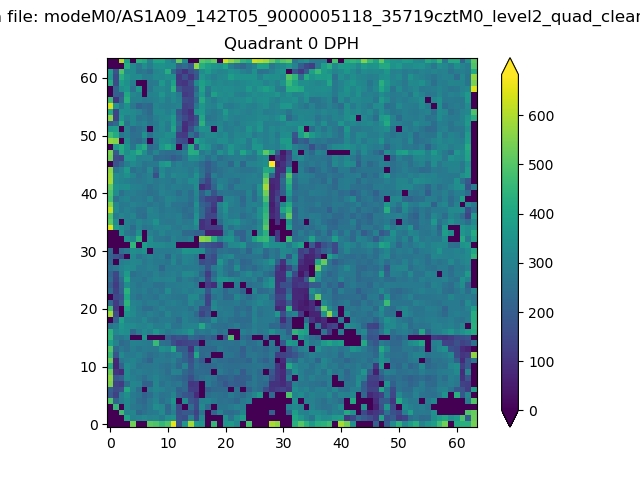 |
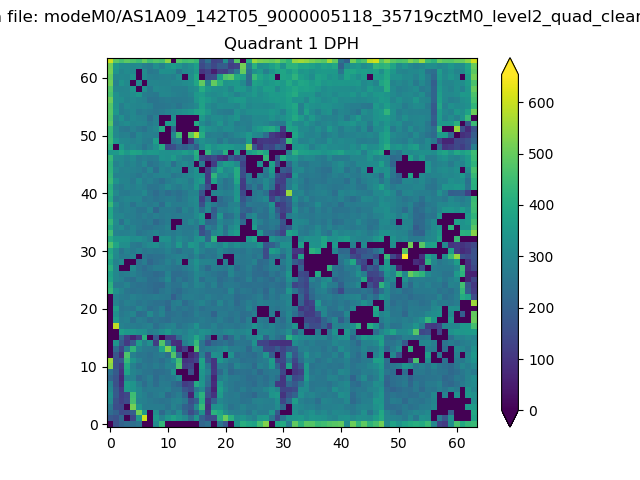 |
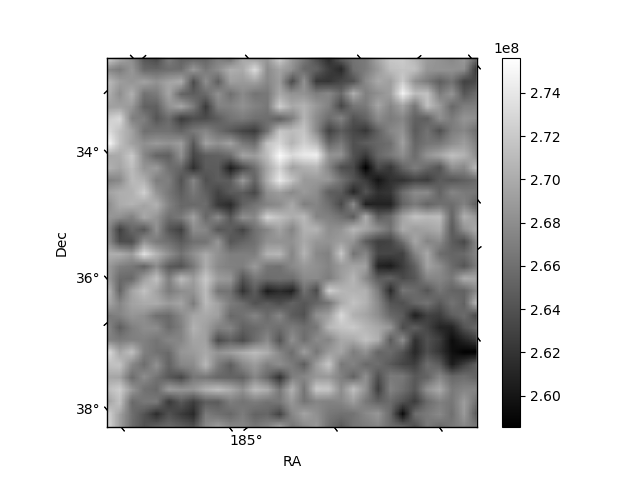
Quadrant B |
|---|---|---|---|
| Quadrant D | 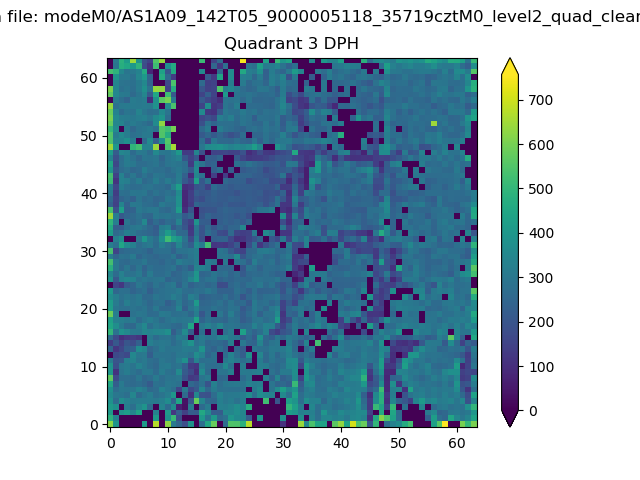 |
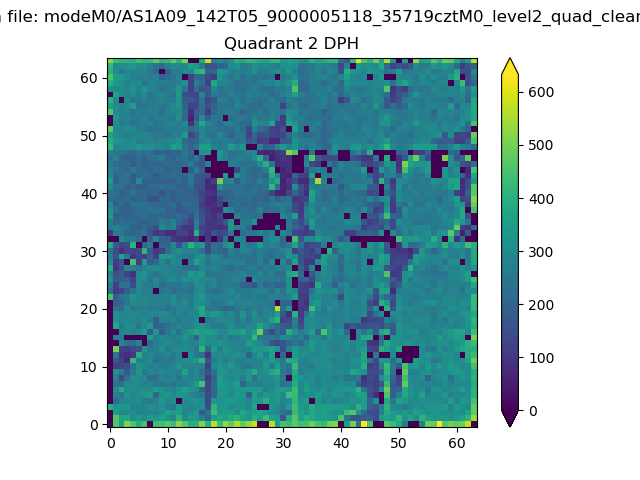 |
Quadrant C |
| Plot type | Count rate plots | Images |
|---|---|---|
| Comparison with Poisson distribution Blue bars denote a histogram of data divided into 1 sec bins. Red curve is a Poisson curve with rate = median count rate of data. |
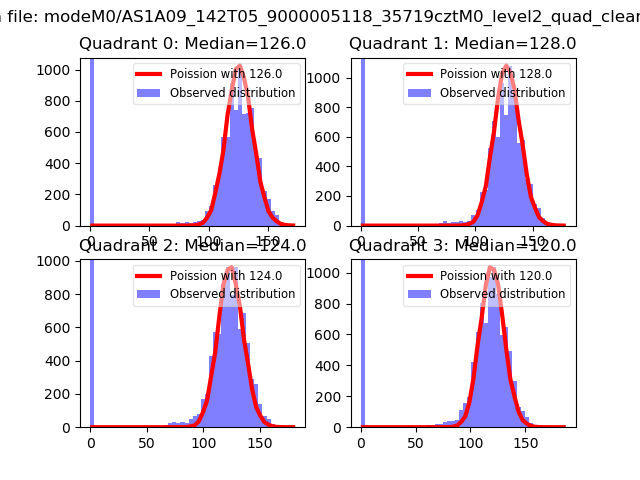 |
 |
| Quadrant-wise count rates Data is divided into 100 sec bins |
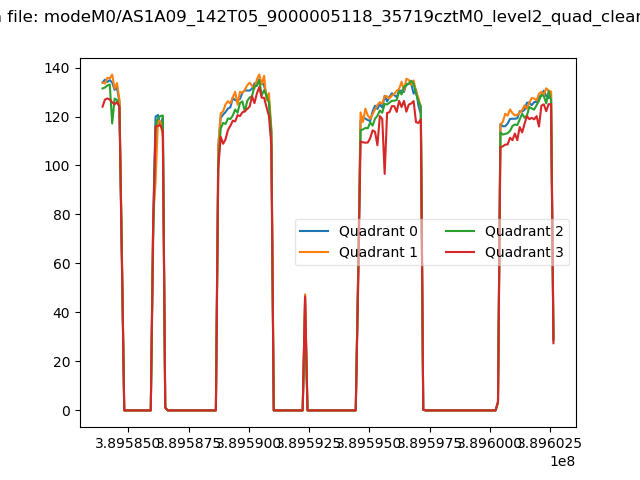 |
|
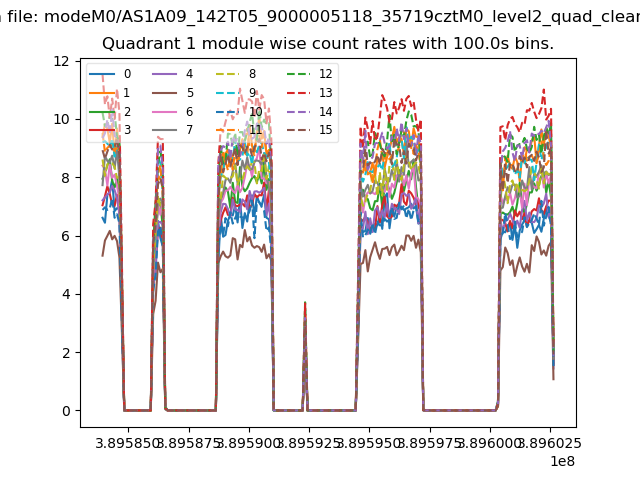
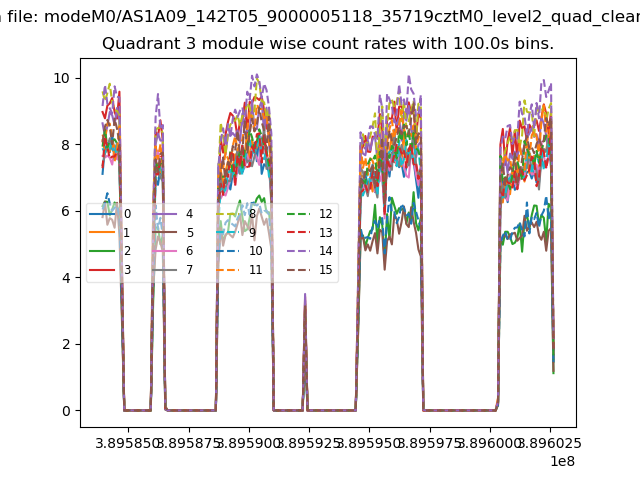
| Module-wise count rates for Quadrant A Data is divided into 100 sec bins |
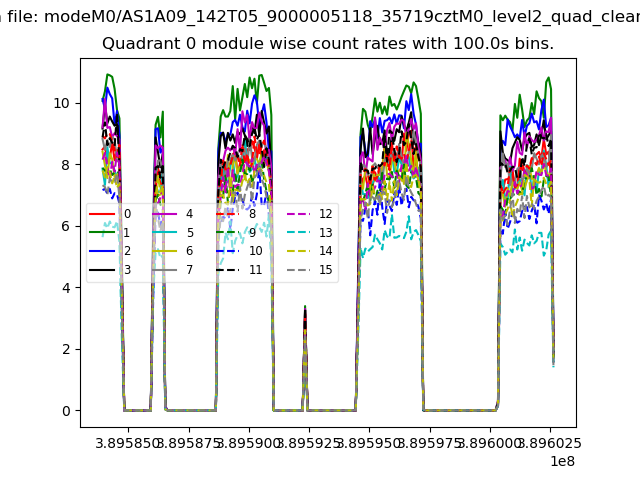 |
 |
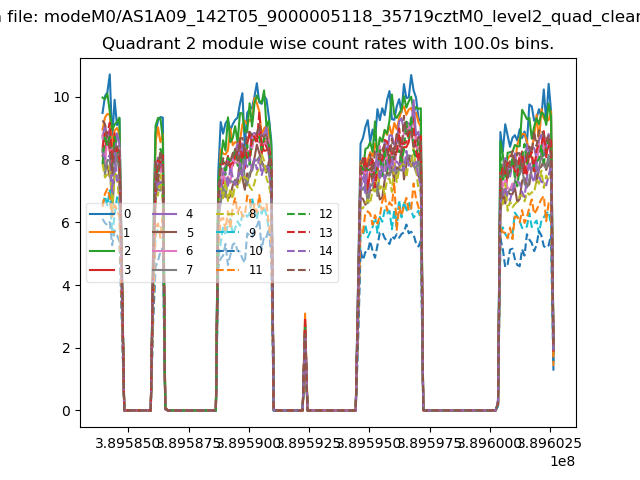
| Module-wise count rates for Quadrant B Data is divided into 100 sec bins |
 |
 |
| Module-wise count rates for Quadrant C Data is divided into 100 sec bins |
 |
 |
| Module-wise count rates for Quadrant D Data is divided into 100 sec bins |
 |
 |
| Parameter | Plot |
|---|---|
| CZT HV Monitor |  |
| D_VDD | 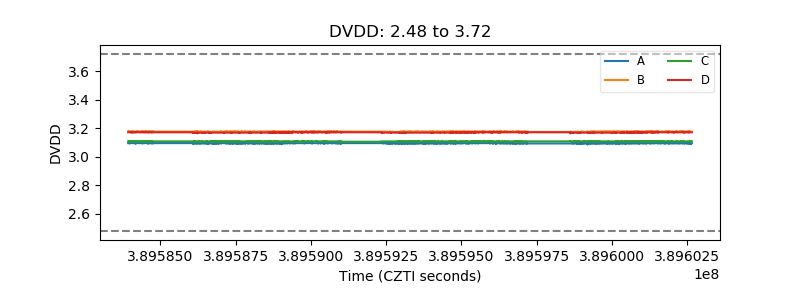 |
| Temperature 1 | 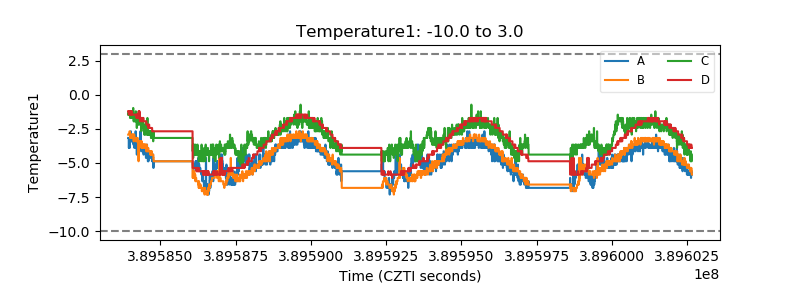 |
| Veto HV Monitor | 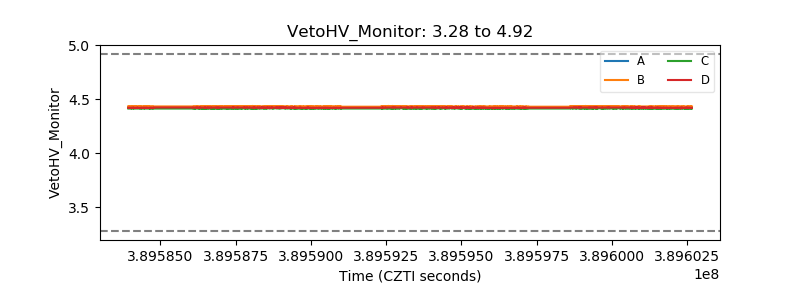 |
| Veto LLD | 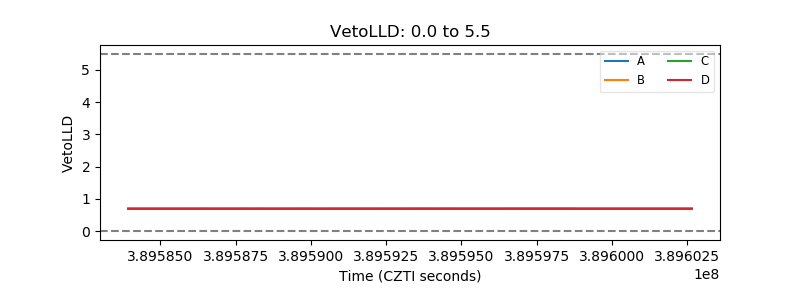 |
| Alpha Counter | 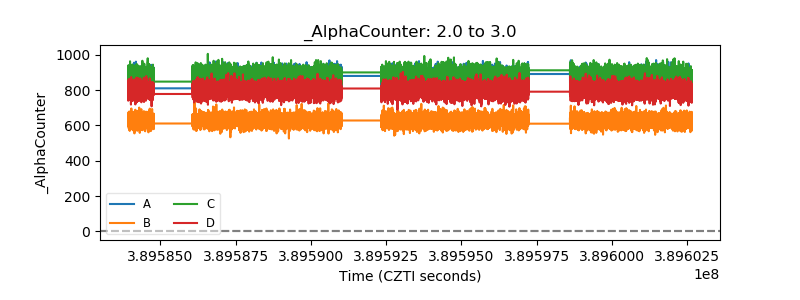 |
| _CPM_Rate | 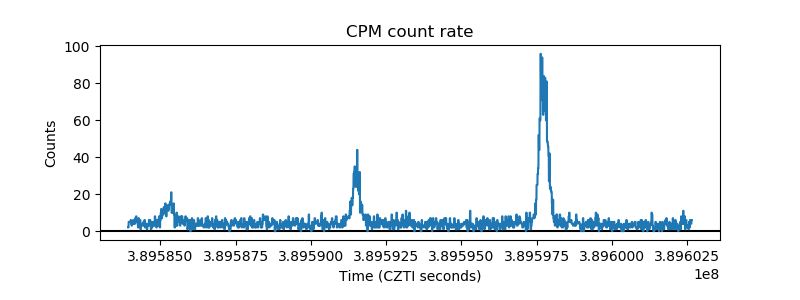 |
| CZT Counter | 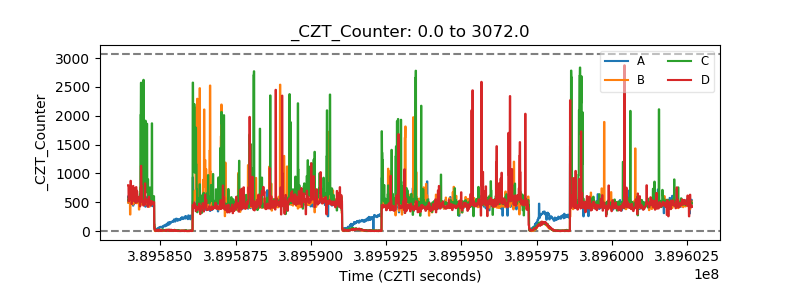 |
| +2.5 Volts monitor | 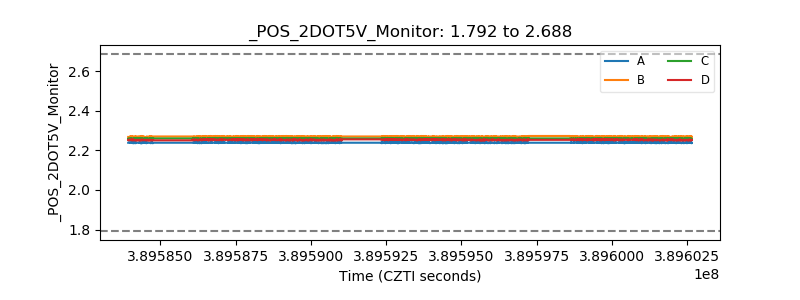 |
| +5 Volts monitor | 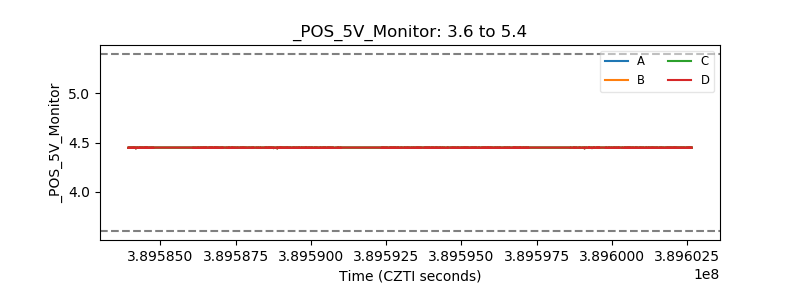 |
| _ROLL_ROT | 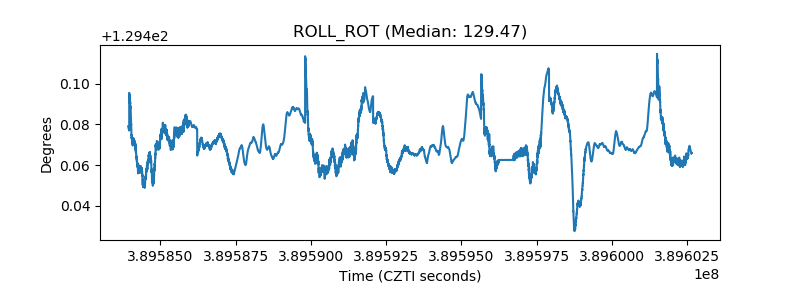 |
| _Roll_DEC | 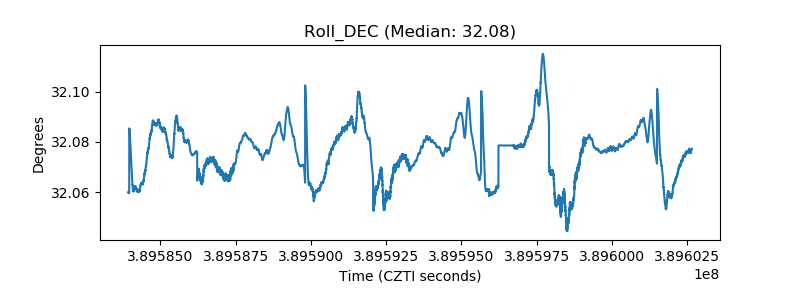 |
| _Roll_RA | 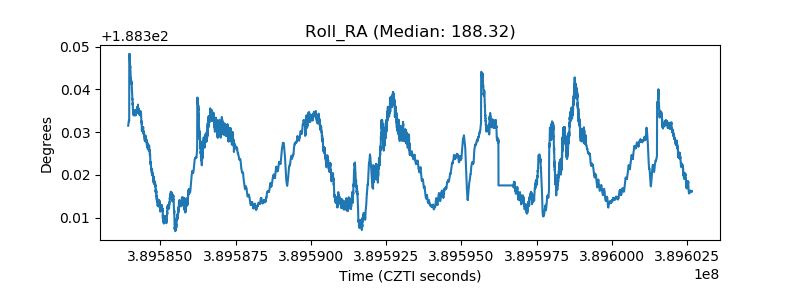 |
| Veto Counter | 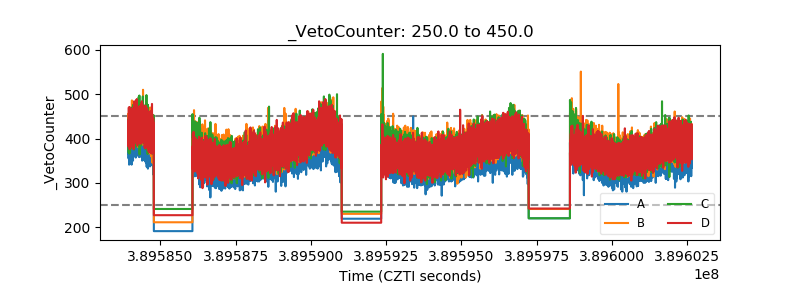 |