| Param | Original file | Final file |
|---|---|---|
| Filename | modeM0/AS1A09_142T05_9000005118_35715cztM0_level2.evt | modeM0/AS1A09_142T05_9000005118_35715cztM0_level2_quad_clean.evt |
| Size (bytes) | 418,351,680 | 73,137,600 |
| Size | 399.0 MB | 69.7 MB |
| Events in quadrant A | 2,774,613 | 459,221 |
| Events in quadrant B | 2,992,421 | 462,387 |
| Events in quadrant C | 3,685,203 | 441,536 |
| Events in quadrant D | 2,817,397 | 440,119 |
| Mode M0 | |||
|---|---|---|---|
| Quadrant | BADHDUFLAG | Total packets | Discarded packets |
| A | 0 | 12060 | 3 |
| B | 0 | 12725 | 2 |
| C | 0 | 14650 | 2 |
| D | 0 | 12518 | 2 |
| Mode SS | |||
|---|---|---|---|
| Quadrant | BADHDUFLAG | Total packets | Discarded packets |
| A | 0 | 122 | 0 |
| B | 0 | 122 | 0 |
| C | 0 | 122 | 0 |
| D | 0 | 122 | 0 |
| Mode M9 | |||
|---|---|---|---|
| Quadrant | BADHDUFLAG | Total packets | Discarded packets |
| A | 0 | 31 | 0 |
| B | 0 | 31 | 0 |
| C | 0 | 31 | 0 |
| D | 0 | 31 | 0 |
| Quadrant | Total seconds | Saturated seconds | Saturation percentage |
|---|---|---|---|
| A | 5883 | 12 | 0.203978% |
| B | 5883 | 43 | 0.730920% |
| C | 5883 | 210 | 3.569607% |
| D | 5883 | 41 | 0.696923% |
Noise dominated data is calculated using 1-second bins in cleaned event files. If a bin has >2000 counts, and if more than 50% of those come from <1% of pixels, then it is considered to be noise-dominated and hence unusable.
| Quadrant | # 1 sec bins | Bins with >0 counts | Bins with >2000 counts | High rate bins dominated by noise | Noise dominated (total time) | Noise dominated (detector-on time) | Marked lightcurve |
|---|---|---|---|---|---|---|---|
| A | 8988 | 5885 | 0 | 0 | 0.00% | 0.00% | 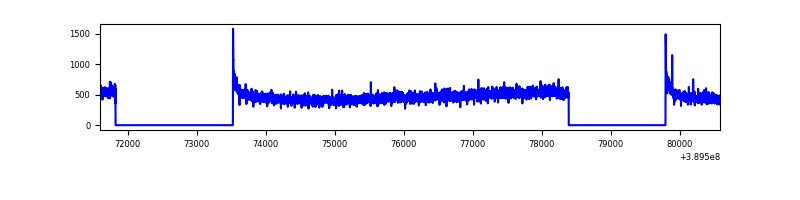 |
| B | 8988 | 5885 | 28 | 28 | 0.31% | 0.48% | 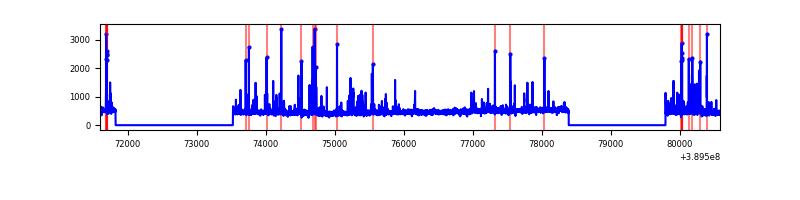 |
| C | 8988 | 5885 | 191 | 191 | 2.13% | 3.25% | 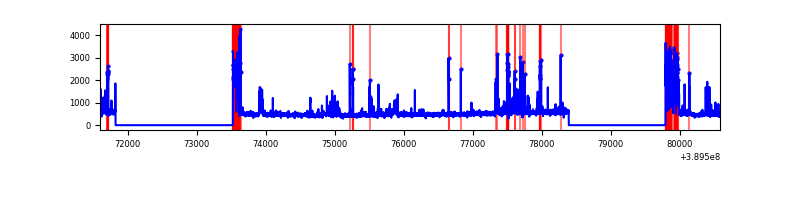 |
| D | 8988 | 5885 | 34 | 34 | 0.38% | 0.58% | 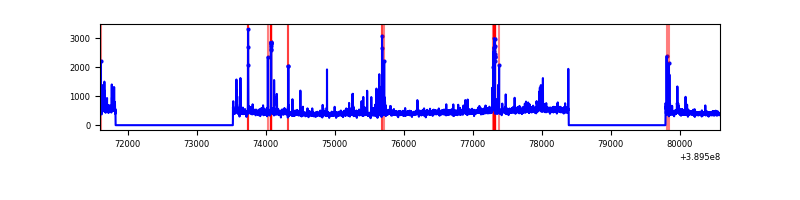 |
Top three noisy pixels from each quadrant. If the there are fewer than three noisy pixels in the level2.evt file, extra rows are filled as -1
| Pixel properties | Quadrant properties | ||||||
|---|---|---|---|---|---|---|---|
| Quadrant | DetID | PixID | Counts | Sigma | Mean | Median | Sigma |
| A | 10 | 83 | 149116 | 1080.05 | 675 | 662 | 137.5 |
| A | 13 | 6 | 12274 | 84.48 | 675 | 662 | 137.5 |
| A | 3 | 137 | 7269 | 48.07 | 675 | 662 | 137.5 |
| B | 5 | 172 | 313714 | 2392.57 | 666 | 647 | 130.8 |
| B | 5 | 255 | 42442 | 319.41 | 666 | 647 | 130.8 |
| B | 12 | 111 | 16691 | 122.61 | 666 | 647 | 130.8 |
| C | 0 | 10 | 481450 | 3160.04 | 646 | 649 | 152.2 |
| C | 0 | 207 | 400558 | 2628.39 | 646 | 649 | 152.2 |
| C | 15 | 214 | 242093 | 1586.88 | 646 | 649 | 152.2 |
| D | 13 | 249 | 145266 | 903.05 | 654 | 636 | 160.2 |
| D | 2 | 250 | 40931 | 251.59 | 654 | 636 | 160.2 |
| D | 2 | 234 | 27919 | 170.35 | 654 | 636 | 160.2 |
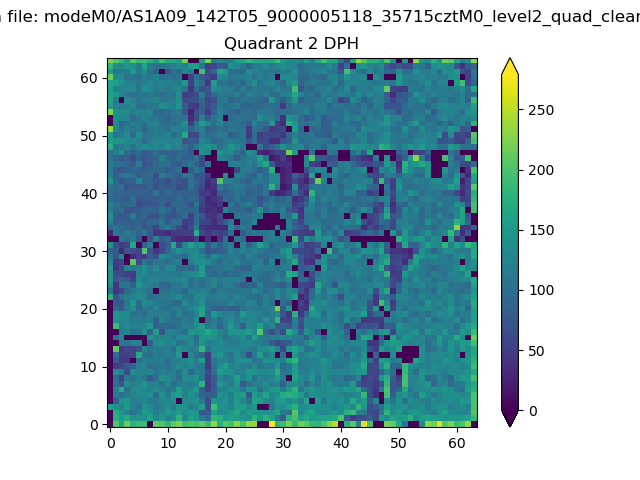
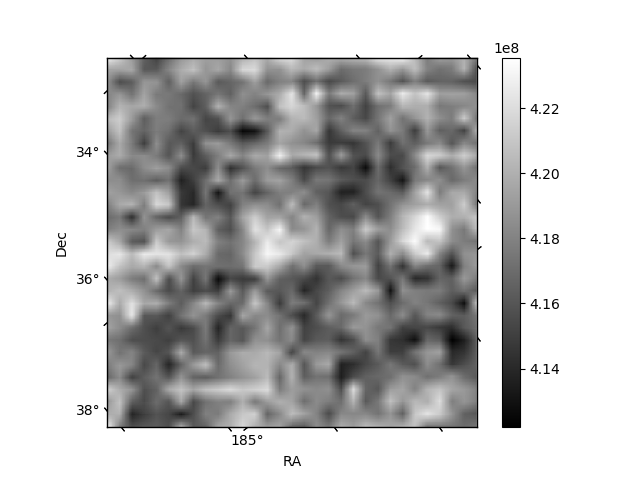
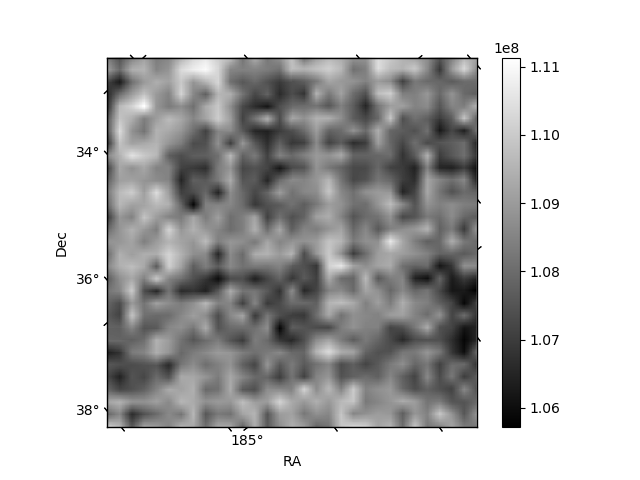
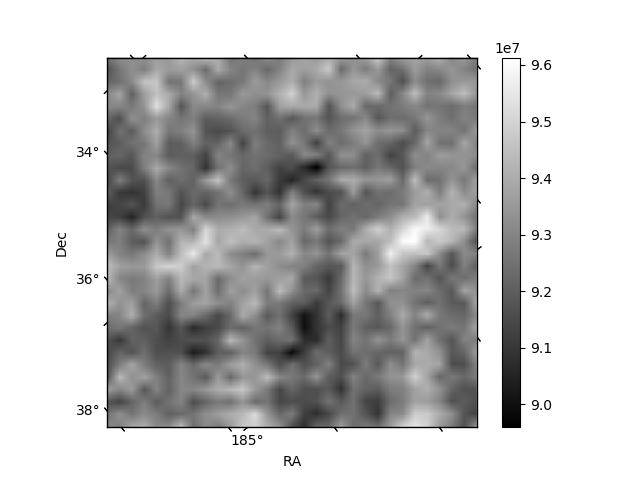
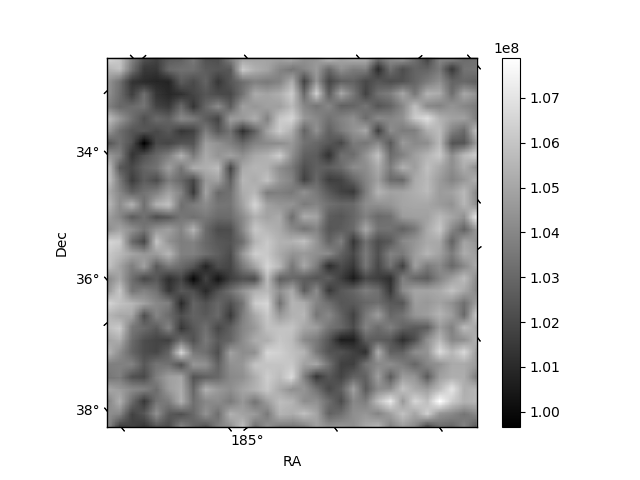
Histogram calculated using DETX and DETY for each event in the final _common_clean file
| Quadrant A | 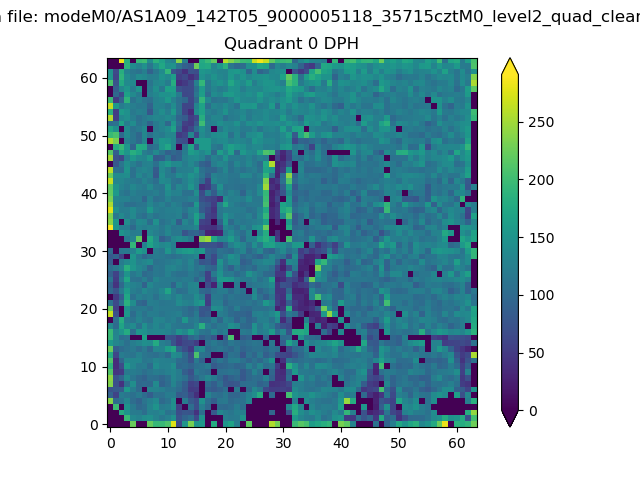 |
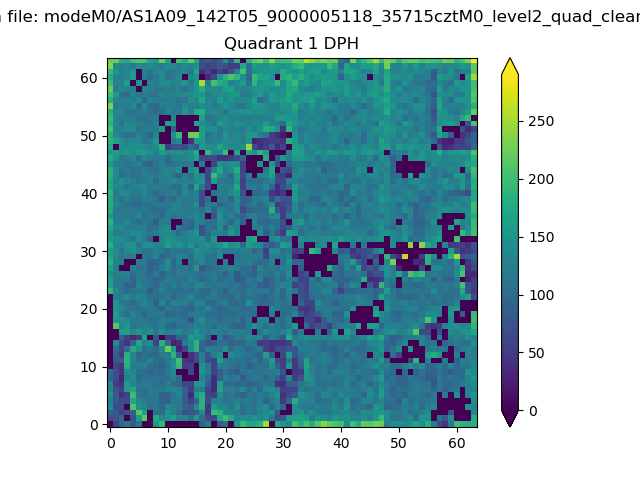 |
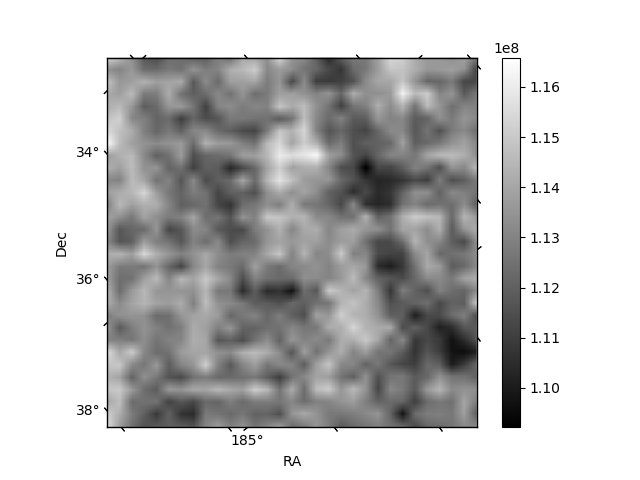
Quadrant B |
|---|---|---|---|
| Quadrant D | 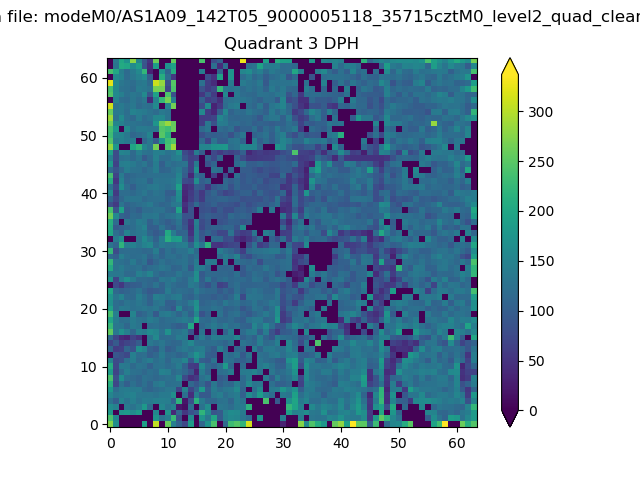 |
 |
Quadrant C |
| Plot type | Count rate plots | Images |
|---|---|---|
| Comparison with Poisson distribution Blue bars denote a histogram of data divided into 1 sec bins. Red curve is a Poisson curve with rate = median count rate of data. |
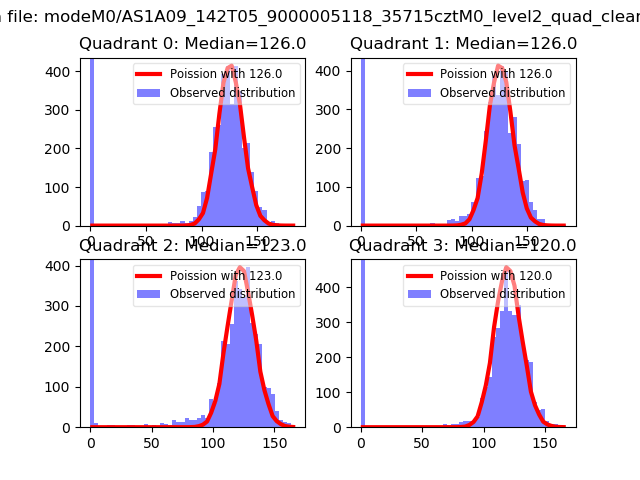 |
 |
| Quadrant-wise count rates Data is divided into 100 sec bins |
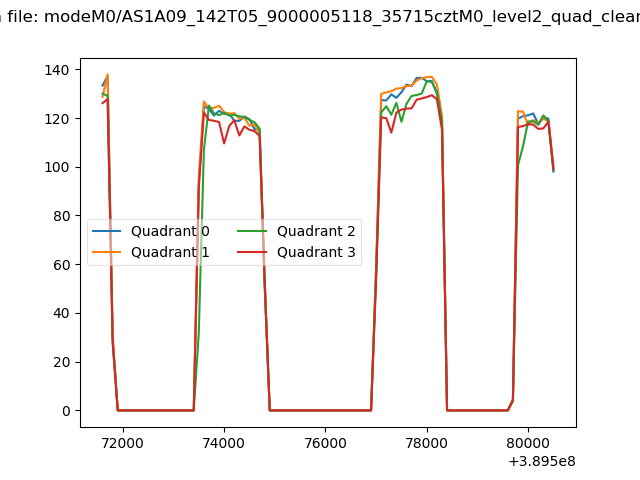 |
|
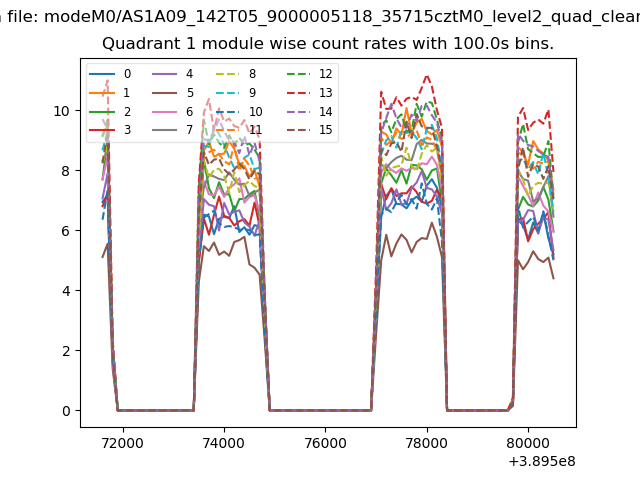
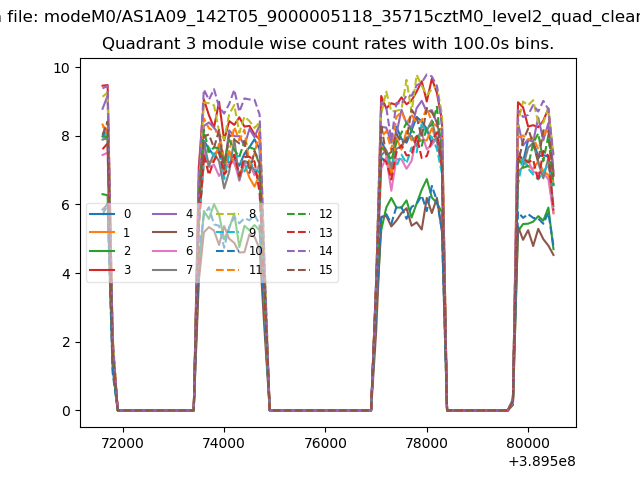
| Module-wise count rates for Quadrant A Data is divided into 100 sec bins |
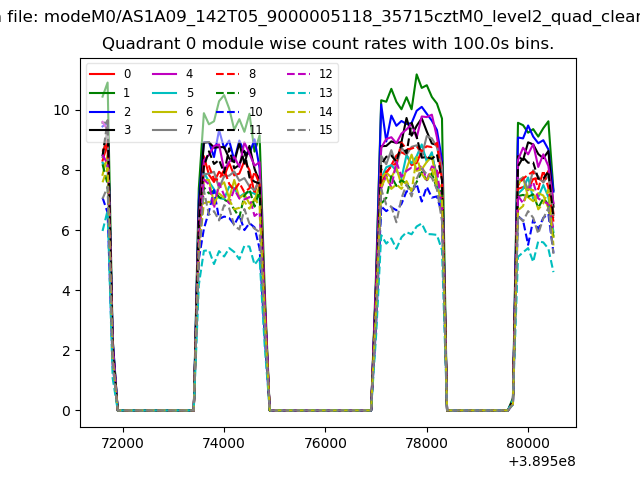 |
 |
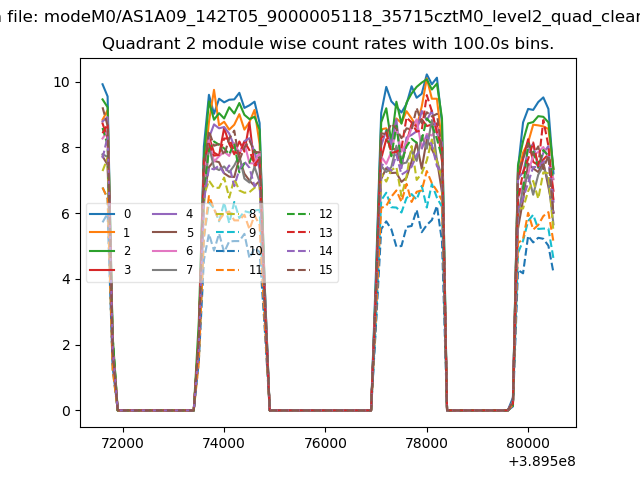
| Module-wise count rates for Quadrant B Data is divided into 100 sec bins |
 |
 |
| Module-wise count rates for Quadrant C Data is divided into 100 sec bins |
 |
 |
| Module-wise count rates for Quadrant D Data is divided into 100 sec bins |
 |
 |
| Parameter | Plot |
|---|---|
| CZT HV Monitor | 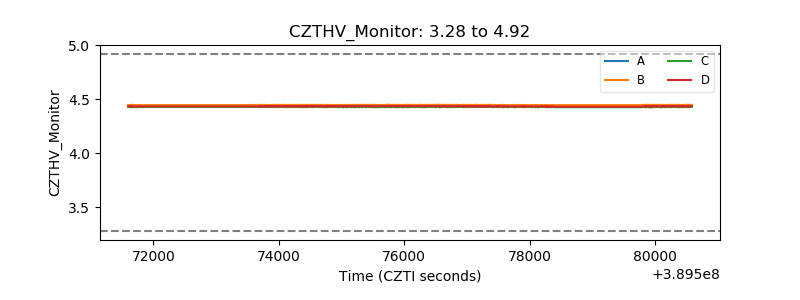 |
| D_VDD | 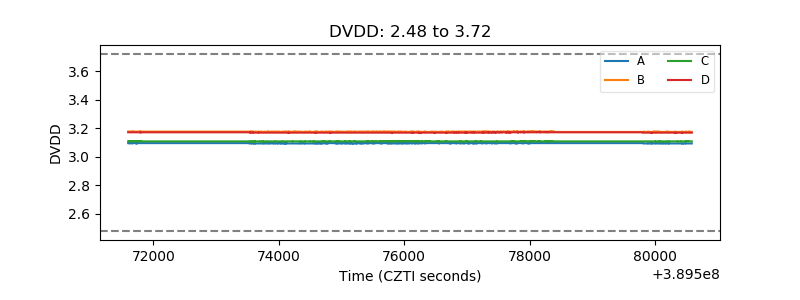 |
| Temperature 1 | 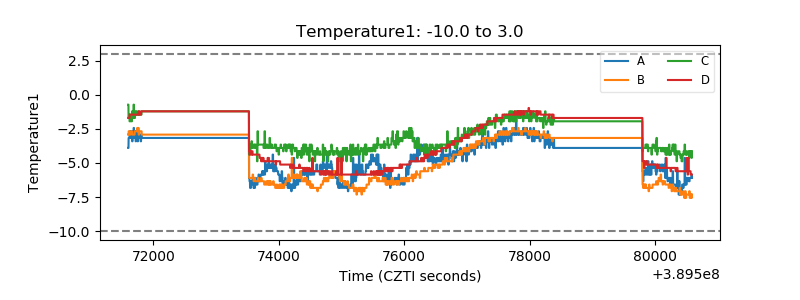 |
| Veto HV Monitor | 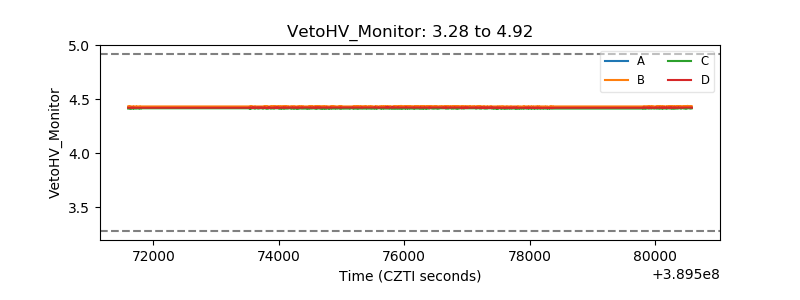 |
| Veto LLD | 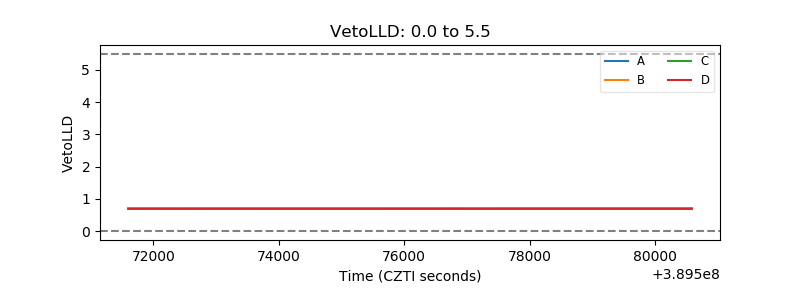 |
| Alpha Counter | 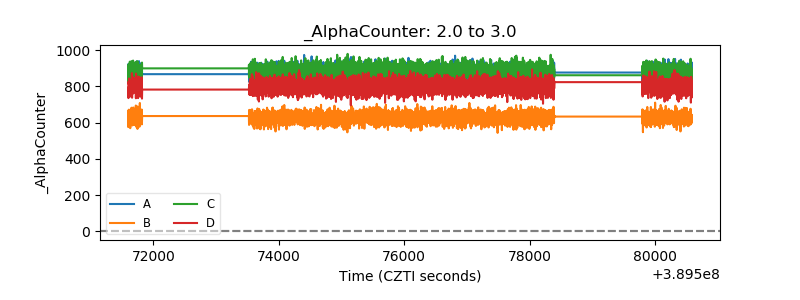 |
| _CPM_Rate | 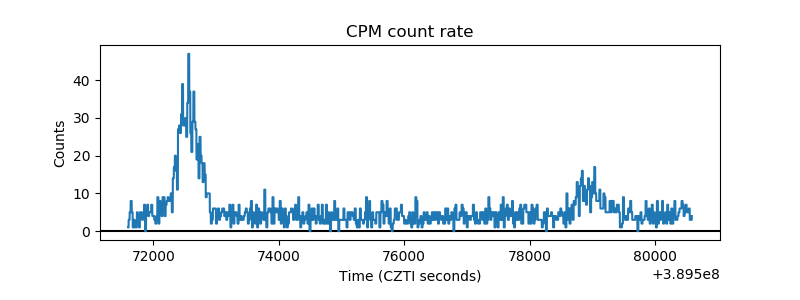 |
| CZT Counter | 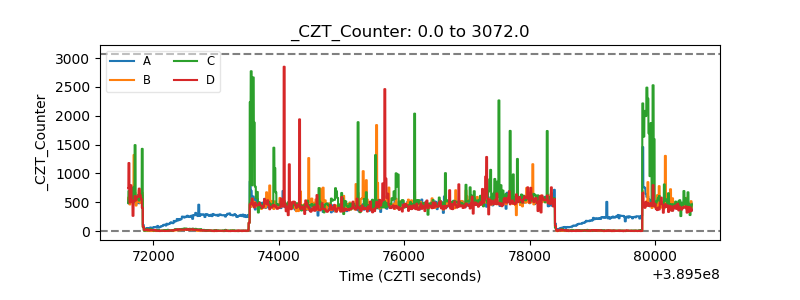 |
| +2.5 Volts monitor | 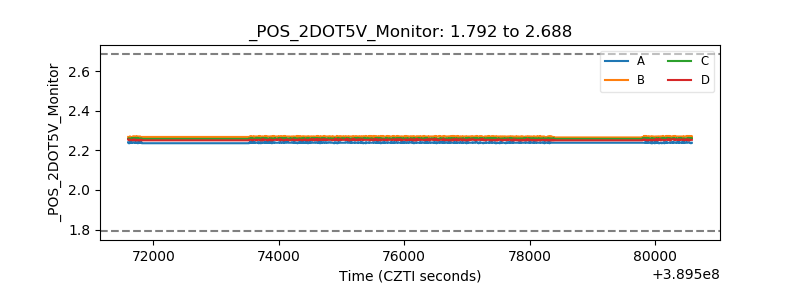 |
| +5 Volts monitor | 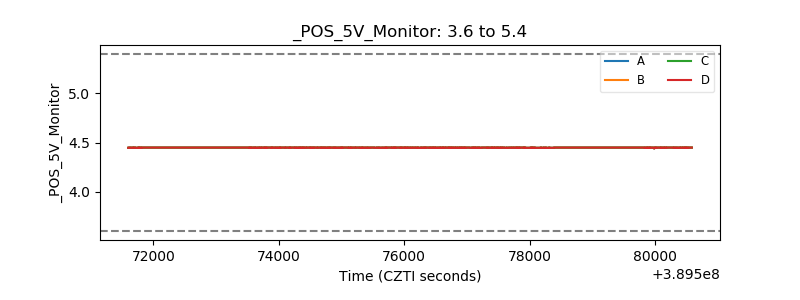 |
| _ROLL_ROT | 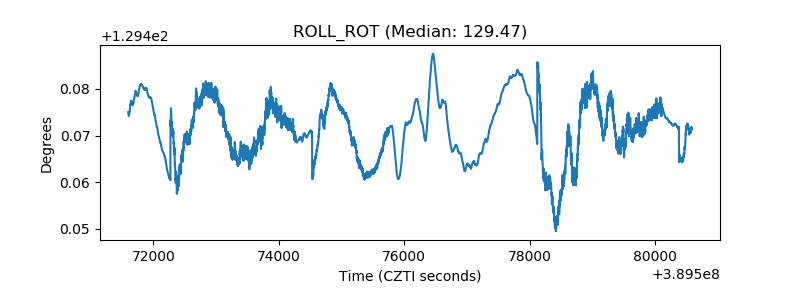 |
| _Roll_DEC | 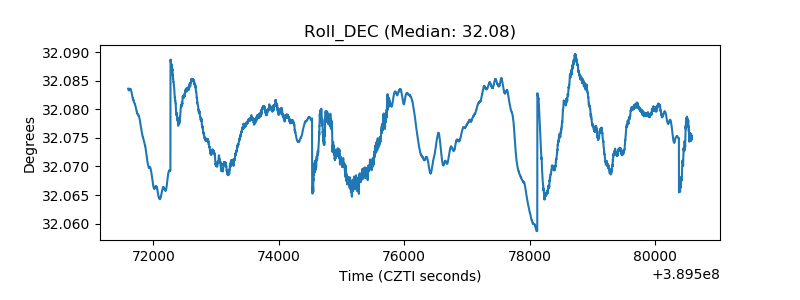 |
| _Roll_RA | 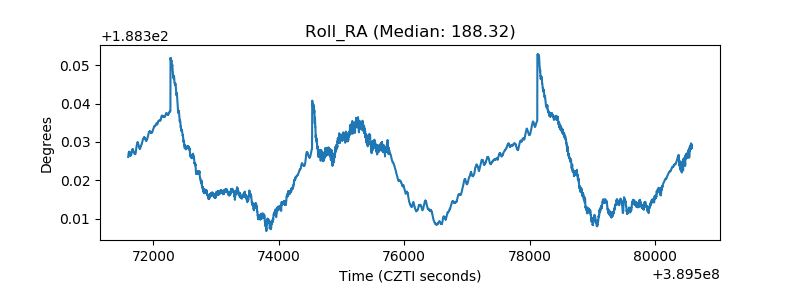 |
| Veto Counter | 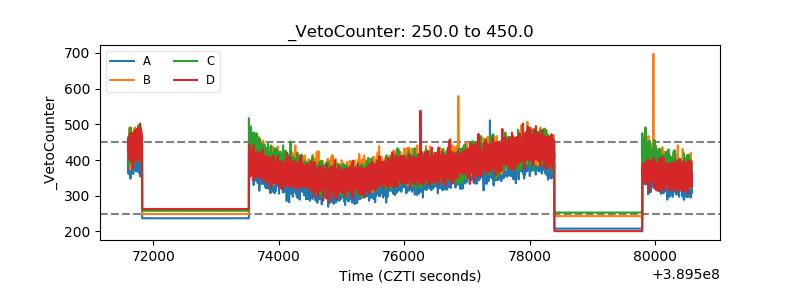 |