| Param | Original file | Final file |
|---|---|---|
| Filename | modeM0/AS1A09_142T05_9000005118_35712cztM0_level2.evt | modeM0/AS1A09_142T05_9000005118_35712cztM0_level2_quad_clean.evt |
| Size (bytes) | 202,587,840 | 22,492,800 |
| Size | 193.2 MB | 21.5 MB |
| Events in quadrant A | 1,231,043 | 128,214 |
| Events in quadrant B | 1,674,603 | 127,810 |
| Events in quadrant C | 1,533,676 | 122,765 |
| Events in quadrant D | 1,524,362 | 122,136 |
| Mode M0 | |||
|---|---|---|---|
| Quadrant | BADHDUFLAG | Total packets | Discarded packets |
| A | 0 | 5182 | 2 |
| B | 0 | 6521 | 1 |
| C | 0 | 6027 | 1 |
| D | 0 | 6140 | 1 |
| Mode SS | |||
|---|---|---|---|
| Quadrant | BADHDUFLAG | Total packets | Discarded packets |
| A | 0 | 52 | 0 |
| B | 0 | 52 | 0 |
| C | 0 | 52 | 0 |
| D | 0 | 52 | 0 |
| Mode M9 | |||
|---|---|---|---|
| Quadrant | BADHDUFLAG | Total packets | Discarded packets |
| A | 0 | 21 | 0 |
| B | 0 | 21 | 0 |
| C | 0 | 21 | 0 |
| D | 0 | 21 | 0 |
| Quadrant | Total seconds | Saturated seconds | Saturation percentage |
|---|---|---|---|
| A | 2498 | 4 | 0.160128% |
| B | 2498 | 127 | 5.084067% |
| C | 2498 | 71 | 2.842274% |
| D | 2498 | 71 | 2.842274% |
Noise dominated data is calculated using 1-second bins in cleaned event files. If a bin has >2000 counts, and if more than 50% of those come from <1% of pixels, then it is considered to be noise-dominated and hence unusable.
| Quadrant | # 1 sec bins | Bins with >0 counts | Bins with >2000 counts | High rate bins dominated by noise | Noise dominated (total time) | Noise dominated (detector-on time) | Marked lightcurve |
|---|---|---|---|---|---|---|---|
| A | 4651 | 2499 | 0 | 0 | 0.00% | 0.00% | 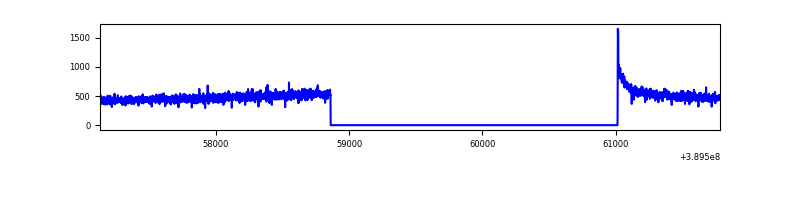 |
| B | 4651 | 2499 | 100 | 100 | 2.15% | 4.00% | 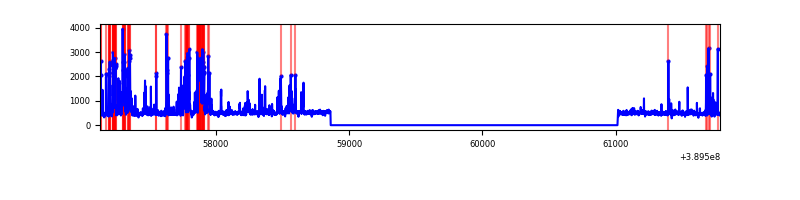 |
| C | 4651 | 2499 | 69 | 69 | 1.48% | 2.76% | 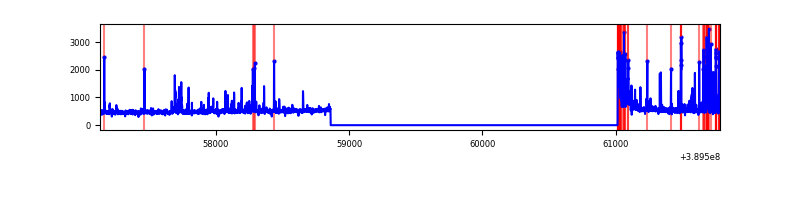 |
| D | 4651 | 2499 | 74 | 74 | 1.59% | 2.96% | 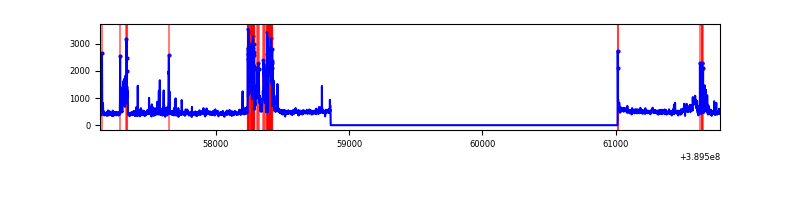 |
Top three noisy pixels from each quadrant. If the there are fewer than three noisy pixels in the level2.evt file, extra rows are filled as -1
| Pixel properties | Quadrant properties | ||||||
|---|---|---|---|---|---|---|---|
| Quadrant | DetID | PixID | Counts | Sigma | Mean | Median | Sigma |
| A | 10 | 83 | 68657 | 1110.58 | 298 | 293 | 61.6 |
| A | 13 | 6 | 7907 | 123.69 | 298 | 293 | 61.6 |
| A | 3 | 137 | 3192 | 47.09 | 298 | 293 | 61.6 |
| B | 5 | 172 | 309462 | 5377.54 | 291 | 284 | 57.5 |
| B | 5 | 255 | 204506 | 3552.04 | 291 | 284 | 57.5 |
| B | 0 | 155 | 12567 | 213.64 | 291 | 284 | 57.5 |
| C | 0 | 10 | 215412 | 3172.93 | 286 | 288 | 67.8 |
| C | 15 | 214 | 104683 | 1539.75 | 286 | 288 | 67.8 |
| C | 0 | 207 | 76762 | 1127.94 | 286 | 288 | 67.8 |
| D | 13 | 249 | 298763 | 4174.76 | 285 | 276 | 71.5 |
| D | 12 | 6 | 71940 | 1002.32 | 285 | 276 | 71.5 |
| D | 10 | 118 | 17050 | 234.61 | 285 | 276 | 71.5 |
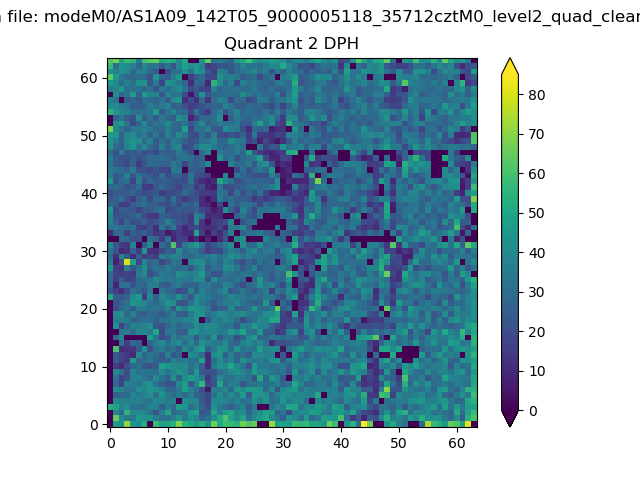
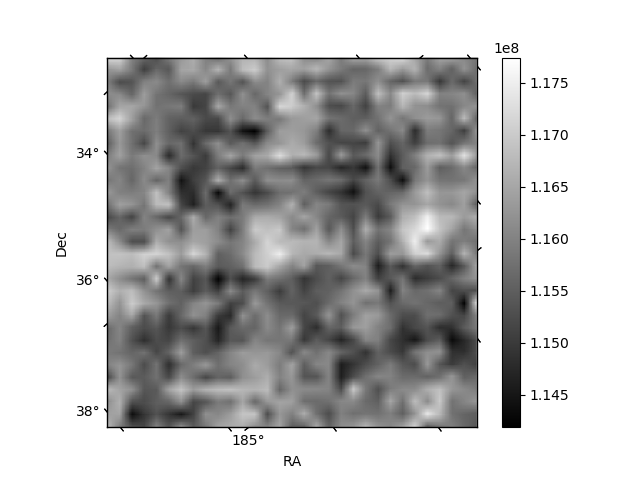
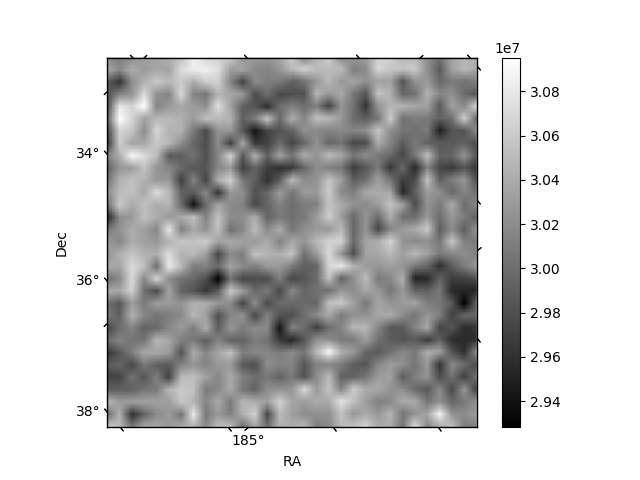
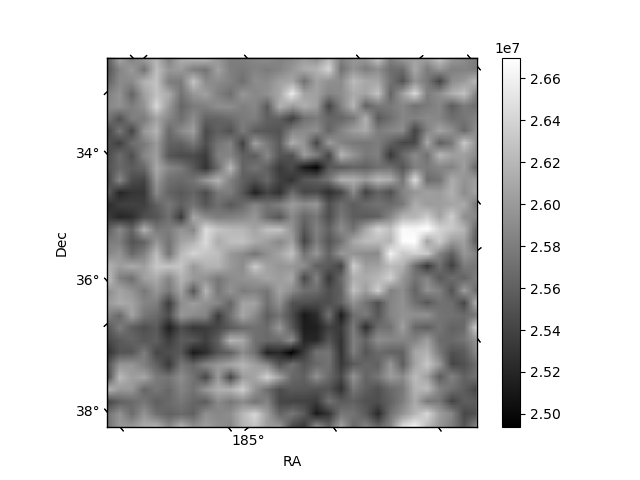
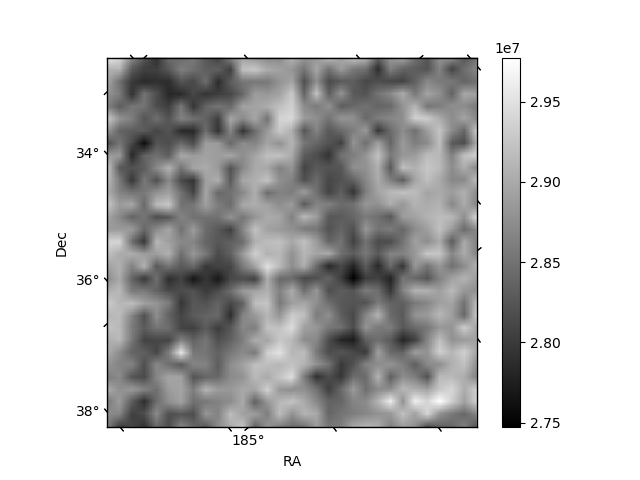
Histogram calculated using DETX and DETY for each event in the final _common_clean file
| Quadrant A | 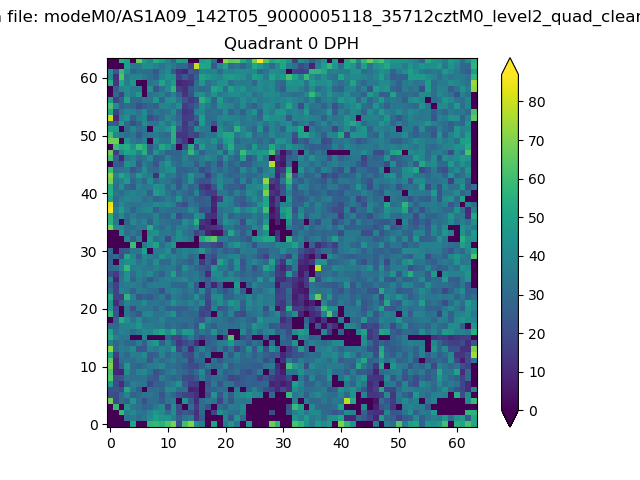 |
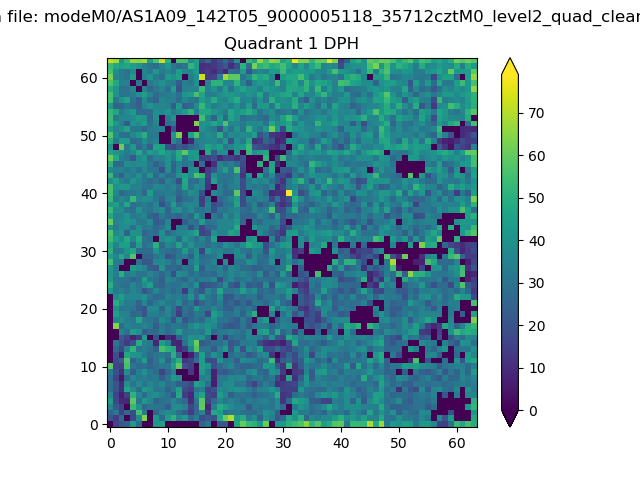 |
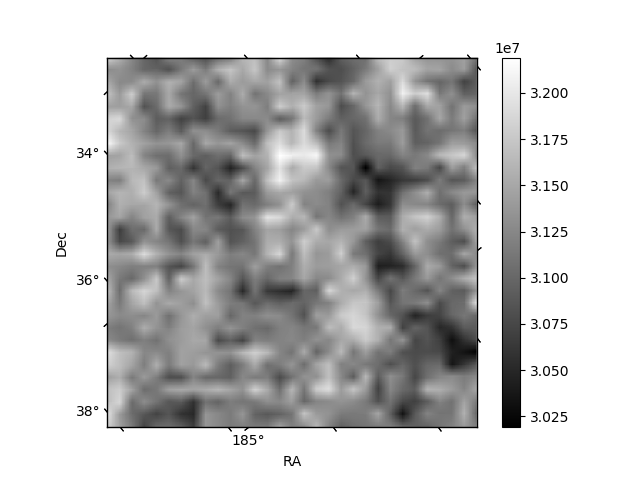
Quadrant B |
|---|---|---|---|
| Quadrant D | 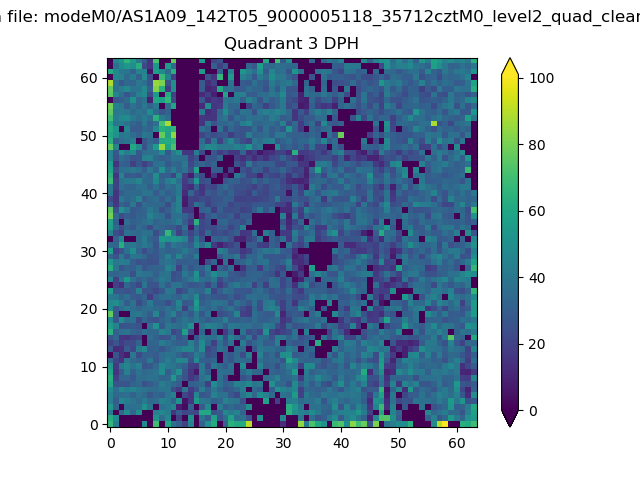 |
 |
Quadrant C |
| Plot type | Count rate plots | Images |
|---|---|---|
| Comparison with Poisson distribution Blue bars denote a histogram of data divided into 1 sec bins. Red curve is a Poisson curve with rate = median count rate of data. |
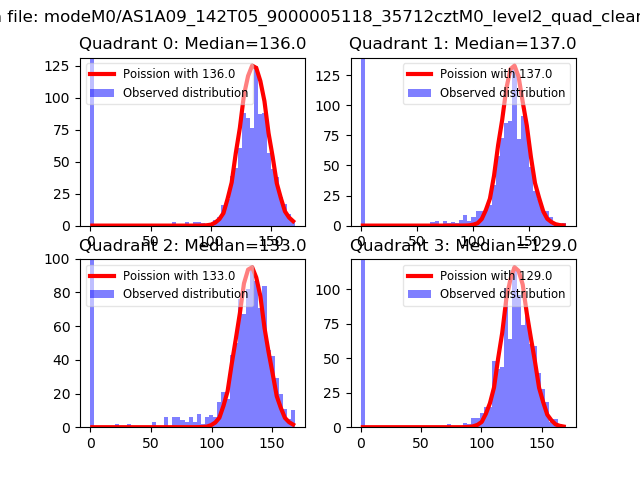 |
 |
| Quadrant-wise count rates Data is divided into 100 sec bins |
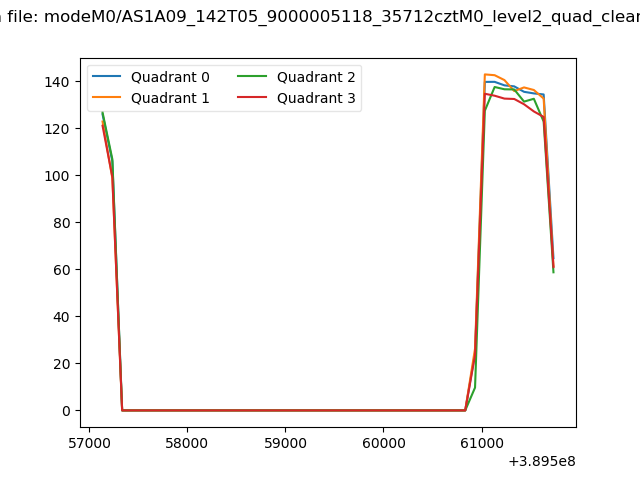 |
|
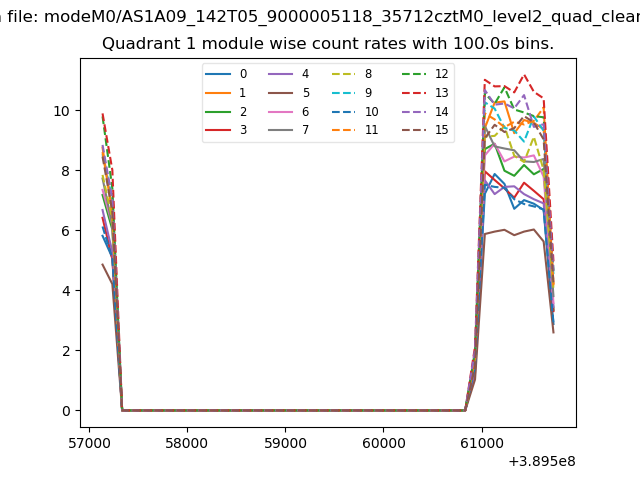
| Module-wise count rates for Quadrant A Data is divided into 100 sec bins |
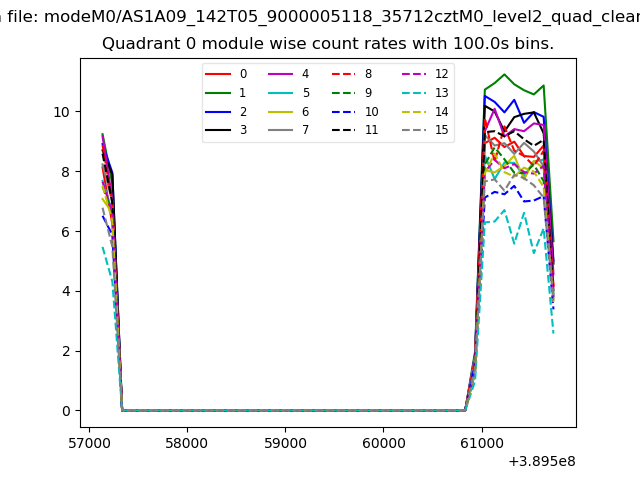 |
 |
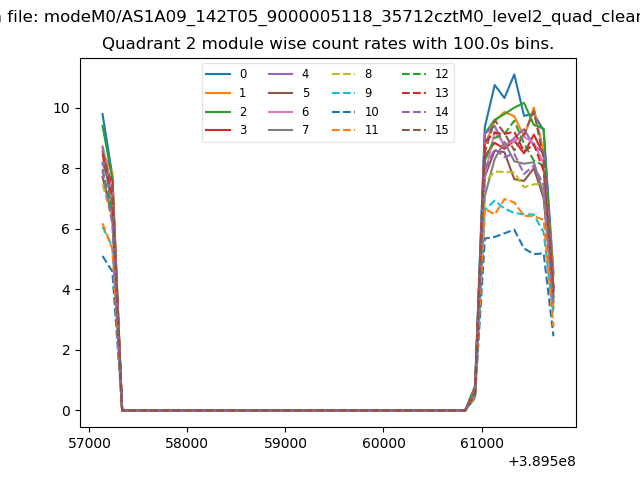
| Module-wise count rates for Quadrant B Data is divided into 100 sec bins |
 |
 |
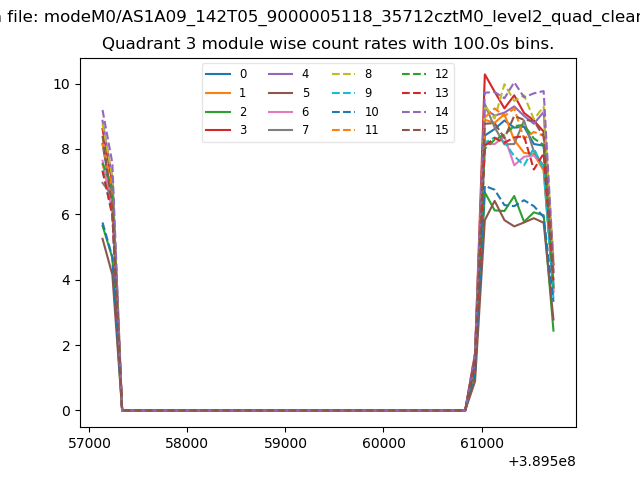
| Module-wise count rates for Quadrant C Data is divided into 100 sec bins |
 |
 |
| Module-wise count rates for Quadrant D Data is divided into 100 sec bins |
 |
 |
| Parameter | Plot |
|---|---|
| CZT HV Monitor | 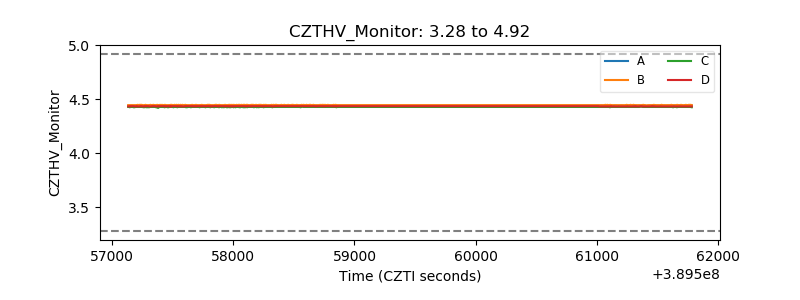 |
| D_VDD | 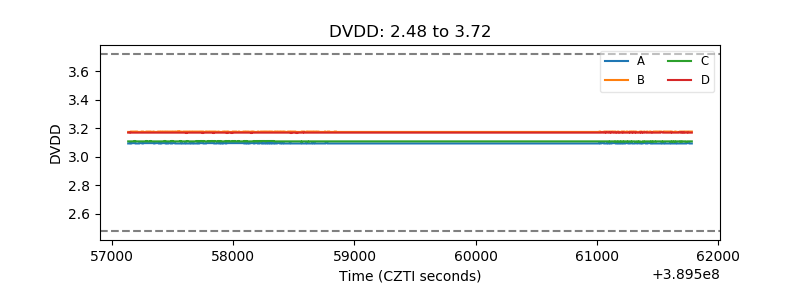 |
| Temperature 1 | 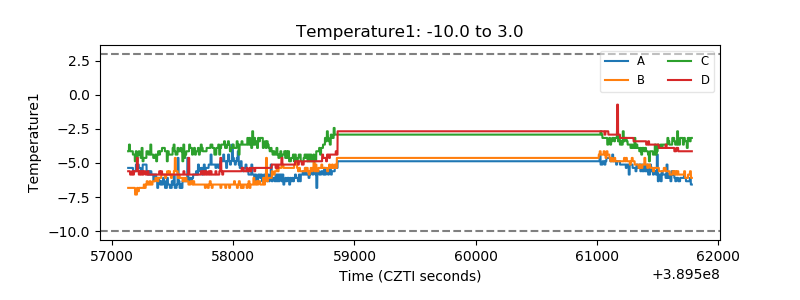 |
| Veto HV Monitor | 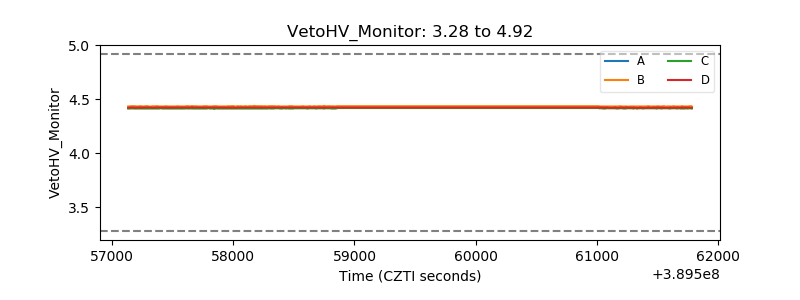 |
| Veto LLD |  |
| Alpha Counter | 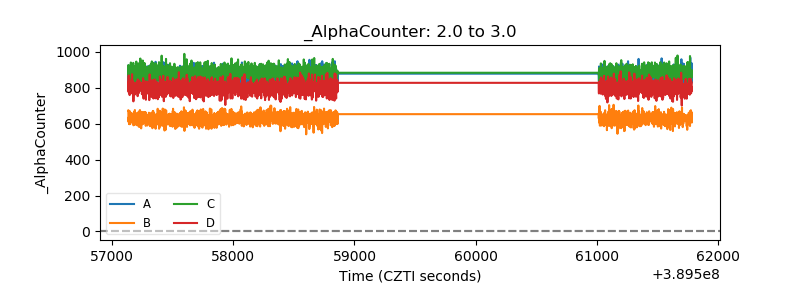 |
| _CPM_Rate | 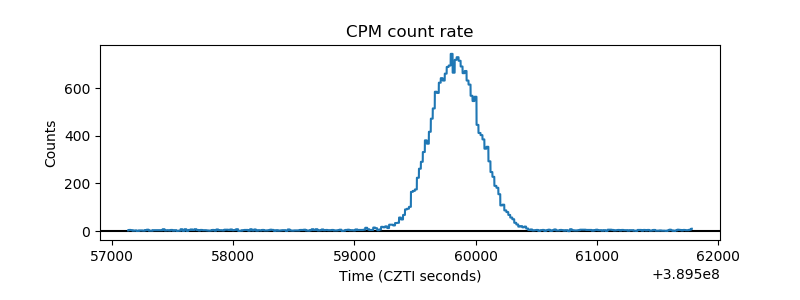 |
| CZT Counter | 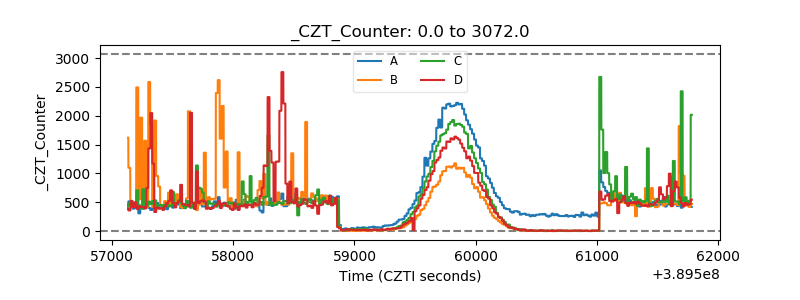 |
| +2.5 Volts monitor | 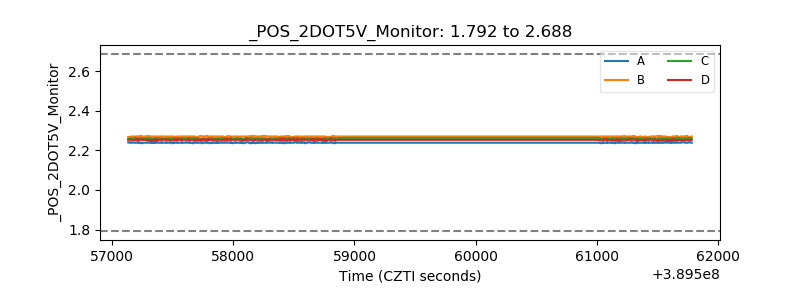 |
| +5 Volts monitor | 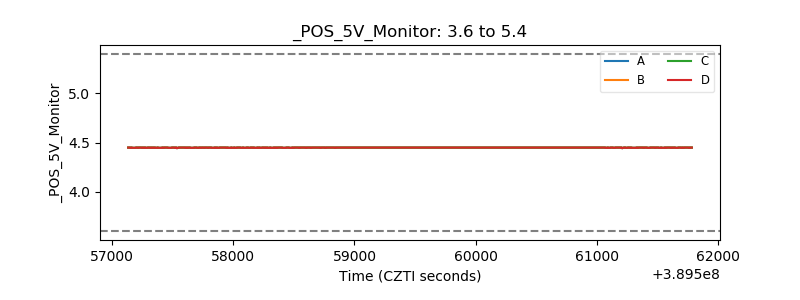 |
| _ROLL_ROT | 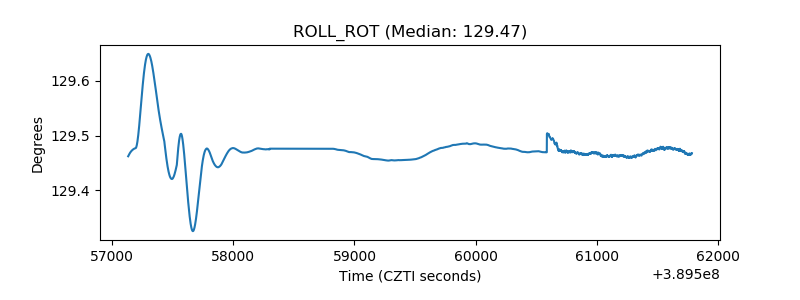 |
| _Roll_DEC | 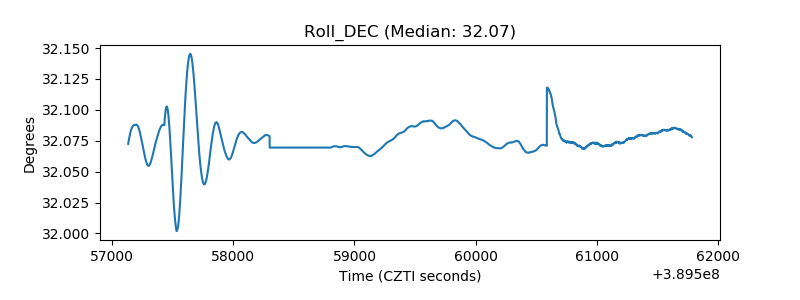 |
| _Roll_RA | 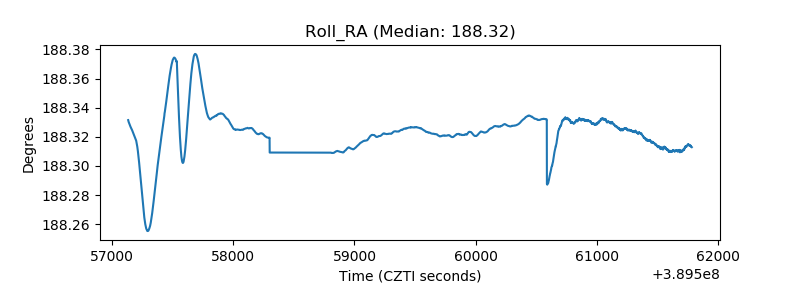 |
| Veto Counter | 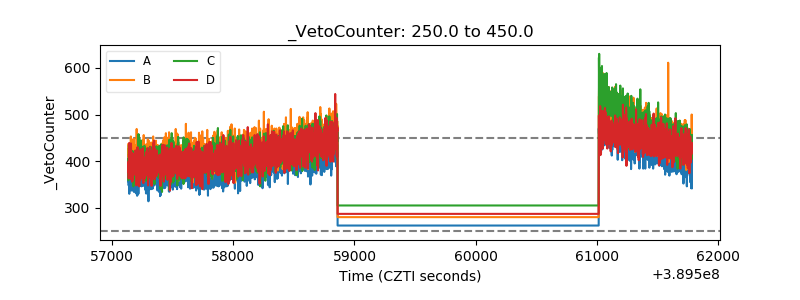 |