| Param | Original file | Final file |
|---|---|---|
| Filename | modeM0/AS1A09_029T01_9000005116_35708cztM0_level2.evt | modeM0/AS1A09_029T01_9000005116_35708cztM0_level2_quad_clean.evt |
| Size (bytes) | 391,613,760 | 88,084,800 |
| Size | 373.5 MB | 84.0 MB |
| Events in quadrant A | 2,632,036 | 585,587 |
| Events in quadrant B | 3,081,976 | 583,789 |
| Events in quadrant C | 2,973,408 | 567,347 |
| Events in quadrant D | 2,807,296 | 554,813 |
| Mode M9 | |||
|---|---|---|---|
| Quadrant | BADHDUFLAG | Total packets | Discarded packets |
| A | 0 | 19 | 0 |
| B | 0 | 19 | 0 |
| C | 0 | 19 | 0 |
| D | 0 | 19 | 0 |
| Mode SS | |||
|---|---|---|---|
| Quadrant | BADHDUFLAG | Total packets | Discarded packets |
| A | 0 | 108 | 0 |
| B | 0 | 108 | 0 |
| C | 0 | 108 | 0 |
| D | 0 | 108 | 0 |
| Mode M0 | |||
|---|---|---|---|
| Quadrant | BADHDUFLAG | Total packets | Discarded packets |
| A | 0 | 11285 | 2 |
| B | 0 | 12600 | 1 |
| C | 0 | 12174 | 1 |
| D | 0 | 11885 | 1 |
| Quadrant | Total seconds | Saturated seconds | Saturation percentage |
|---|---|---|---|
| A | 5377 | 7 | 0.130184% |
| B | 5377 | 109 | 2.027153% |
| C | 5377 | 71 | 1.320439% |
| D | 5377 | 37 | 0.688116% |
Noise dominated data is calculated using 1-second bins in cleaned event files. If a bin has >2000 counts, and if more than 50% of those come from <1% of pixels, then it is considered to be noise-dominated and hence unusable.
| Quadrant | # 1 sec bins | Bins with >0 counts | Bins with >2000 counts | High rate bins dominated by noise | Noise dominated (total time) | Noise dominated (detector-on time) | Marked lightcurve |
|---|---|---|---|---|---|---|---|
| A | 7199 | 5378 | 0 | 0 | 0.00% | 0.00% | 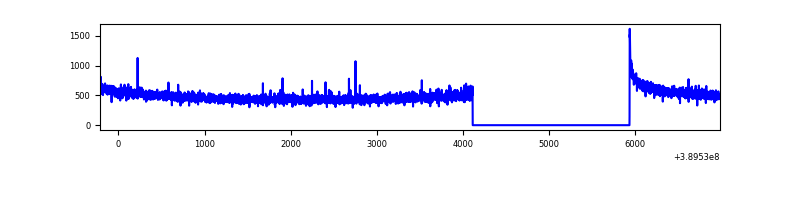 |
| B | 7199 | 5378 | 84 | 84 | 1.17% | 1.56% | 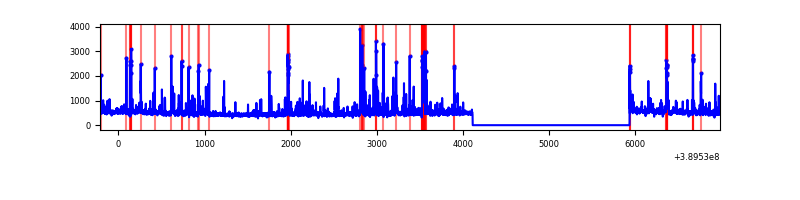 |
| C | 7199 | 5378 | 58 | 58 | 0.81% | 1.08% | 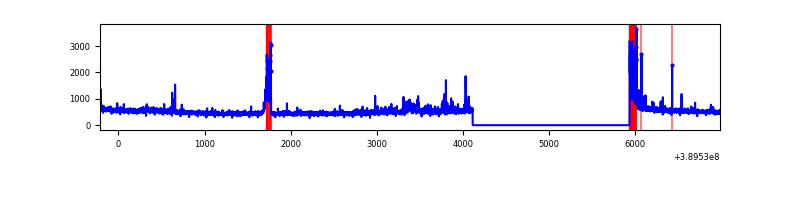 |
| D | 7199 | 5378 | 31 | 31 | 0.43% | 0.58% | 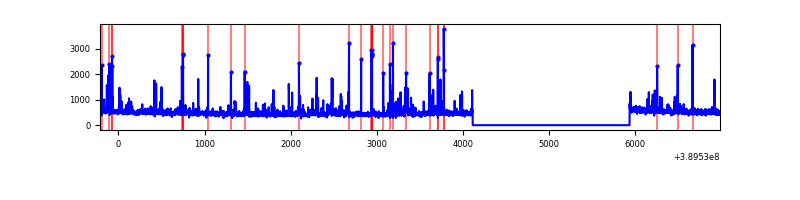 |
Top three noisy pixels from each quadrant. If the there are fewer than three noisy pixels in the level2.evt file, extra rows are filled as -1
| Pixel properties | Quadrant properties | ||||||
|---|---|---|---|---|---|---|---|
| Quadrant | DetID | PixID | Counts | Sigma | Mean | Median | Sigma |
| A | 10 | 83 | 124560 | 954.66 | 644 | 632 | 129.8 |
| A | 7 | 48 | 8958 | 64.14 | 644 | 632 | 129.8 |
| A | 15 | 223 | 6571 | 45.75 | 644 | 632 | 129.8 |
| B | 5 | 172 | 433031 | 3574.33 | 628 | 613 | 121.0 |
| B | 5 | 255 | 100372 | 824.6 | 628 | 613 | 121.0 |
| B | 15 | 85 | 26017 | 209.99 | 628 | 613 | 121.0 |
| C | 15 | 214 | 225274 | 1605.17 | 607 | 612 | 140.0 |
| C | 0 | 10 | 157292 | 1119.45 | 607 | 612 | 140.0 |
| C | 9 | 187 | 116935 | 831.11 | 607 | 612 | 140.0 |
| D | 13 | 249 | 121407 | 795.71 | 621 | 602 | 151.8 |
| D | 2 | 153 | 90496 | 592.11 | 621 | 602 | 151.8 |
| D | 2 | 250 | 54190 | 352.97 | 621 | 602 | 151.8 |
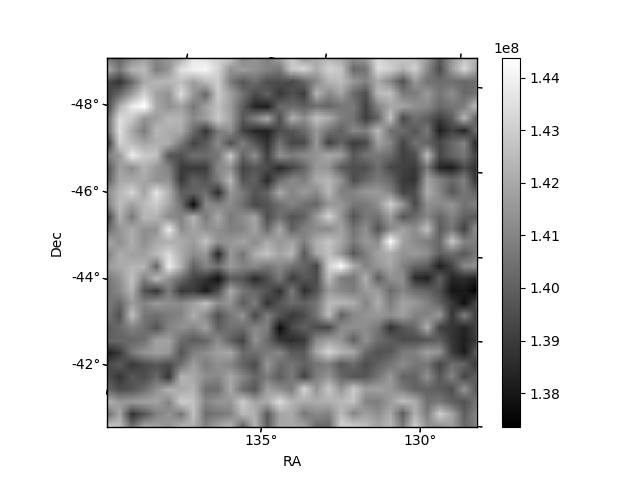
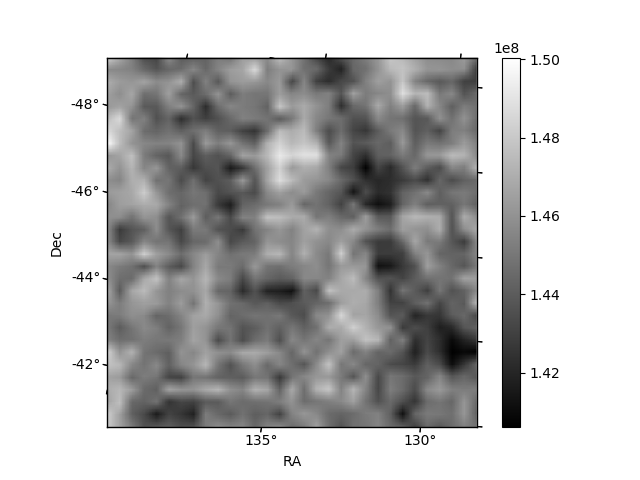
Histogram calculated using DETX and DETY for each event in the final _common_clean file
| Quadrant A | 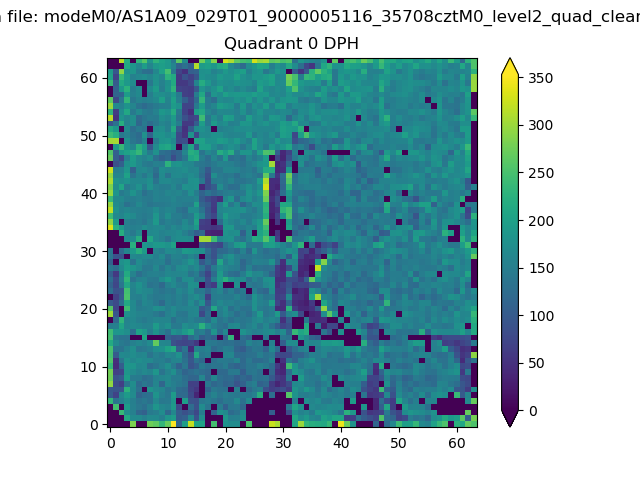 |
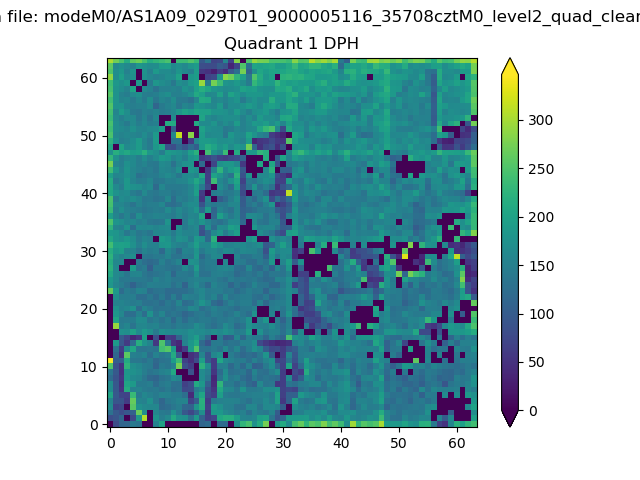 |
Quadrant B |
|---|---|---|---|
| Quadrant D | 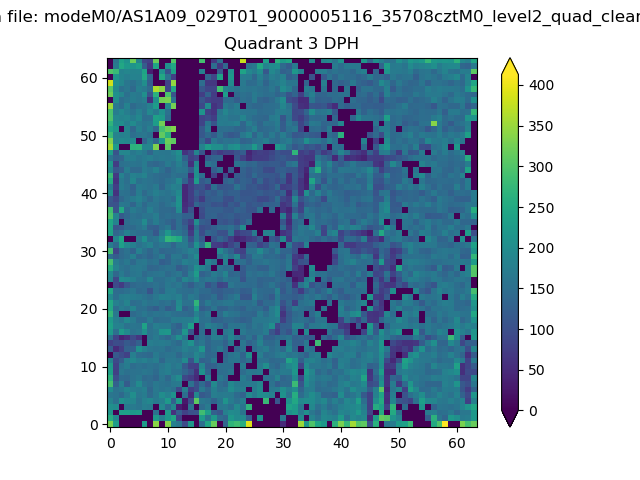 |
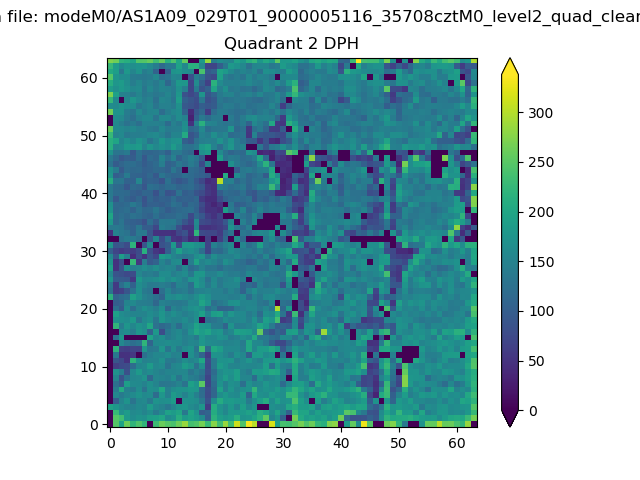 |
Quadrant C |
| Plot type | Count rate plots | Images |
|---|---|---|
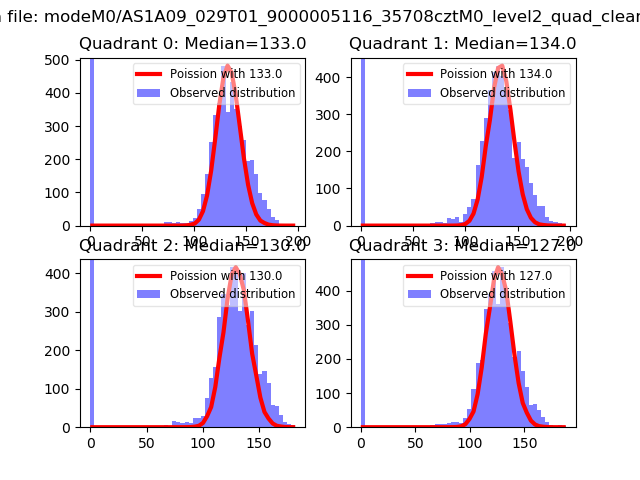
| Comparison with Poisson distribution Blue bars denote a histogram of data divided into 1 sec bins. Red curve is a Poisson curve with rate = median count rate of data. |
 |
 |
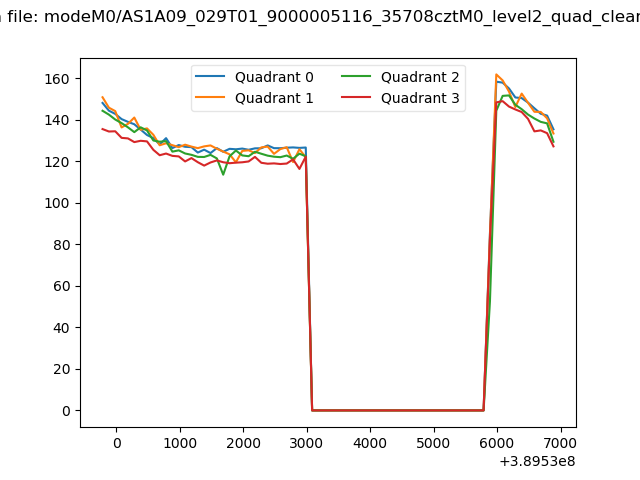
| Quadrant-wise count rates Data is divided into 100 sec bins |
 |
|
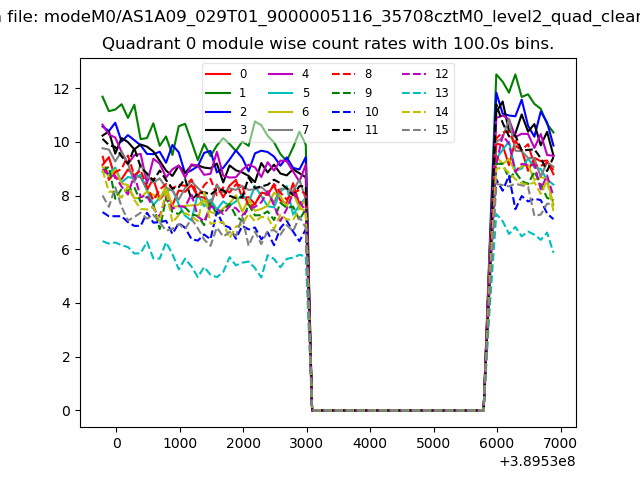
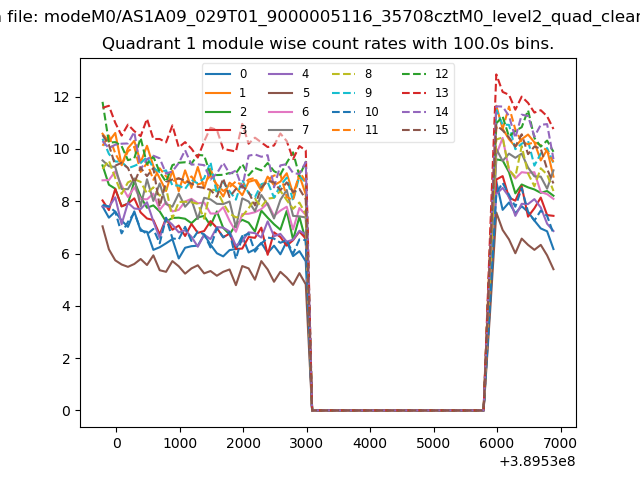
| Module-wise count rates for Quadrant A Data is divided into 100 sec bins |
 |
 |
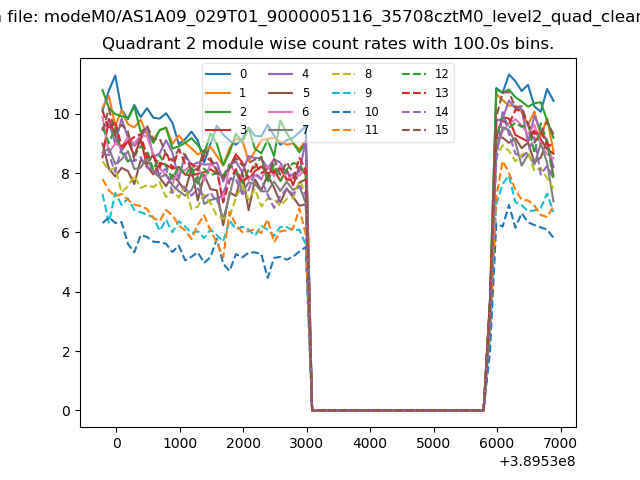
| Module-wise count rates for Quadrant B Data is divided into 100 sec bins |
 |
 |
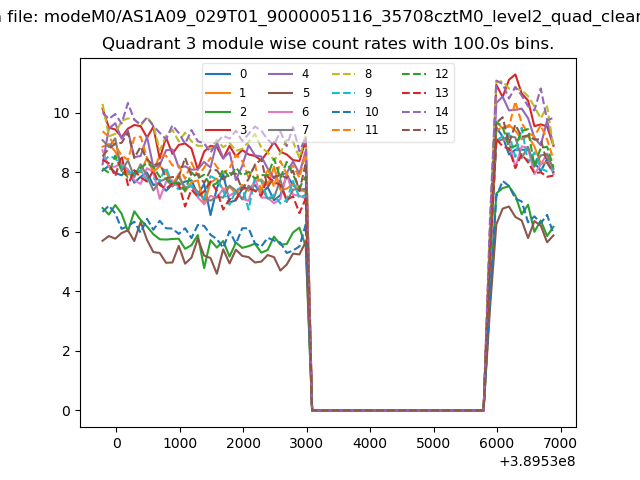
| Module-wise count rates for Quadrant C Data is divided into 100 sec bins |
 |
 |
| Module-wise count rates for Quadrant D Data is divided into 100 sec bins |
 |
 |
| Parameter | Plot |
|---|---|
| CZT HV Monitor | 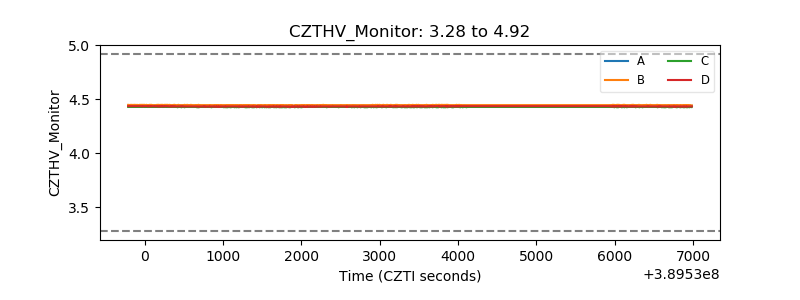 |
| D_VDD |  |
| Temperature 1 | 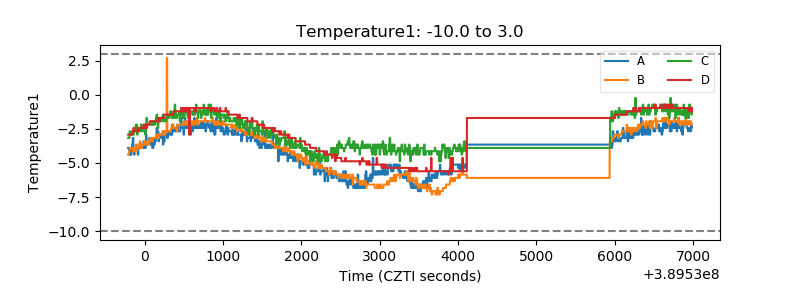 |
| Veto HV Monitor | 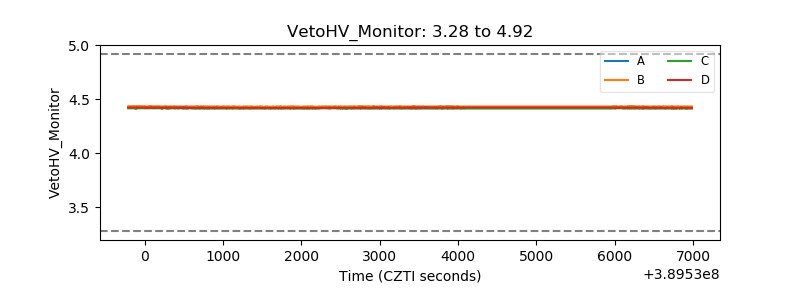 |
| Veto LLD | 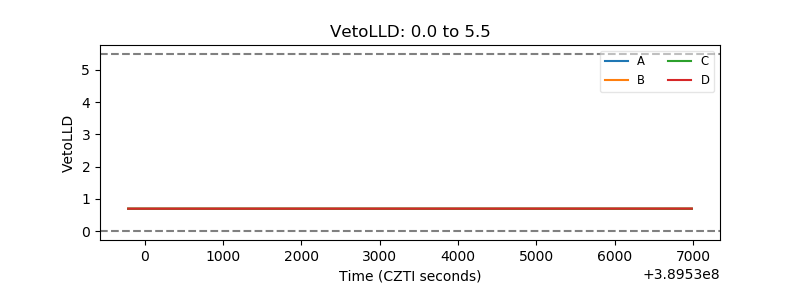 |
| Alpha Counter | 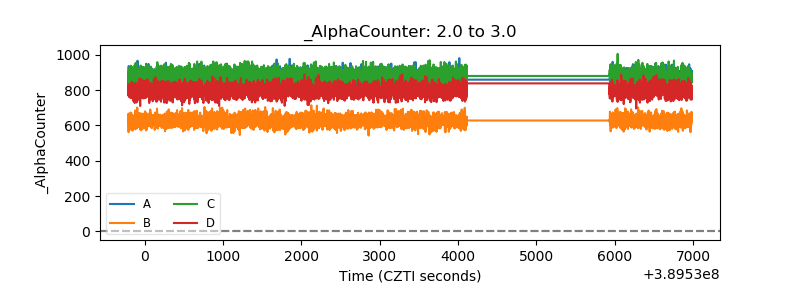 |
| _CPM_Rate | 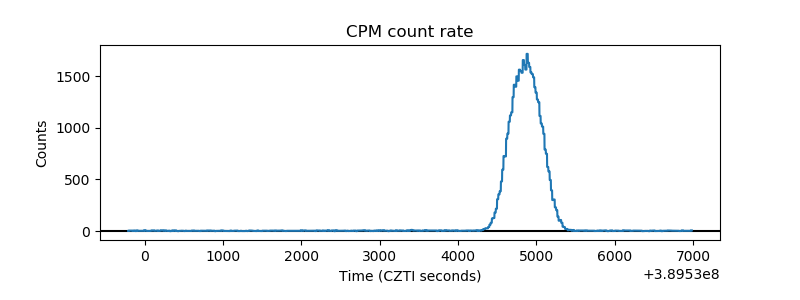 |
| CZT Counter | 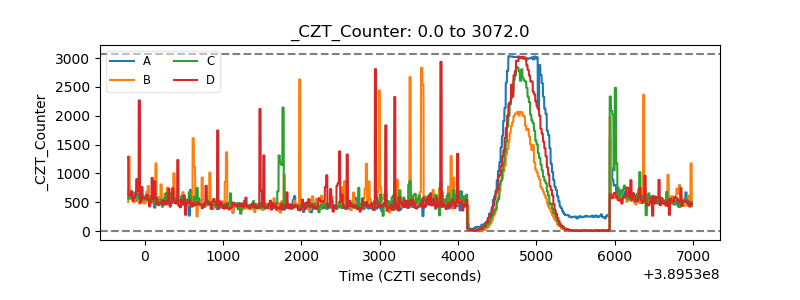 |
| +2.5 Volts monitor | 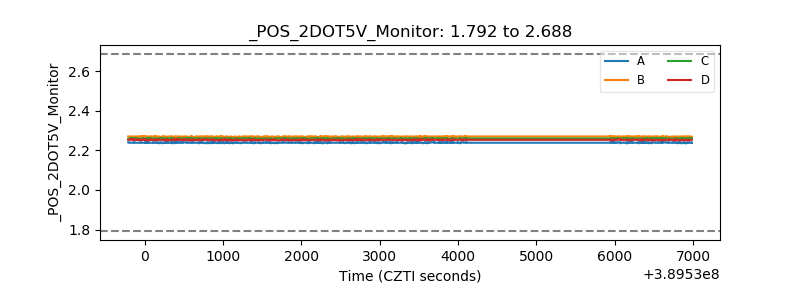 |
| +5 Volts monitor | 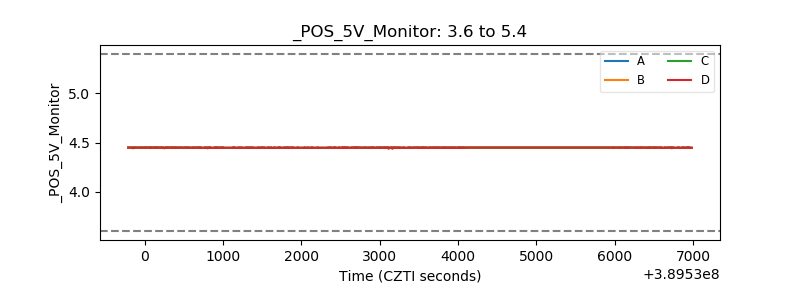 |
| _ROLL_ROT | 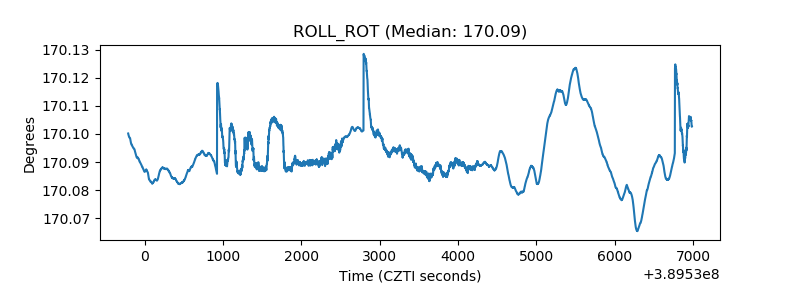 |
| _Roll_DEC | 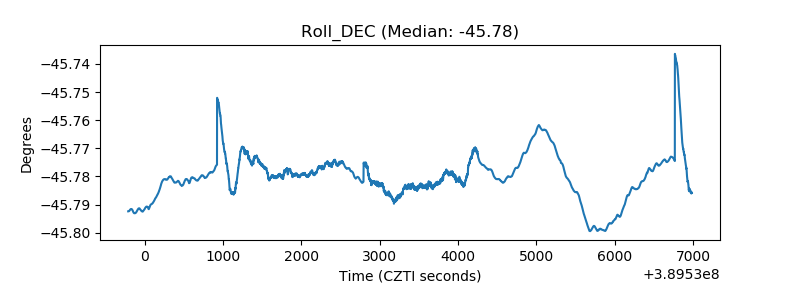 |
| _Roll_RA | 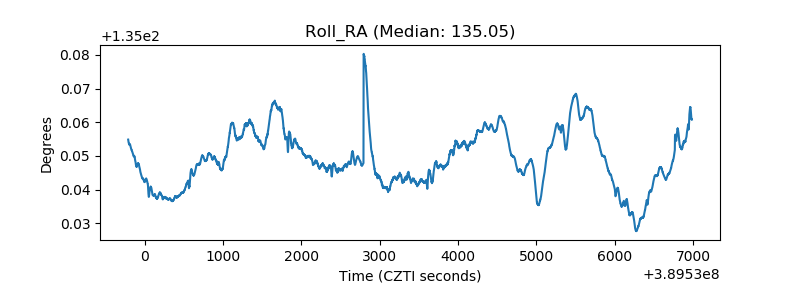 |
| Veto Counter | 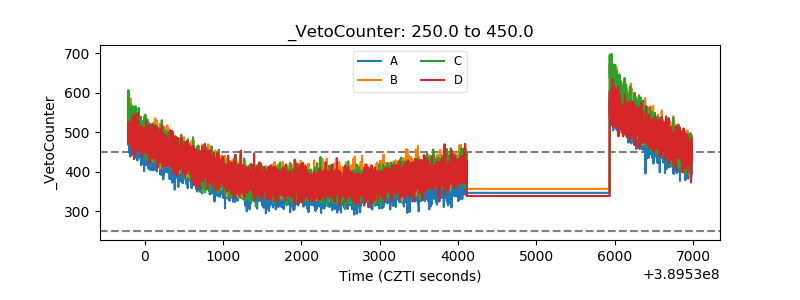 |