| Param | Original file | Final file |
|---|---|---|
| Filename | modeM0/AS1A09_029T01_9000005116_35706cztM0_level2.evt | modeM0/AS1A09_029T01_9000005116_35706cztM0_level2_quad_clean.evt |
| Size (bytes) | 416,151,360 | 90,397,440 |
| Size | 396.9 MB | 86.2 MB |
| Events in quadrant A | 2,670,717 | 601,820 |
| Events in quadrant B | 3,466,100 | 594,298 |
| Events in quadrant C | 3,079,094 | 591,579 |
| Events in quadrant D | 3,014,571 | 566,186 |
| Mode M9 | |||
|---|---|---|---|
| Quadrant | BADHDUFLAG | Total packets | Discarded packets |
| A | 0 | 19 | 0 |
| B | 0 | 19 | 0 |
| C | 0 | 19 | 0 |
| D | 0 | 20 | 0 |
| Mode SS | |||
|---|---|---|---|
| Quadrant | BADHDUFLAG | Total packets | Discarded packets |
| A | 0 | 112 | 0 |
| B | 0 | 112 | 0 |
| C | 0 | 112 | 0 |
| D | 0 | 112 | 0 |
| Mode M0 | |||
|---|---|---|---|
| Quadrant | BADHDUFLAG | Total packets | Discarded packets |
| A | 0 | 11494 | 3 |
| B | 0 | 13811 | 2 |
| C | 0 | 12585 | 2 |
| D | 0 | 12685 | 2 |
| Quadrant | Total seconds | Saturated seconds | Saturation percentage |
|---|---|---|---|
| A | 5482 | 18 | 0.328347% |
| B | 5482 | 229 | 4.177308% |
| C | 5482 | 83 | 1.514046% |
| D | 5482 | 122 | 2.225465% |
Noise dominated data is calculated using 1-second bins in cleaned event files. If a bin has >2000 counts, and if more than 50% of those come from <1% of pixels, then it is considered to be noise-dominated and hence unusable.
| Quadrant | # 1 sec bins | Bins with >0 counts | Bins with >2000 counts | High rate bins dominated by noise | Noise dominated (total time) | Noise dominated (detector-on time) | Marked lightcurve |
|---|---|---|---|---|---|---|---|
| A | 7155 | 5483 | 1 | 1 | 0.01% | 0.02% | 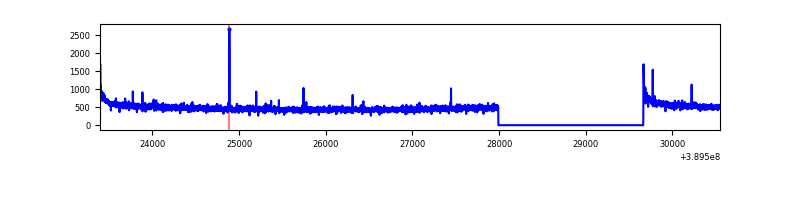 |
| B | 7155 | 5483 | 176 | 176 | 2.46% | 3.21% | 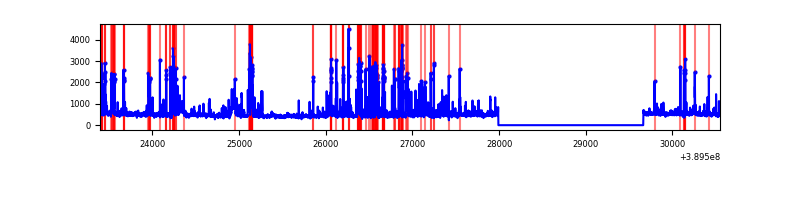 |
| C | 7155 | 5483 | 65 | 65 | 0.91% | 1.19% | 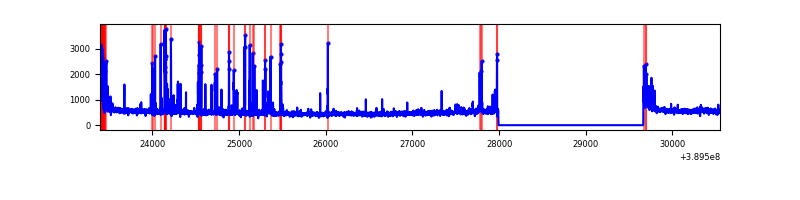 |
| D | 7155 | 5483 | 95 | 95 | 1.33% | 1.73% | 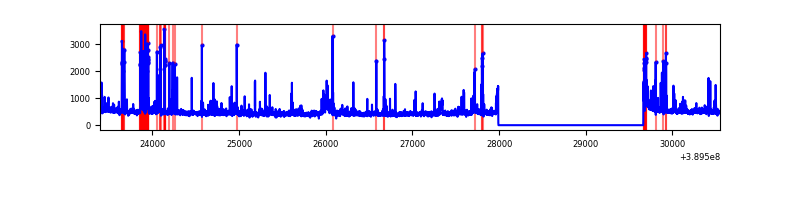 |
Top three noisy pixels from each quadrant. If the there are fewer than three noisy pixels in the level2.evt file, extra rows are filled as -1
| Pixel properties | Quadrant properties | ||||||
|---|---|---|---|---|---|---|---|
| Quadrant | DetID | PixID | Counts | Sigma | Mean | Median | Sigma |
| A | 10 | 83 | 151681 | 1136.4 | 646 | 633 | 132.9 |
| A | 10 | 255 | 13064 | 93.52 | 646 | 633 | 132.9 |
| A | 3 | 137 | 6661 | 45.35 | 646 | 633 | 132.9 |
| B | 5 | 172 | 665528 | 5462.17 | 626 | 609 | 121.7 |
| B | 0 | 189 | 240880 | 1973.77 | 626 | 609 | 121.7 |
| B | 5 | 255 | 58103 | 472.3 | 626 | 609 | 121.7 |
| C | 0 | 10 | 365938 | 2528.54 | 618 | 619 | 144.5 |
| C | 15 | 214 | 232906 | 1607.77 | 618 | 619 | 144.5 |
| C | 9 | 187 | 55258 | 378.18 | 618 | 619 | 144.5 |
| D | 12 | 6 | 215514 | 1409.37 | 620 | 603 | 152.5 |
| D | 13 | 249 | 184630 | 1206.84 | 620 | 603 | 152.5 |
| D | 2 | 153 | 92612 | 603.39 | 620 | 603 | 152.5 |
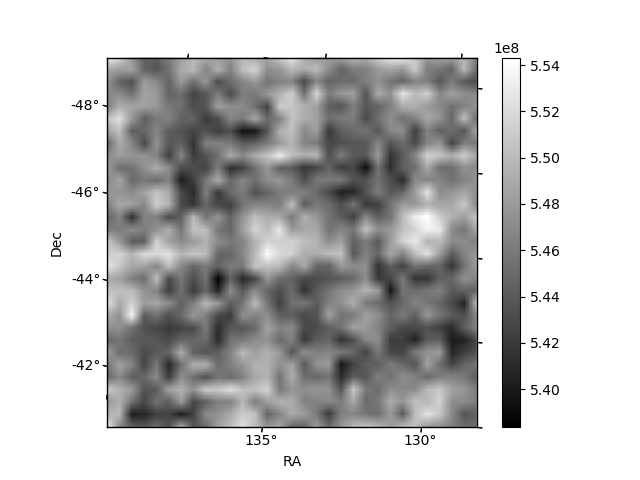
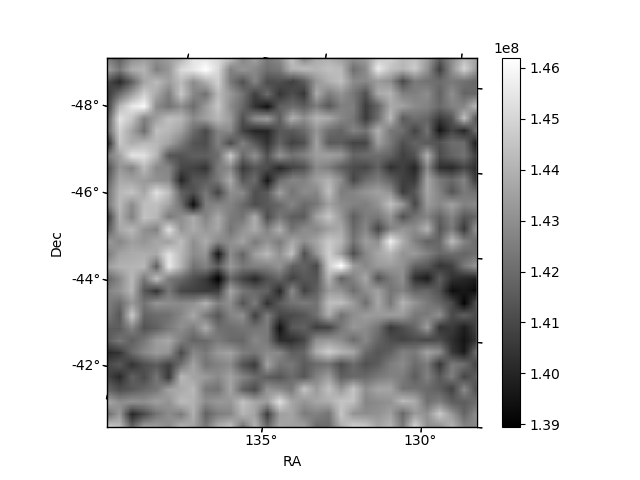
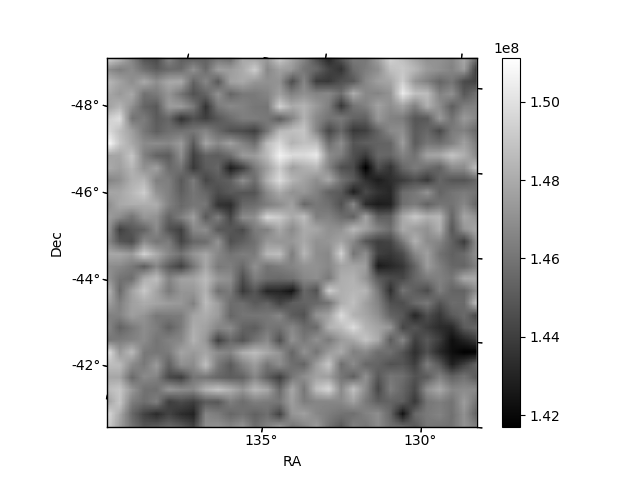
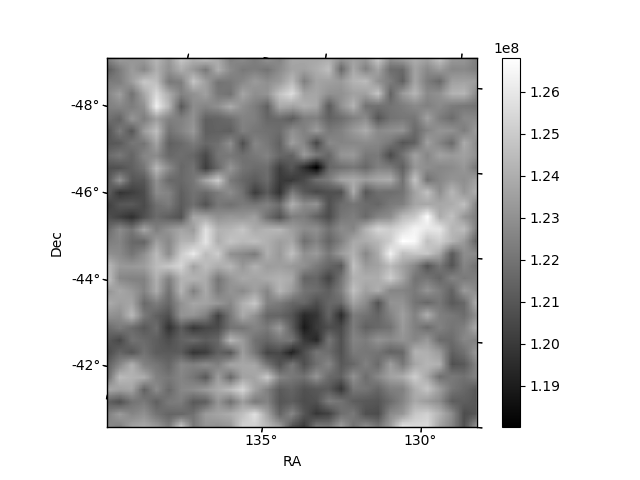
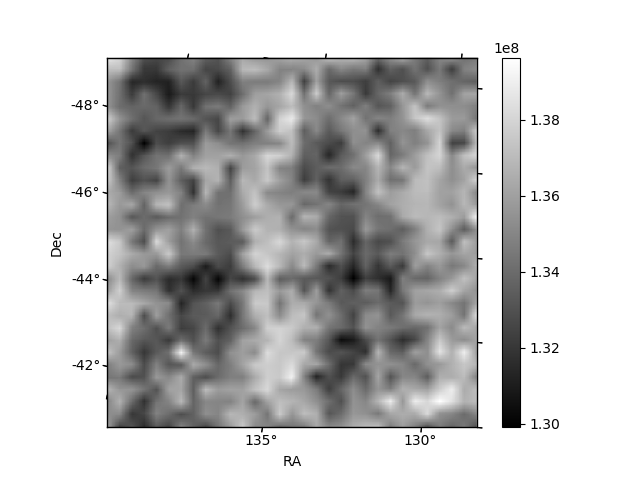
Histogram calculated using DETX and DETY for each event in the final _common_clean file
| Quadrant A | 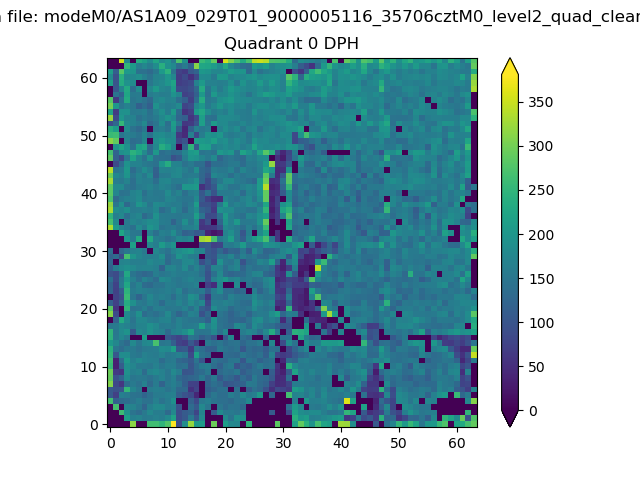 |
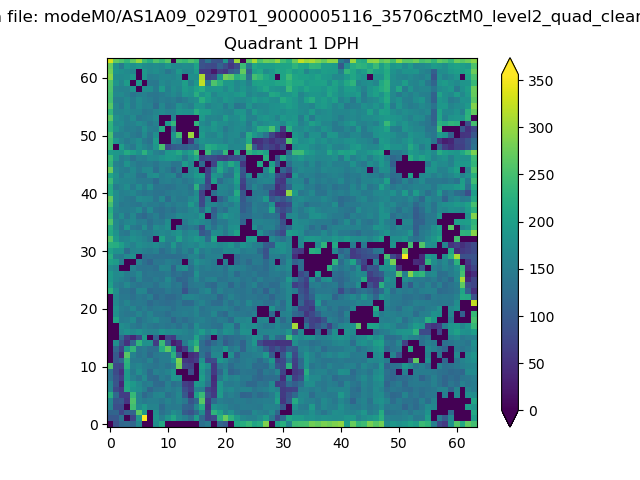 |
Quadrant B |
|---|---|---|---|
| Quadrant D | 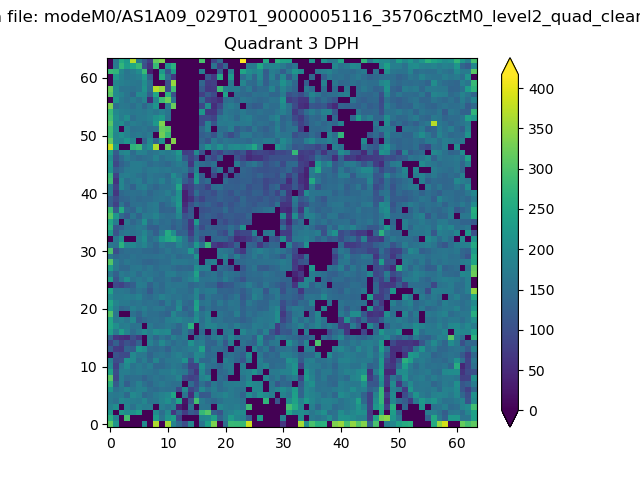 |
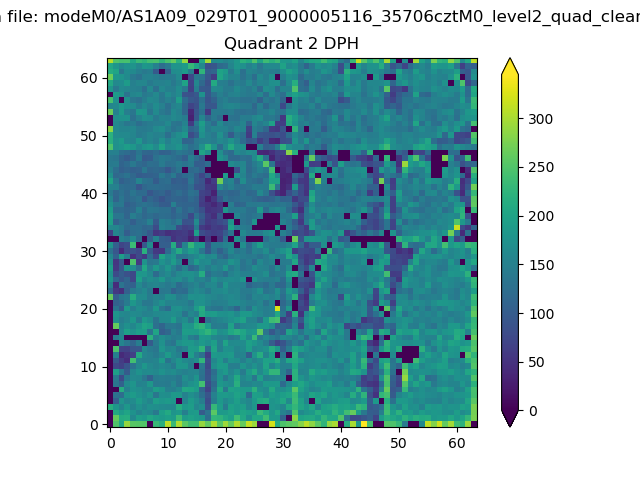 |
Quadrant C |
| Plot type | Count rate plots | Images |
|---|---|---|
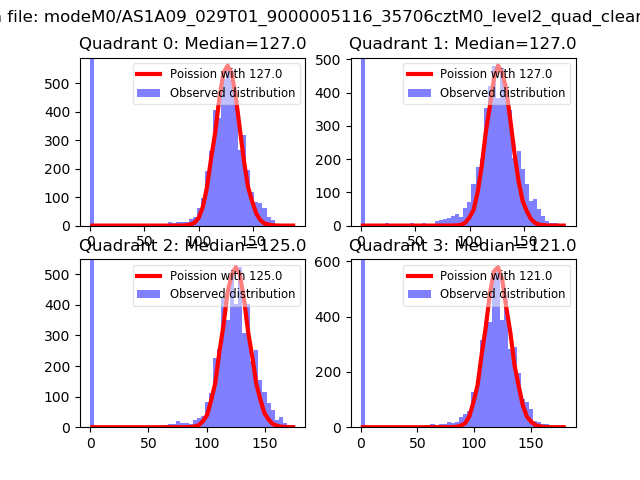
| Comparison with Poisson distribution Blue bars denote a histogram of data divided into 1 sec bins. Red curve is a Poisson curve with rate = median count rate of data. |
 |
 |
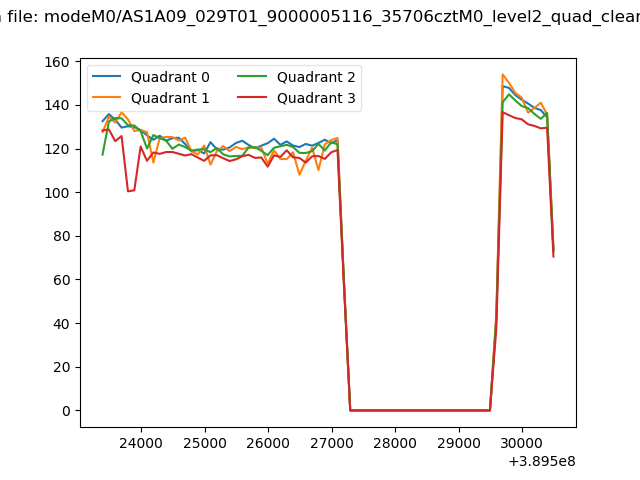
| Quadrant-wise count rates Data is divided into 100 sec bins |
 |
|
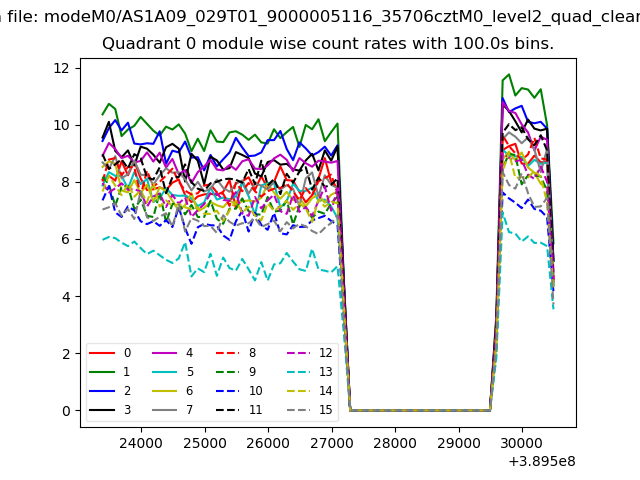
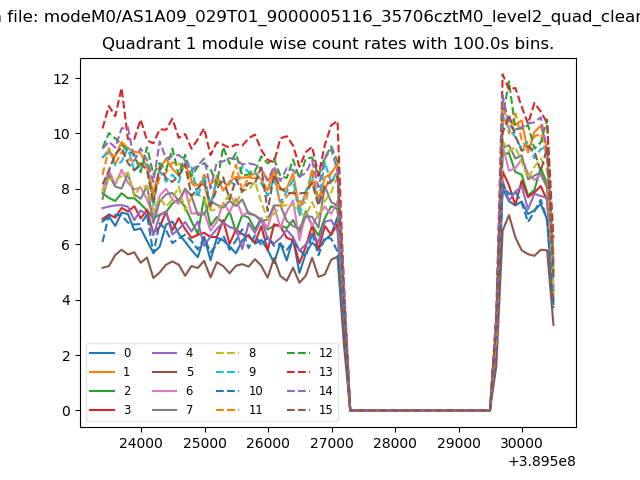
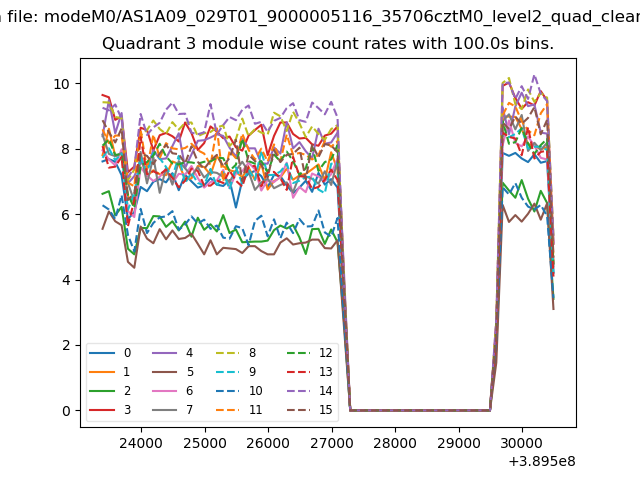
| Module-wise count rates for Quadrant A Data is divided into 100 sec bins |
 |
 |
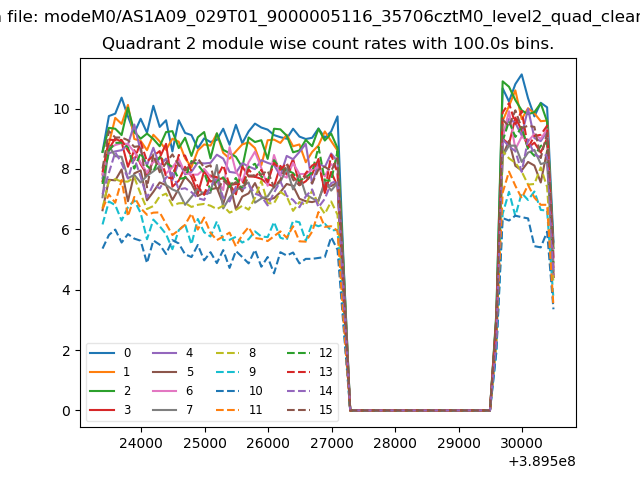
| Module-wise count rates for Quadrant B Data is divided into 100 sec bins |
 |
 |
| Module-wise count rates for Quadrant C Data is divided into 100 sec bins |
 |
 |
| Module-wise count rates for Quadrant D Data is divided into 100 sec bins |
 |
 |
| Parameter | Plot |
|---|---|
| CZT HV Monitor | 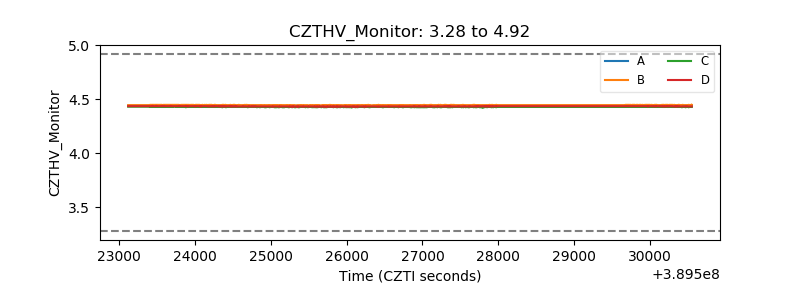 |
| D_VDD |  |
| Temperature 1 | 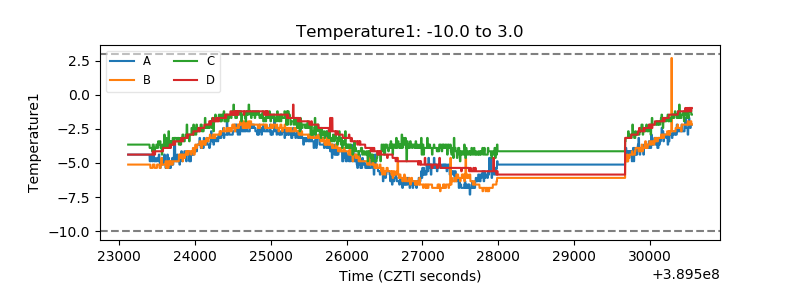 |
| Veto HV Monitor | 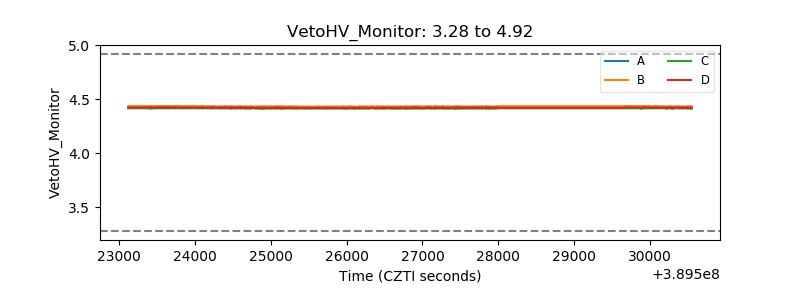 |
| Veto LLD | 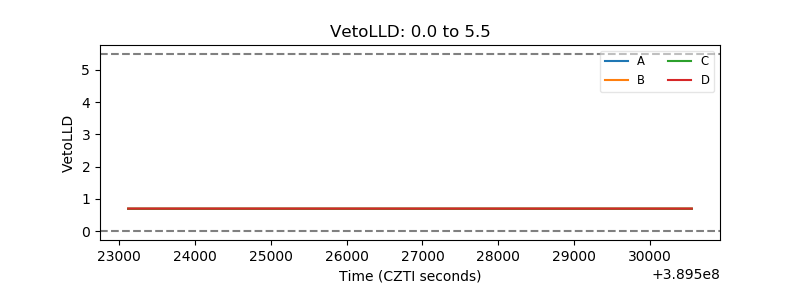 |
| Alpha Counter | 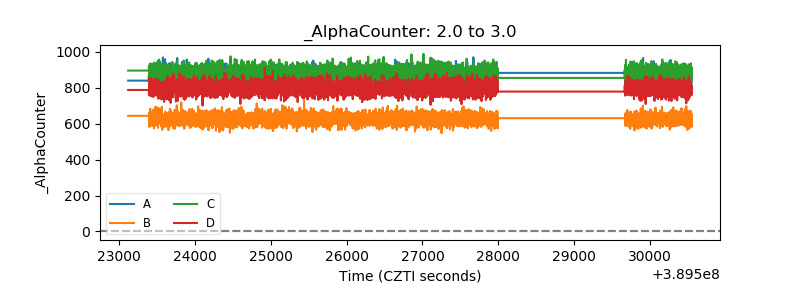 |
| _CPM_Rate | 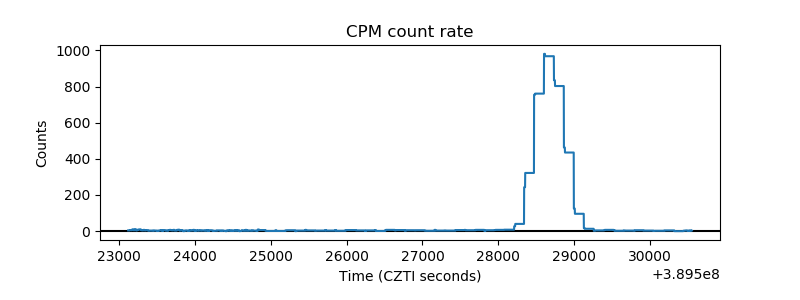 |
| CZT Counter |  |
| +2.5 Volts monitor | 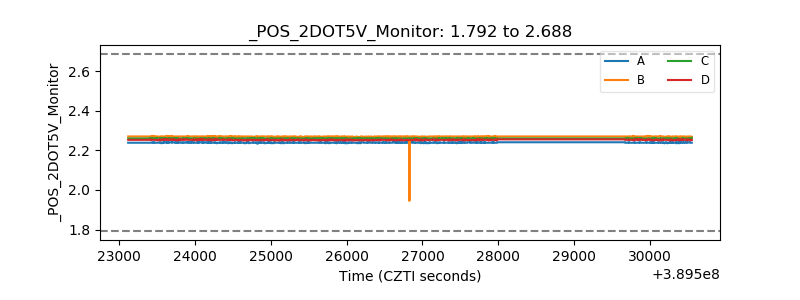 |
| +5 Volts monitor | 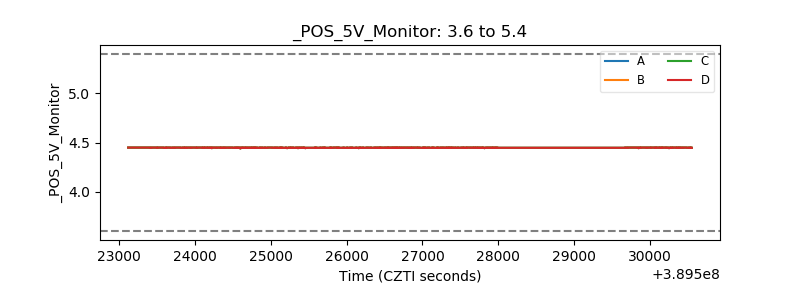 |
| _ROLL_ROT | 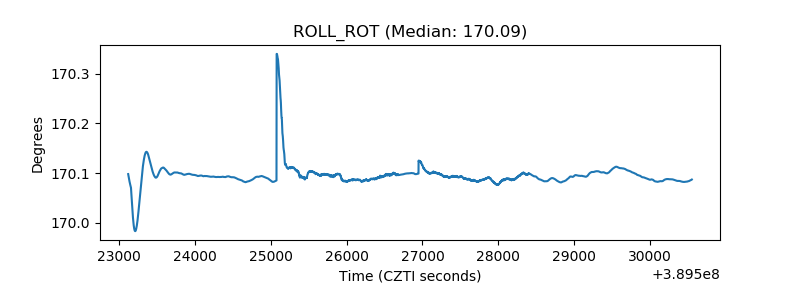 |
| _Roll_DEC | 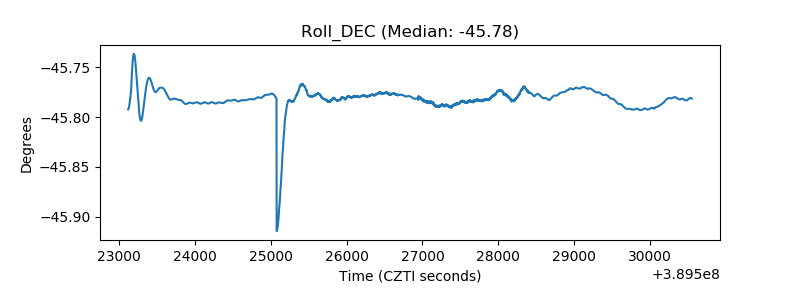 |
| _Roll_RA | 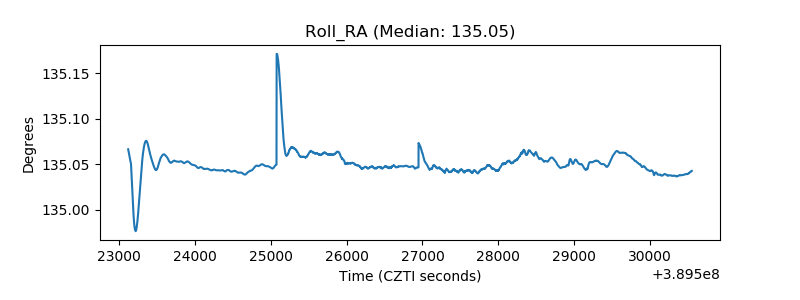 |
| Veto Counter | 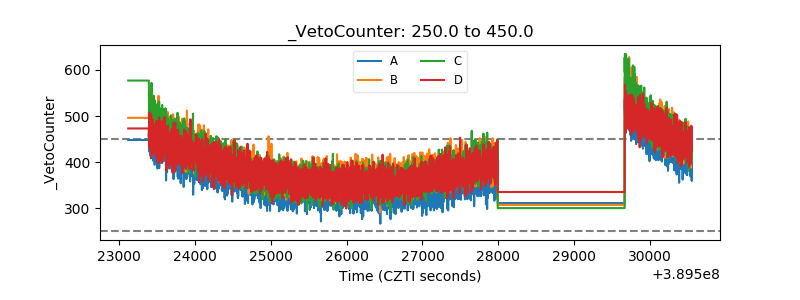 |