| Param | Original file | Final file |
|---|---|---|
| Filename | modeM0/AS1A09_029T01_9000005116_35705cztM0_level2.evt | modeM0/AS1A09_029T01_9000005116_35705cztM0_level2_quad_clean.evt |
| Size (bytes) | 88,568,640 | 18,745,920 |
| Size | 84.5 MB | 17.9 MB |
| Events in quadrant A | 533,818 | 126,321 |
| Events in quadrant B | 698,971 | 125,715 |
| Events in quadrant C | 669,591 | 124,702 |
| Events in quadrant D | 710,575 | 115,186 |
| Mode M9 | |||
|---|---|---|---|
| Quadrant | BADHDUFLAG | Total packets | Discarded packets |
| A | 0 | 8 | 0 |
| B | 0 | 8 | 0 |
| C | 0 | 8 | 0 |
| D | 0 | 8 | 0 |
| Mode SS | |||
|---|---|---|---|
| Quadrant | BADHDUFLAG | Total packets | Discarded packets |
| A | 0 | 20 | 0 |
| B | 0 | 20 | 0 |
| C | 0 | 20 | 0 |
| D | 0 | 20 | 0 |
| Mode M0 | |||
|---|---|---|---|
| Quadrant | BADHDUFLAG | Total packets | Discarded packets |
| A | 0 | 2149 | 2 |
| B | 0 | 2649 | 1 |
| C | 0 | 2539 | 1 |
| D | 0 | 2690 | 1 |
| Quadrant | Total seconds | Saturated seconds | Saturation percentage |
|---|---|---|---|
| A | 973 | 6 | 0.616650% |
| B | 973 | 73 | 7.502569% |
| C | 973 | 46 | 4.727646% |
| D | 973 | 85 | 8.735868% |
Noise dominated data is calculated using 1-second bins in cleaned event files. If a bin has >2000 counts, and if more than 50% of those come from <1% of pixels, then it is considered to be noise-dominated and hence unusable.
| Quadrant | # 1 sec bins | Bins with >0 counts | Bins with >2000 counts | High rate bins dominated by noise | Noise dominated (total time) | Noise dominated (detector-on time) | Marked lightcurve |
|---|---|---|---|---|---|---|---|
| A | 973 | 973 | 0 | 0 | 0.00% | 0.00% | 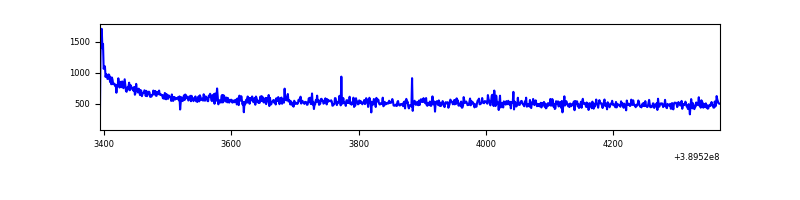 |
| B | 973 | 973 | 48 | 48 | 4.93% | 4.93% | 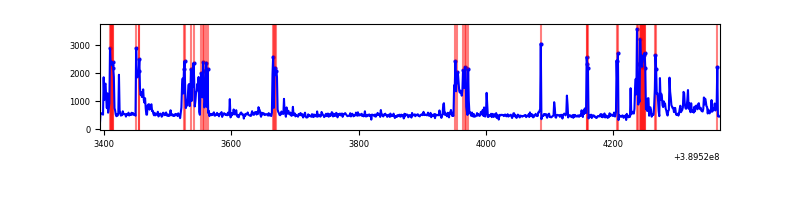 |
| C | 973 | 973 | 31 | 31 | 3.19% | 3.19% | 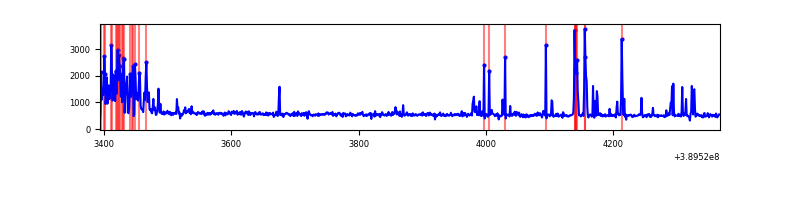 |
| D | 973 | 973 | 71 | 71 | 7.30% | 7.30% | 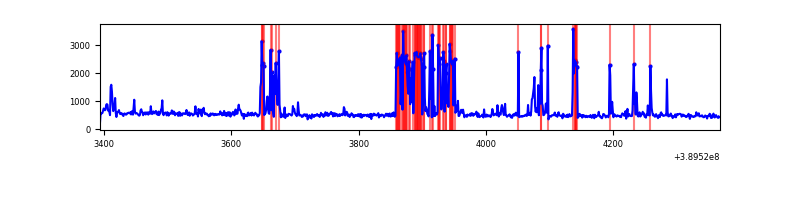 |
Top three noisy pixels from each quadrant. If the there are fewer than three noisy pixels in the level2.evt file, extra rows are filled as -1
| Pixel properties | Quadrant properties | ||||||
|---|---|---|---|---|---|---|---|
| Quadrant | DetID | PixID | Counts | Sigma | Mean | Median | Sigma |
| A | 10 | 83 | 52179 | 1921.18 | 124 | 121 | 27.1 |
| A | 10 | 67 | 1812 | 62.41 | 124 | 121 | 27.1 |
| A | 3 | 137 | 1311 | 43.92 | 124 | 121 | 27.1 |
| B | 5 | 172 | 227153 | 8943.49 | 118 | 114 | 25.4 |
| B | 5 | 255 | 4187 | 160.44 | 118 | 114 | 25.4 |
| B | 11 | 111 | 2880 | 108.96 | 118 | 114 | 25.4 |
| C | 0 | 10 | 147738 | 4945.32 | 119 | 119 | 29.9 |
| C | 15 | 214 | 46028 | 1537.98 | 119 | 119 | 29.9 |
| C | 15 | 208 | 4956 | 162.04 | 119 | 119 | 29.9 |
| D | 12 | 6 | 183842 | 6098.51 | 117 | 113 | 30.1 |
| D | 13 | 249 | 51163 | 1694.5 | 117 | 113 | 30.1 |
| D | 2 | 153 | 12143 | 399.31 | 117 | 113 | 30.1 |
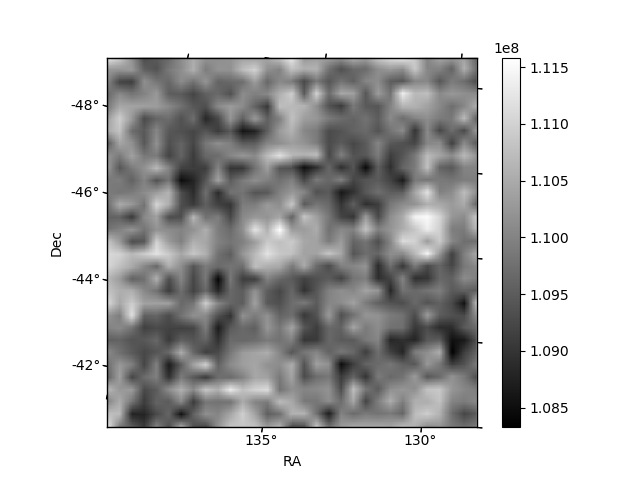
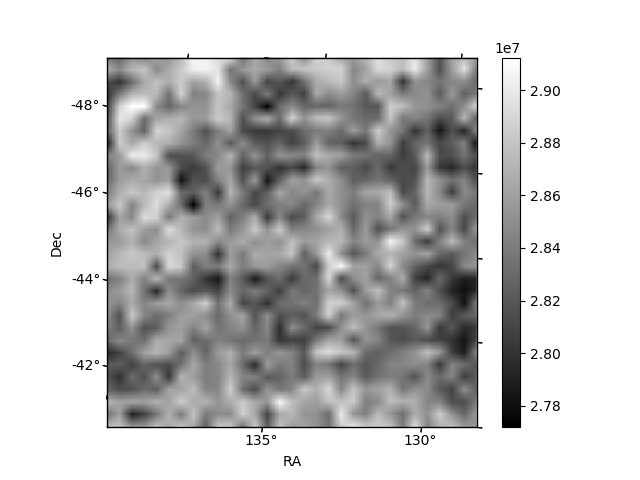
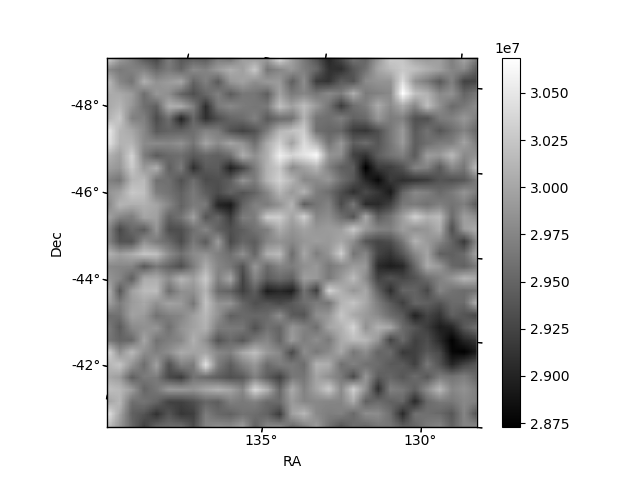
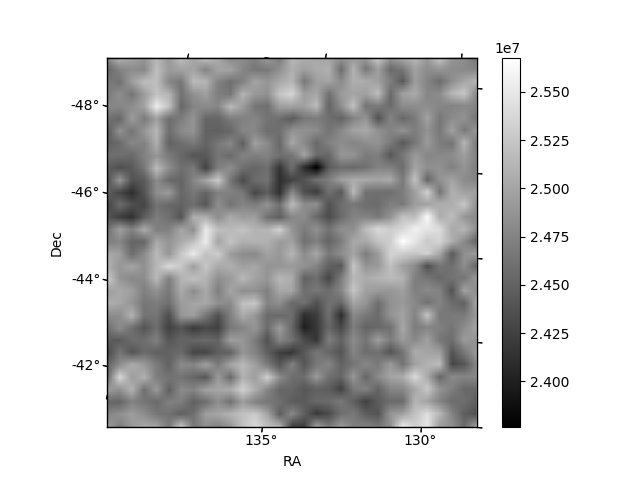
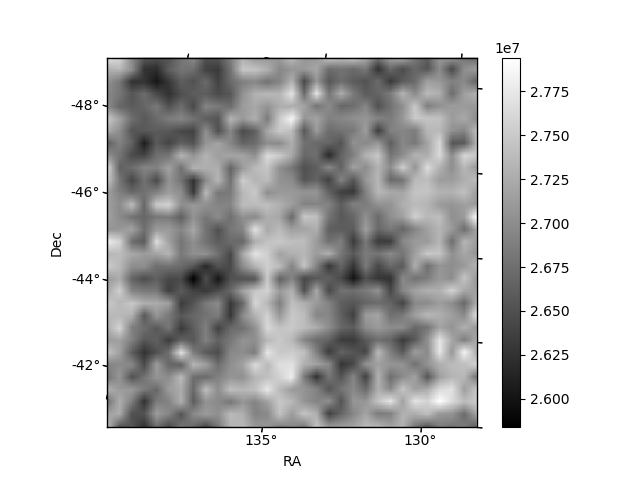
Histogram calculated using DETX and DETY for each event in the final _common_clean file
| Quadrant A | 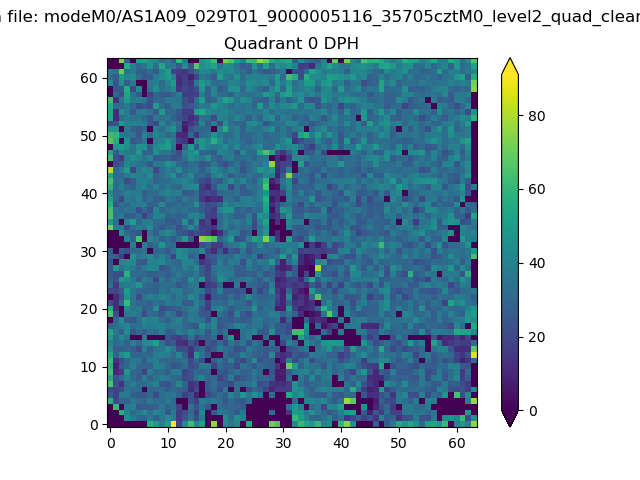 |
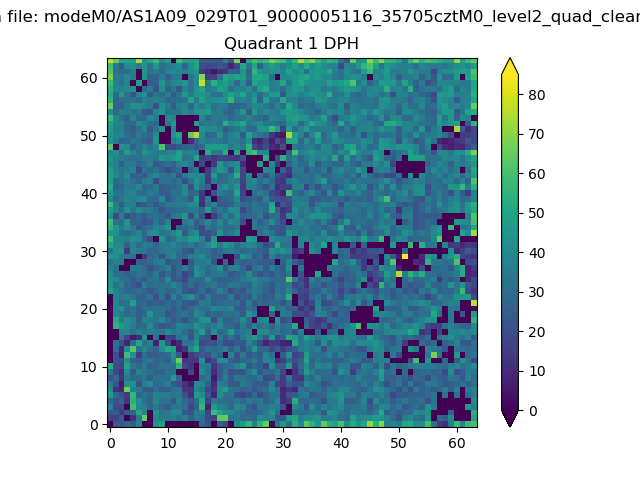 |
Quadrant B |
|---|---|---|---|
| Quadrant D |  |
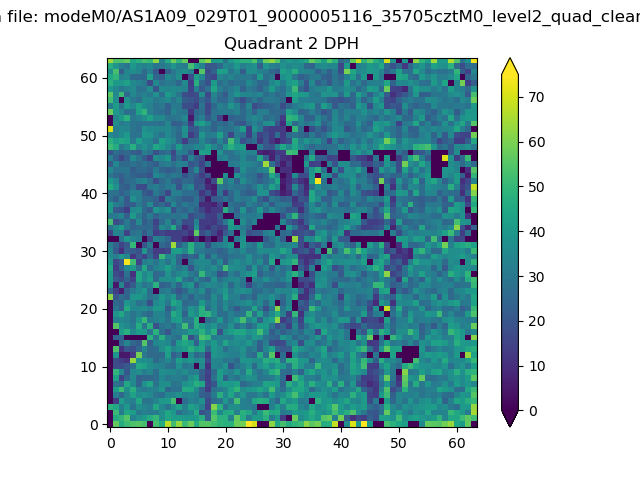 |
Quadrant C |
| Plot type | Count rate plots | Images |
|---|---|---|
| Comparison with Poisson distribution Blue bars denote a histogram of data divided into 1 sec bins. Red curve is a Poisson curve with rate = median count rate of data. |
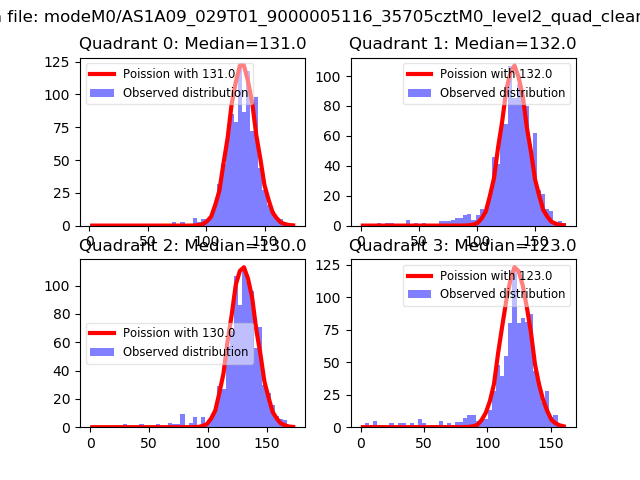 |
 |
| Quadrant-wise count rates Data is divided into 100 sec bins |
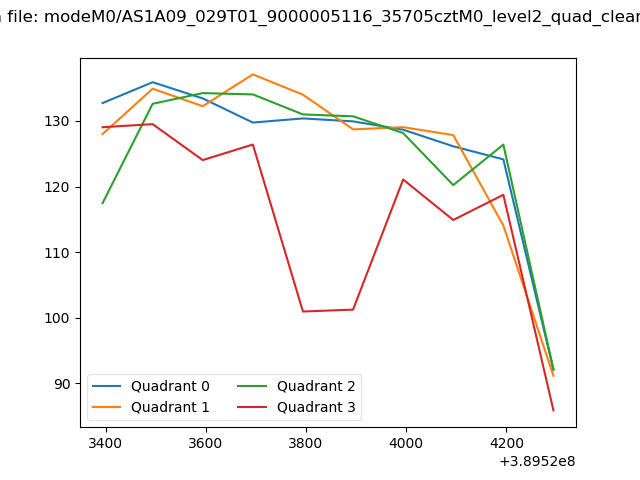 |
|
| Module-wise count rates for Quadrant A Data is divided into 100 sec bins |
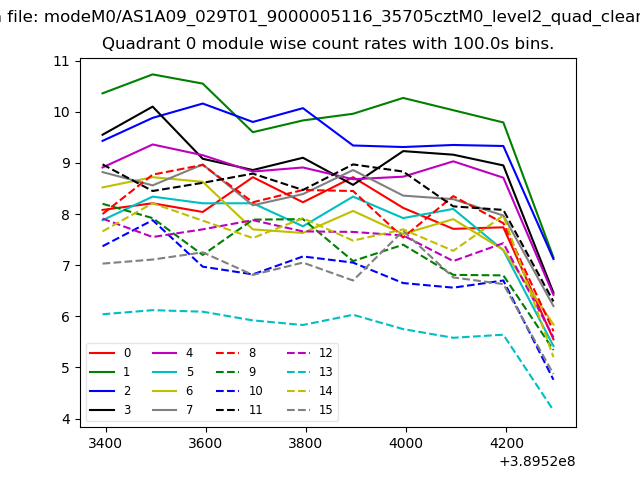 |
 |
| Module-wise count rates for Quadrant B Data is divided into 100 sec bins |
 |
 |
| Module-wise count rates for Quadrant C Data is divided into 100 sec bins |
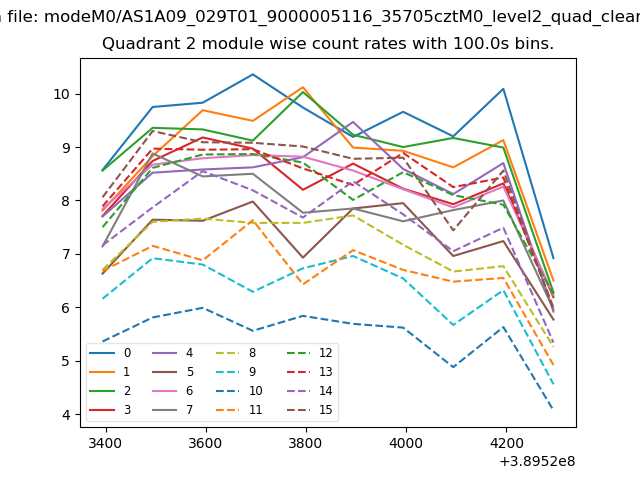 |
 |
| Module-wise count rates for Quadrant D Data is divided into 100 sec bins |
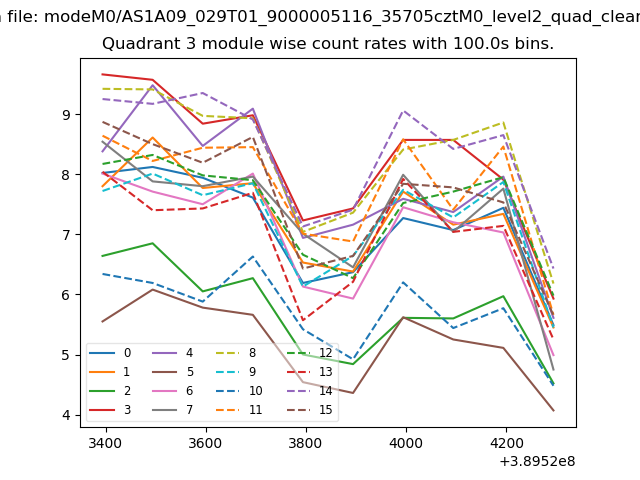 |
 |
| Parameter | Plot |
|---|---|
| CZT HV Monitor | 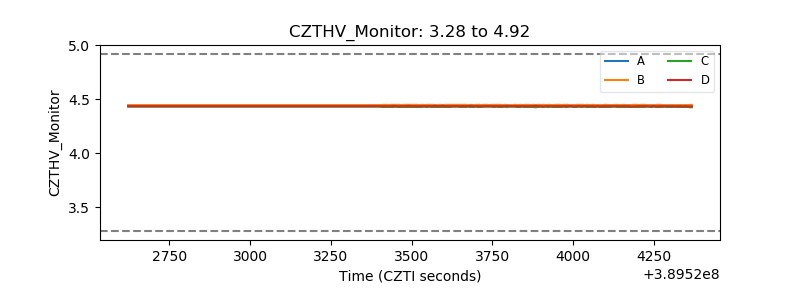 |
| D_VDD | 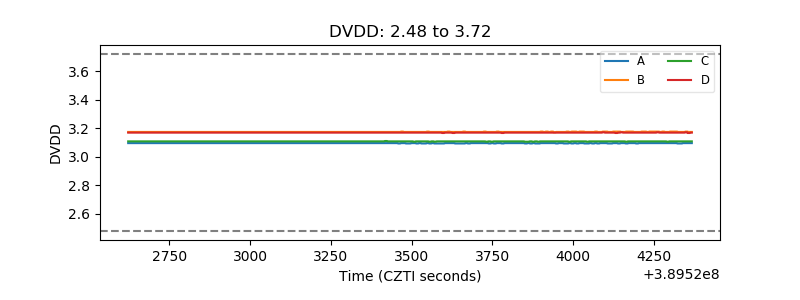 |
| Temperature 1 | 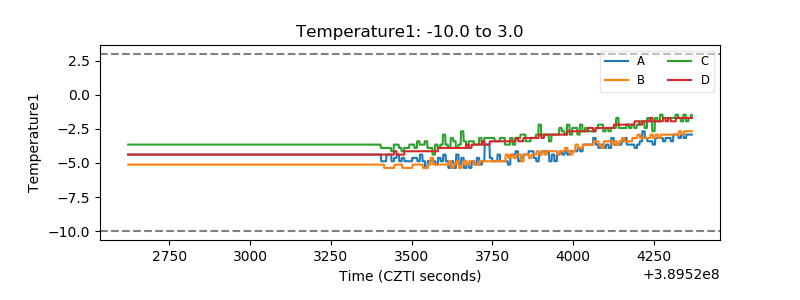 |
| Veto HV Monitor | 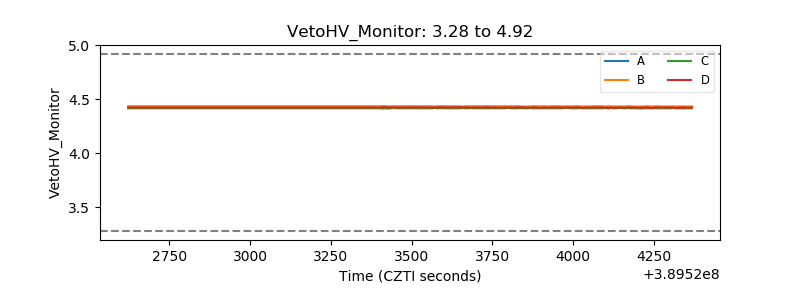 |
| Veto LLD | 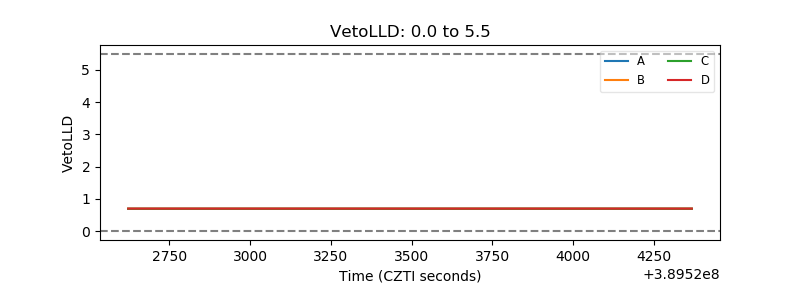 |
| Alpha Counter | 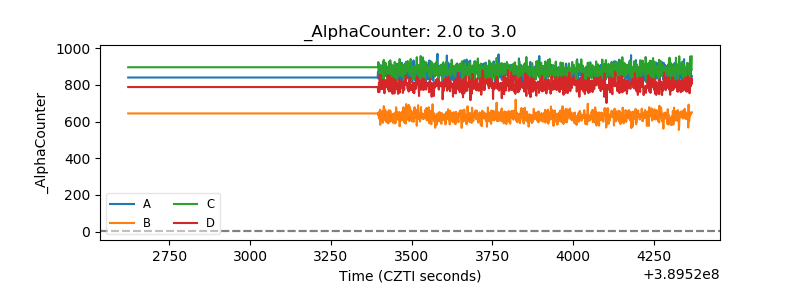 |
| _CPM_Rate | 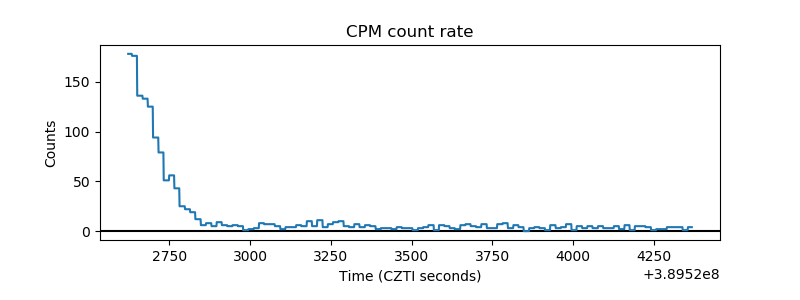 |
| CZT Counter | 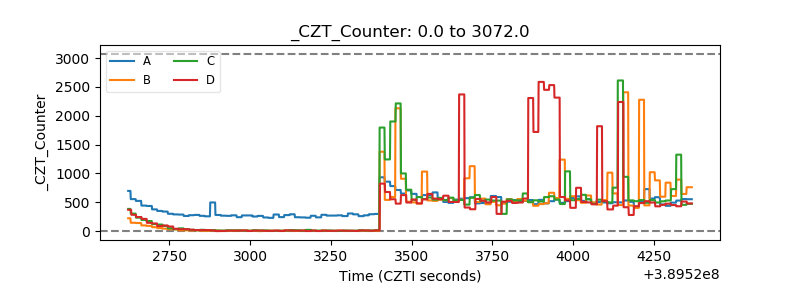 |
| +2.5 Volts monitor | 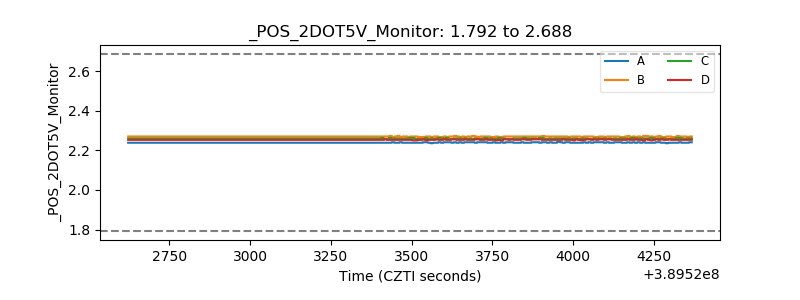 |
| +5 Volts monitor | 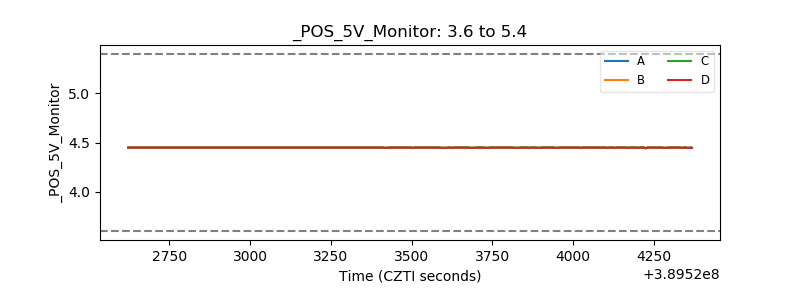 |
| _ROLL_ROT | 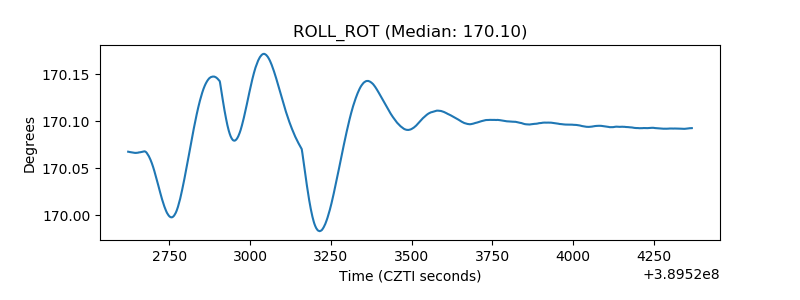 |
| _Roll_DEC | 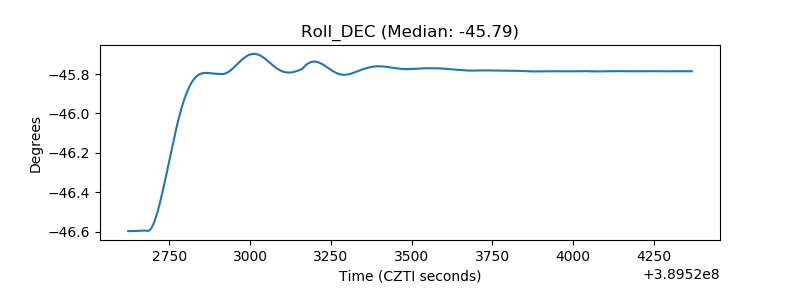 |
| _Roll_RA | 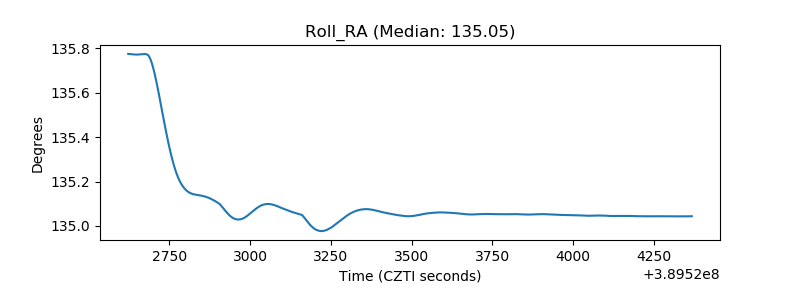 |
| Veto Counter | 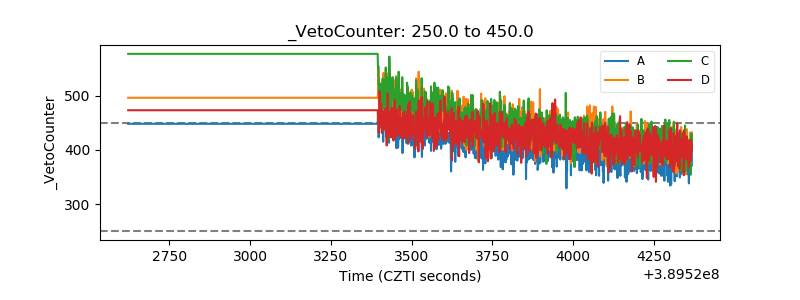 |