| Param | Original file | Final file |
|---|---|---|
| Filename | modeM0/AS1A09_142T03_9000005114_35705cztM0_level2.evt | modeM0/AS1A09_142T03_9000005114_35705cztM0_level2_quad_clean.evt |
| Size (bytes) | 305,398,080 | 48,677,760 |
| Size | 291.3 MB | 46.4 MB |
| Events in quadrant A | 2,046,650 | 292,564 |
| Events in quadrant B | 2,245,641 | 299,003 |
| Events in quadrant C | 2,267,817 | 295,481 |
| Events in quadrant D | 2,389,867 | 278,168 |
| Mode SS | |||
|---|---|---|---|
| Quadrant | BADHDUFLAG | Total packets | Discarded packets |
| A | 0 | 88 | 0 |
| B | 0 | 88 | 0 |
| C | 0 | 88 | 0 |
| D | 0 | 88 | 0 |
| Mode M0 | |||
|---|---|---|---|
| Quadrant | BADHDUFLAG | Total packets | Discarded packets |
| A | 0 | 8909 | 1 |
| B | 0 | 9505 | 1 |
| C | 0 | 9300 | 1 |
| D | 0 | 10096 | 1 |
| Mode M9 | |||
|---|---|---|---|
| Quadrant | BADHDUFLAG | Total packets | Discarded packets |
| A | 0 | 15 | 0 |
| B | 0 | 15 | 0 |
| C | 0 | 15 | 0 |
| D | 0 | 15 | 0 |
| Quadrant | Total seconds | Saturated seconds | Saturation percentage |
|---|---|---|---|
| A | 4388 | 3 | 0.068368% |
| B | 4388 | 68 | 1.549681% |
| C | 4388 | 47 | 1.071103% |
| D | 4388 | 107 | 2.438469% |
Noise dominated data is calculated using 1-second bins in cleaned event files. If a bin has >2000 counts, and if more than 50% of those come from <1% of pixels, then it is considered to be noise-dominated and hence unusable.
| Quadrant | # 1 sec bins | Bins with >0 counts | Bins with >2000 counts | High rate bins dominated by noise | Noise dominated (total time) | Noise dominated (detector-on time) | Marked lightcurve |
|---|---|---|---|---|---|---|---|
| A | 5821 | 4389 | 0 | 0 | 0.00% | 0.00% | 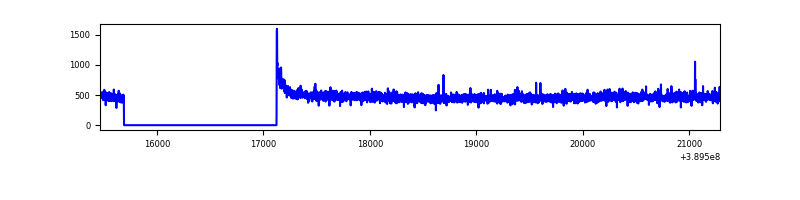 |
| B | 5821 | 4389 | 51 | 51 | 0.88% | 1.16% | 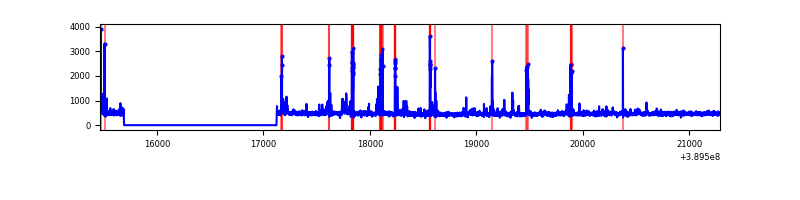 |
| C | 5821 | 4389 | 43 | 43 | 0.74% | 0.98% | 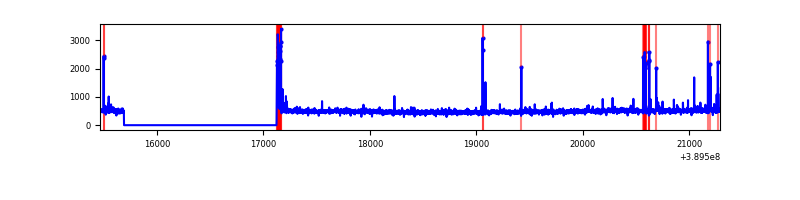 |
| D | 5821 | 4389 | 87 | 87 | 1.49% | 1.98% | 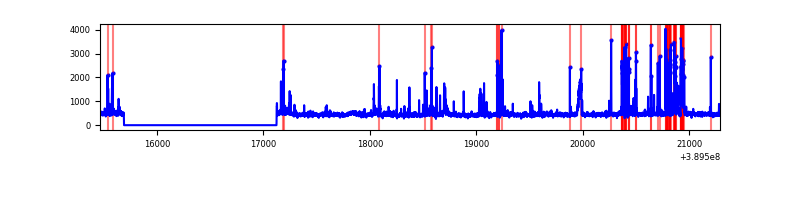 |
Top three noisy pixels from each quadrant. If the there are fewer than three noisy pixels in the level2.evt file, extra rows are filled as -1
| Pixel properties | Quadrant properties | ||||||
|---|---|---|---|---|---|---|---|
| Quadrant | DetID | PixID | Counts | Sigma | Mean | Median | Sigma |
| A | 10 | 83 | 92180 | 892.79 | 503 | 491 | 102.7 |
| A | 10 | 255 | 7448 | 67.74 | 503 | 491 | 102.7 |
| A | 13 | 6 | 6421 | 57.74 | 503 | 491 | 102.7 |
| B | 5 | 255 | 162116 | 1667.45 | 496 | 484 | 96.9 |
| B | 5 | 172 | 111936 | 1149.78 | 496 | 484 | 96.9 |
| B | 12 | 111 | 12343 | 122.34 | 496 | 484 | 96.9 |
| C | 15 | 214 | 182717 | 1569.05 | 492 | 496 | 116.1 |
| C | 0 | 10 | 148793 | 1276.94 | 492 | 496 | 116.1 |
| C | 9 | 187 | 7861 | 63.42 | 492 | 496 | 116.1 |
| D | 12 | 6 | 296726 | 2461.55 | 488 | 475 | 120.4 |
| D | 13 | 249 | 106885 | 884.16 | 488 | 475 | 120.4 |
| D | 7 | 223 | 50482 | 415.51 | 488 | 475 | 120.4 |
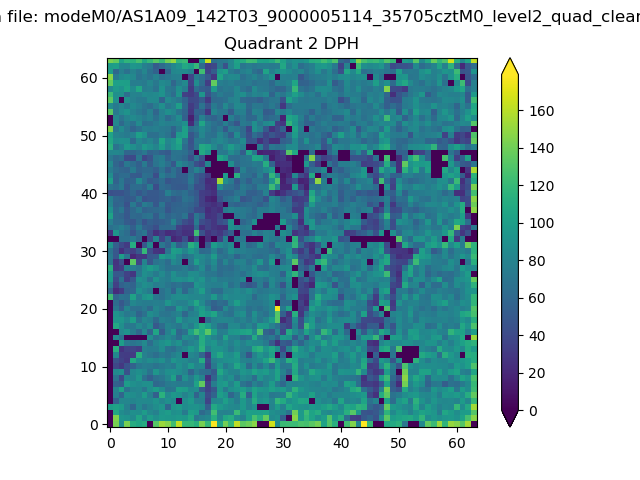
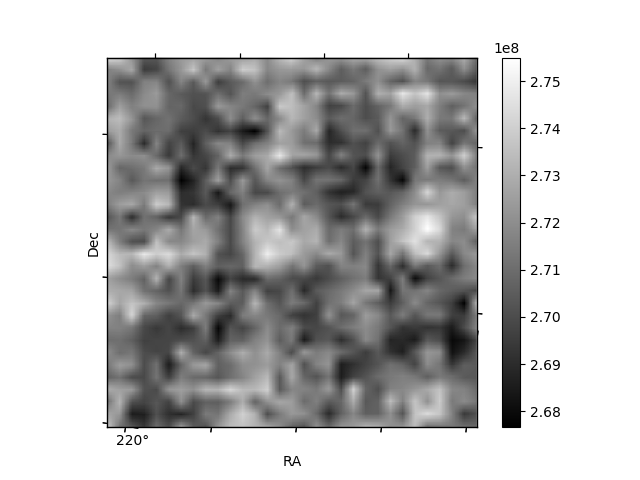
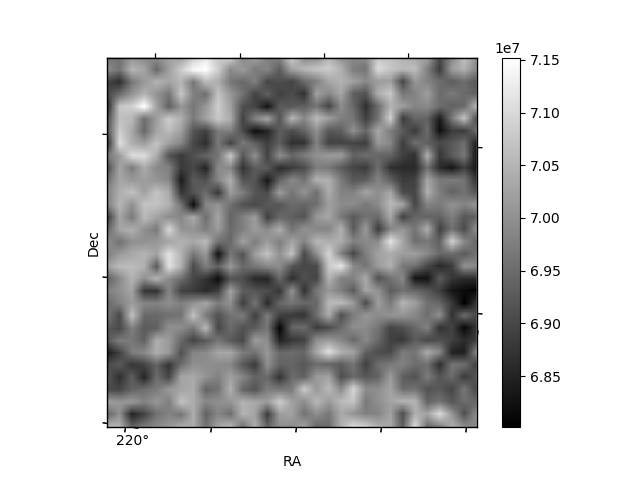
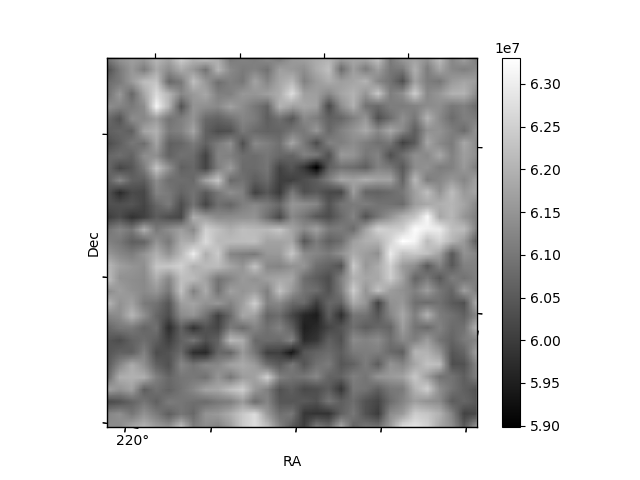
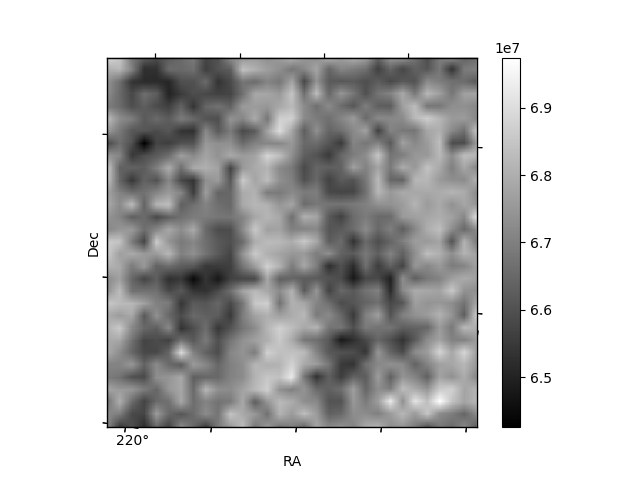
Histogram calculated using DETX and DETY for each event in the final _common_clean file
| Quadrant A | 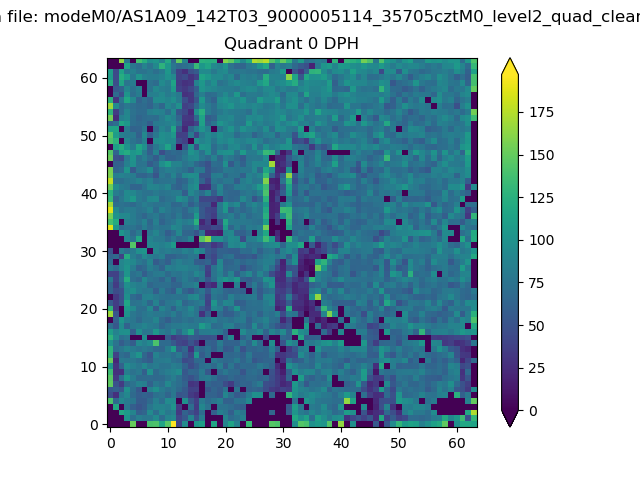 |
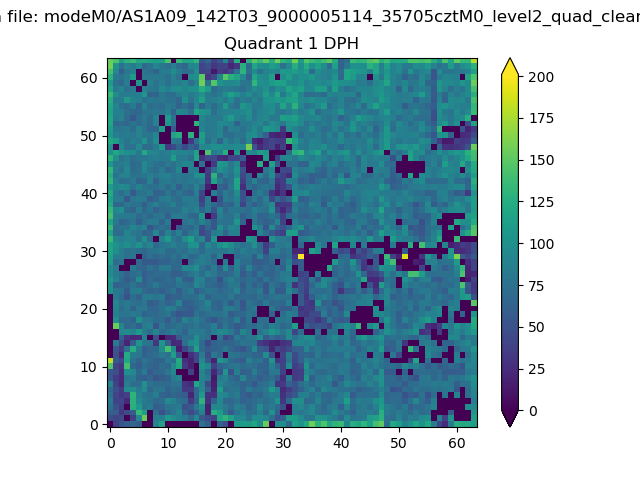 |
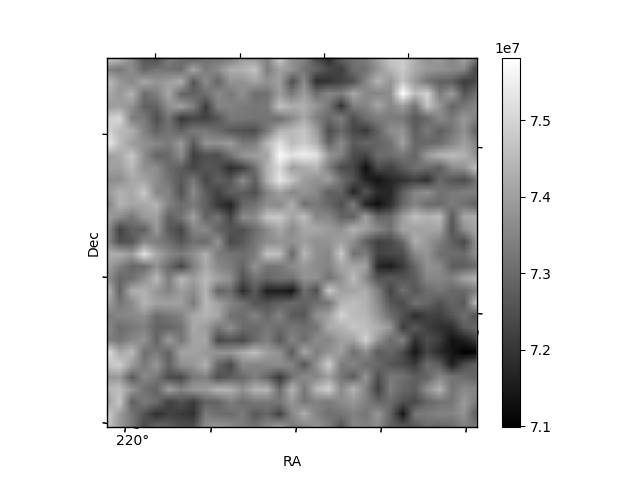
Quadrant B |
|---|---|---|---|
| Quadrant D | 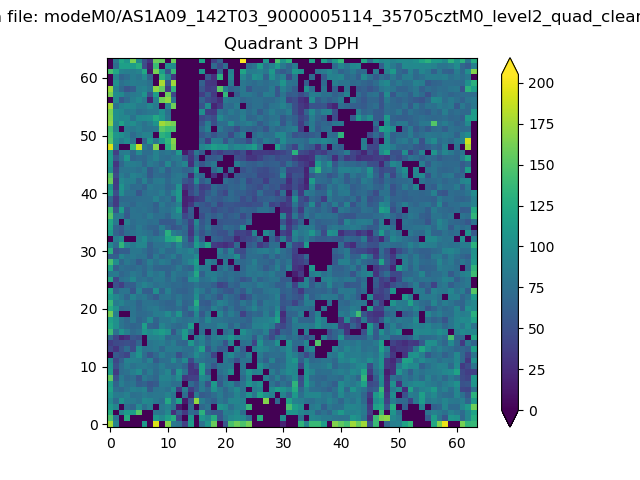 |
 |
Quadrant C |
| Plot type | Count rate plots | Images |
|---|---|---|
| Comparison with Poisson distribution Blue bars denote a histogram of data divided into 1 sec bins. Red curve is a Poisson curve with rate = median count rate of data. |
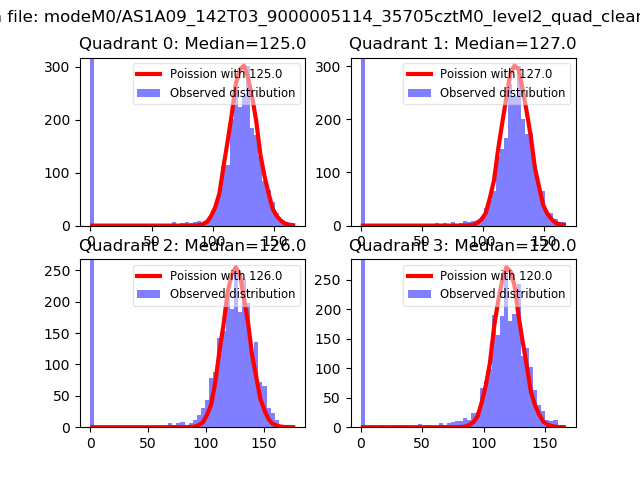 |
 |
| Quadrant-wise count rates Data is divided into 100 sec bins |
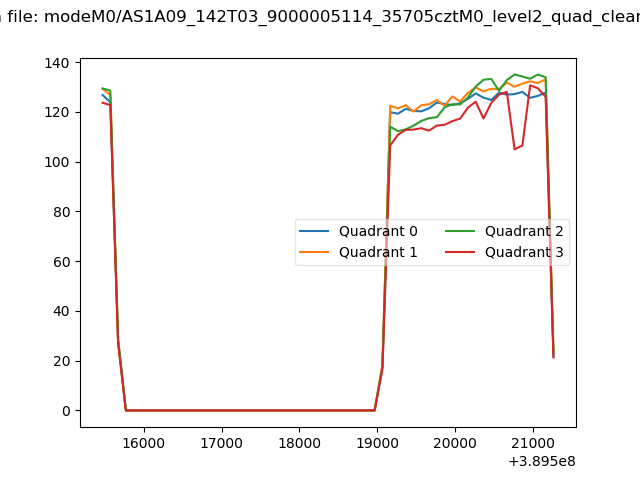 |
|
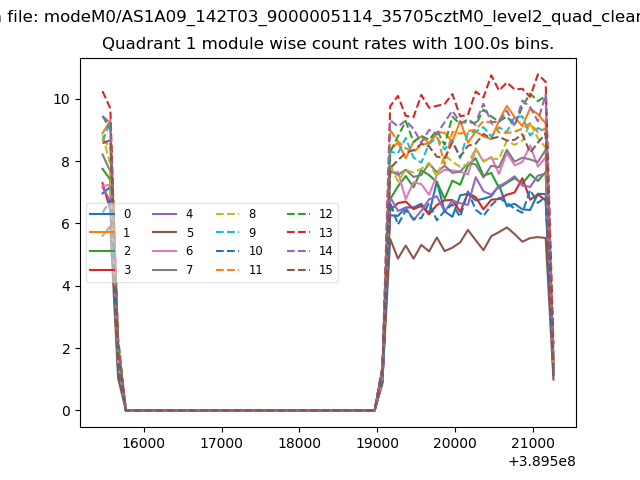
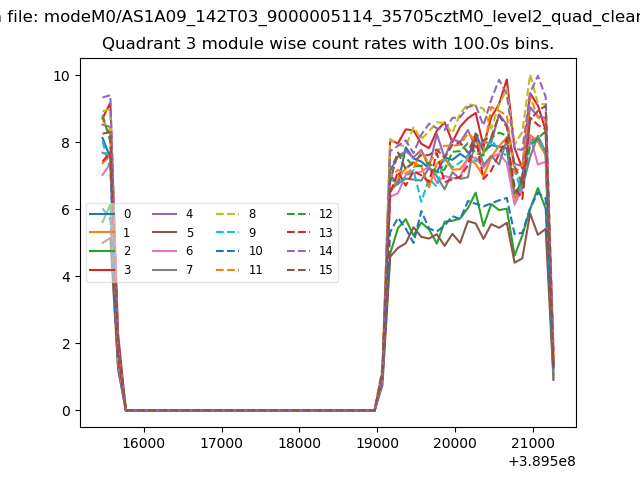
| Module-wise count rates for Quadrant A Data is divided into 100 sec bins |
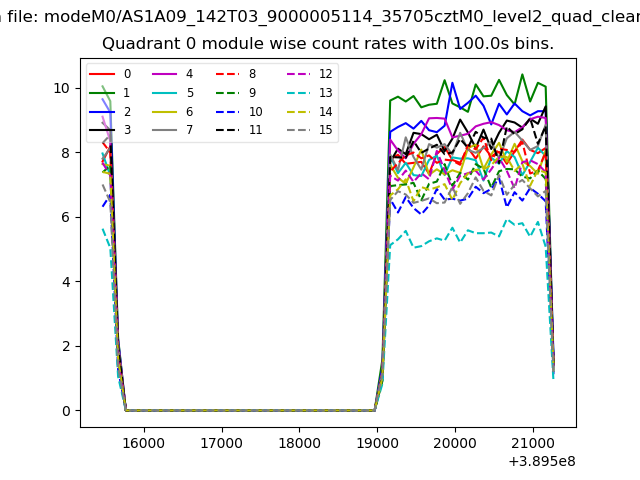 |
 |
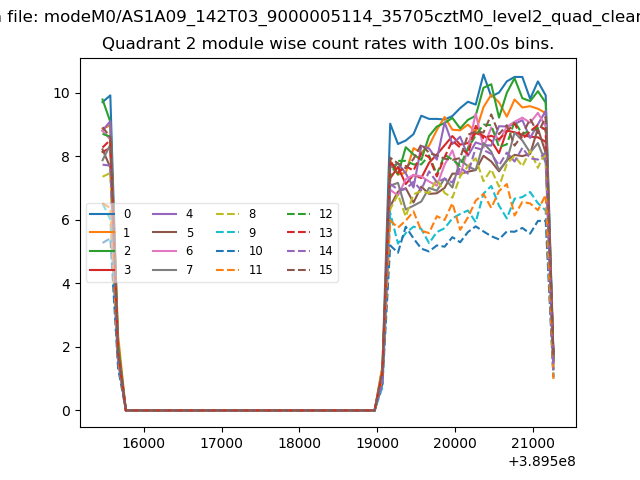
| Module-wise count rates for Quadrant B Data is divided into 100 sec bins |
 |
 |
| Module-wise count rates for Quadrant C Data is divided into 100 sec bins |
 |
 |
| Module-wise count rates for Quadrant D Data is divided into 100 sec bins |
 |
 |
| Parameter | Plot |
|---|---|
| CZT HV Monitor | 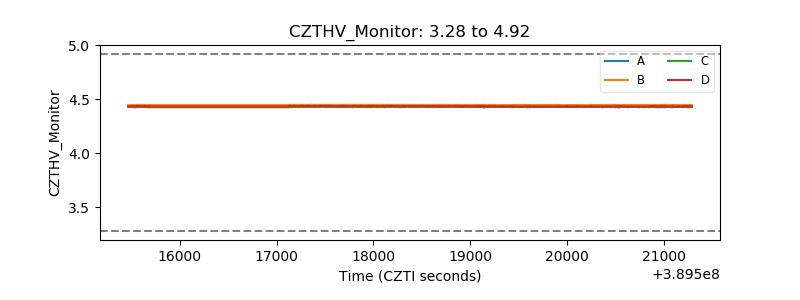 |
| D_VDD | 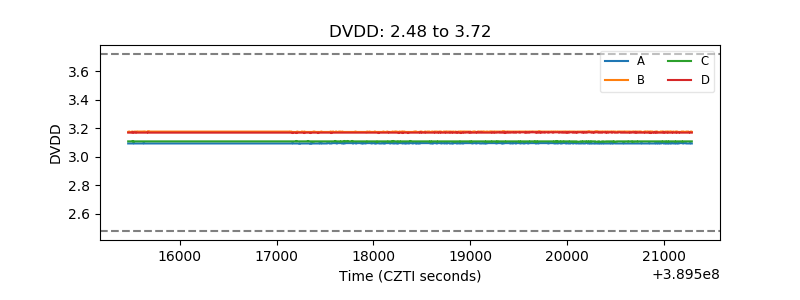 |
| Temperature 1 | 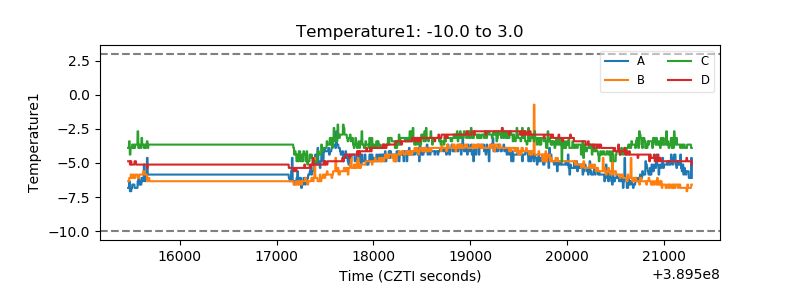 |
| Veto HV Monitor |  |
| Veto LLD | 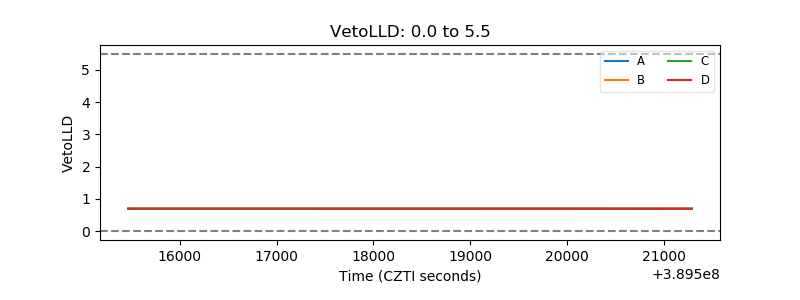 |
| Alpha Counter | 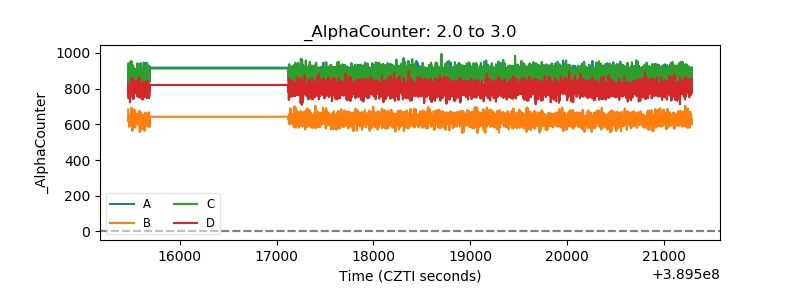 |
| _CPM_Rate | 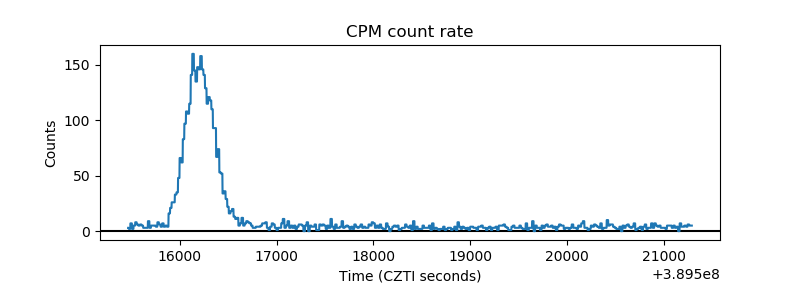 |
| CZT Counter | 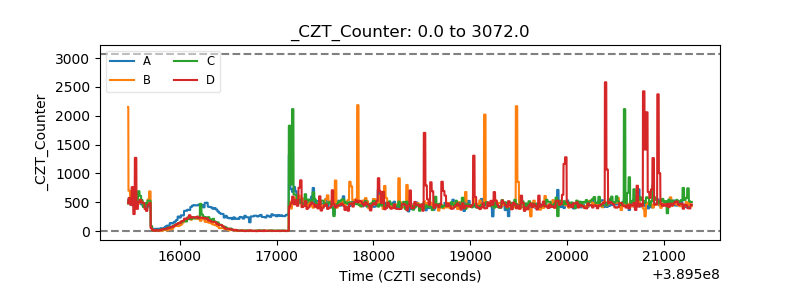 |
| +2.5 Volts monitor | 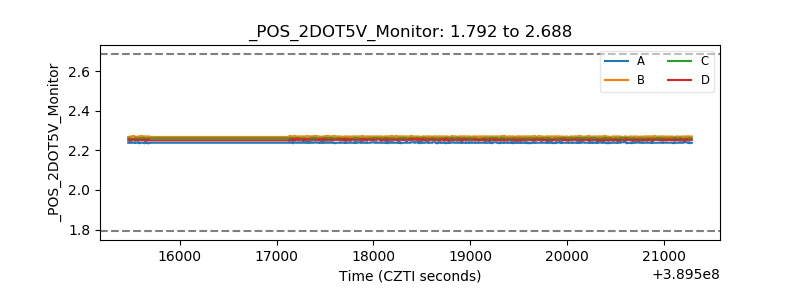 |
| +5 Volts monitor | 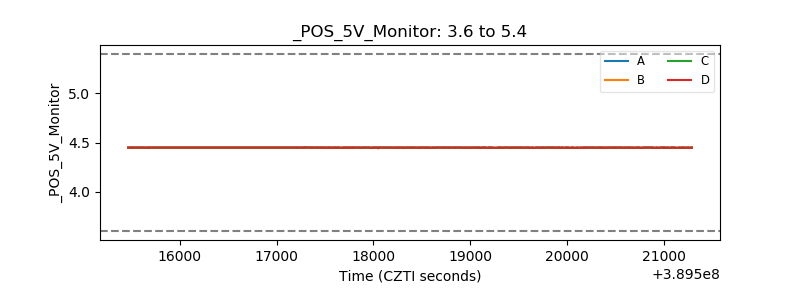 |
| _ROLL_ROT | 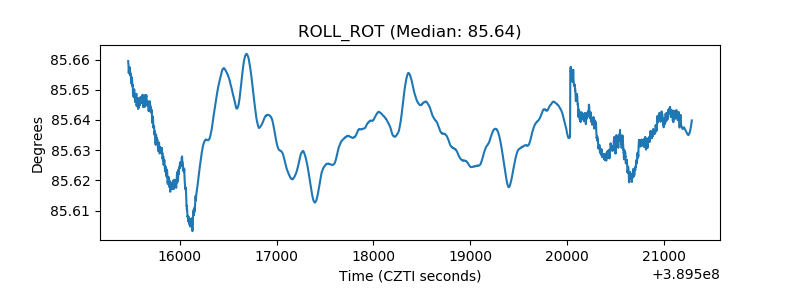 |
| _Roll_DEC | 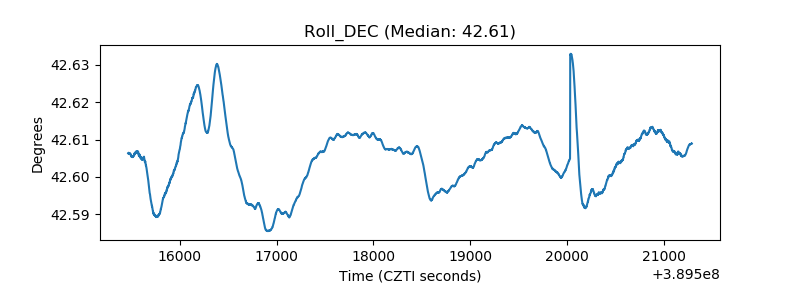 |
| _Roll_RA | 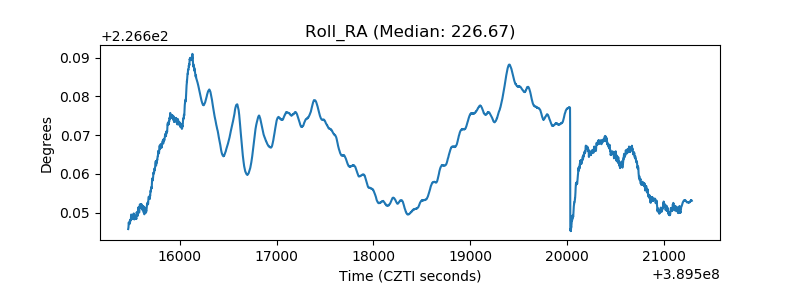 |
| Veto Counter | 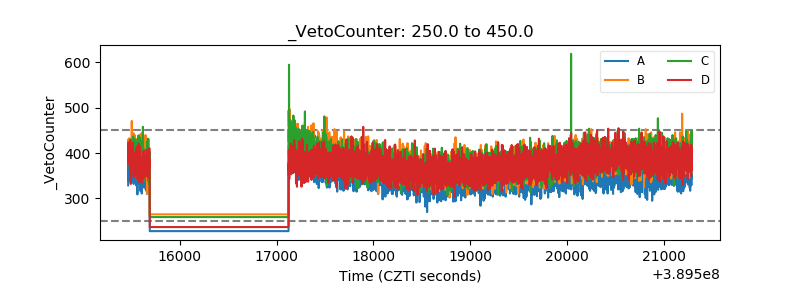 |