| Param | Original file | Final file |
|---|---|---|
| Filename | modeM0/AS1A09_142T03_9000005114_35704cztM0_level2.evt | modeM0/AS1A09_142T03_9000005114_35704cztM0_level2_quad_clean.evt |
| Size (bytes) | 770,160,960 | 115,934,400 |
| Size | 734.5 MB | 110.6 MB |
| Events in quadrant A | 5,068,522 | 686,367 |
| Events in quadrant B | 5,942,220 | 698,160 |
| Events in quadrant C | 5,708,345 | 702,845 |
| Events in quadrant D | 5,871,823 | 673,469 |
| Mode SS | |||
|---|---|---|---|
| Quadrant | BADHDUFLAG | Total packets | Discarded packets |
| A | 0 | 220 | 0 |
| B | 0 | 220 | 0 |
| C | 0 | 220 | 0 |
| D | 0 | 220 | 0 |
| Mode M0 | |||
|---|---|---|---|
| Quadrant | BADHDUFLAG | Total packets | Discarded packets |
| A | 0 | 21979 | 4 |
| B | 0 | 24638 | 3 |
| C | 0 | 23413 | 3 |
| D | 0 | 24714 | 3 |
| Mode M9 | |||
|---|---|---|---|
| Quadrant | BADHDUFLAG | Total packets | Discarded packets |
| A | 0 | 29 | 0 |
| B | 0 | 29 | 0 |
| C | 0 | 29 | 0 |
| D | 0 | 29 | 0 |
| Quadrant | Total seconds | Saturated seconds | Saturation percentage |
|---|---|---|---|
| A | 10835 | 6 | 0.055376% |
| B | 10835 | 213 | 1.965851% |
| C | 10835 | 114 | 1.052146% |
| D | 10835 | 112 | 1.033687% |
Noise dominated data is calculated using 1-second bins in cleaned event files. If a bin has >2000 counts, and if more than 50% of those come from <1% of pixels, then it is considered to be noise-dominated and hence unusable.
| Quadrant | # 1 sec bins | Bins with >0 counts | Bins with >2000 counts | High rate bins dominated by noise | Noise dominated (total time) | Noise dominated (detector-on time) | Marked lightcurve |
|---|---|---|---|---|---|---|---|
| A | 13610 | 10837 | 0 | 0 | 0.00% | 0.00% | 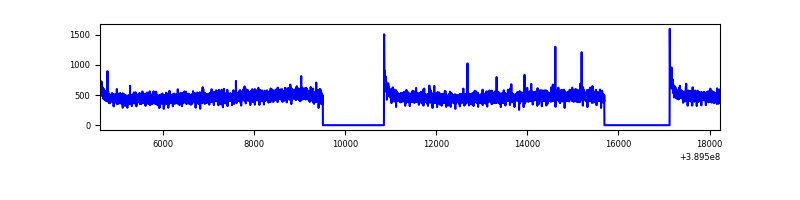 |
| B | 13610 | 10836 | 140 | 140 | 1.03% | 1.29% | 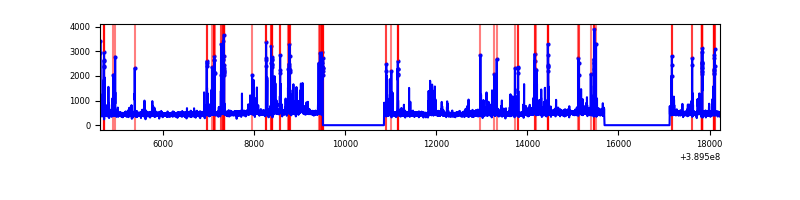 |
| C | 13610 | 10837 | 100 | 100 | 0.73% | 0.92% | 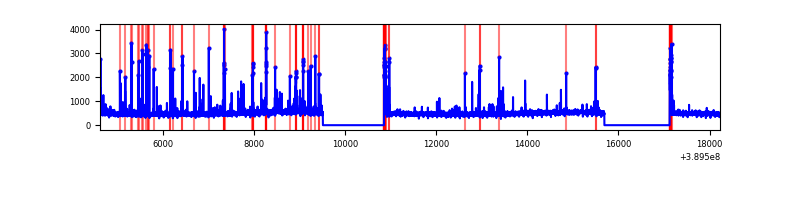 |
| D | 13610 | 10837 | 111 | 111 | 0.82% | 1.02% | 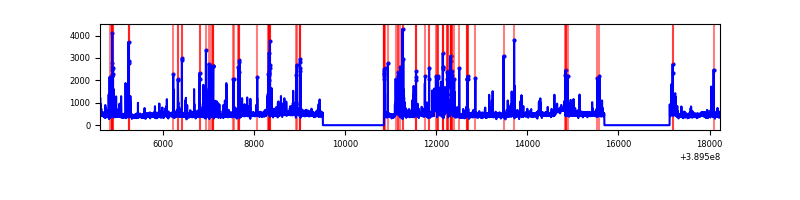 |
Top three noisy pixels from each quadrant. If the there are fewer than three noisy pixels in the level2.evt file, extra rows are filled as -1
| Pixel properties | Quadrant properties | ||||||
|---|---|---|---|---|---|---|---|
| Quadrant | DetID | PixID | Counts | Sigma | Mean | Median | Sigma |
| A | 10 | 83 | 231351 | 911.36 | 1248 | 1220 | 252.5 |
| A | 10 | 255 | 13986 | 50.56 | 1248 | 1220 | 252.5 |
| A | 3 | 137 | 13642 | 49.19 | 1248 | 1220 | 252.5 |
| B | 5 | 172 | 734499 | 3054.32 | 1235 | 1201 | 240.1 |
| B | 5 | 255 | 251511 | 1042.59 | 1235 | 1201 | 240.1 |
| B | 10 | 244 | 35337 | 142.18 | 1235 | 1201 | 240.1 |
| C | 15 | 214 | 453068 | 1590.19 | 1223 | 1231 | 284.1 |
| C | 0 | 10 | 404469 | 1419.15 | 1223 | 1231 | 284.1 |
| C | 14 | 128 | 68880 | 238.08 | 1223 | 1231 | 284.1 |
| D | 13 | 249 | 695902 | 2357.82 | 1221 | 1187 | 294.6 |
| D | 12 | 6 | 104600 | 350.98 | 1221 | 1187 | 294.6 |
| D | 2 | 153 | 89062 | 298.24 | 1221 | 1187 | 294.6 |
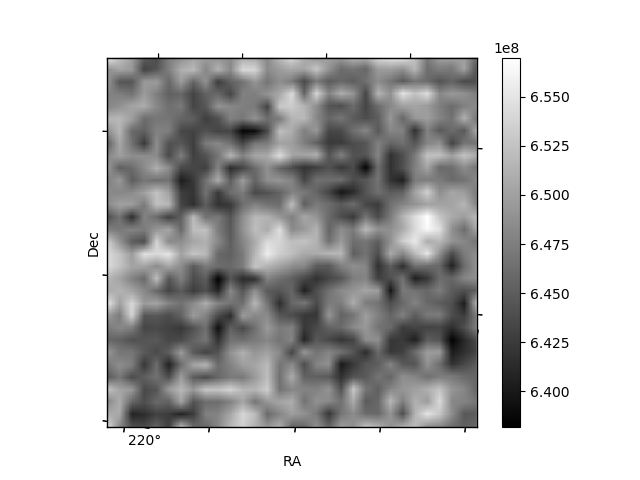
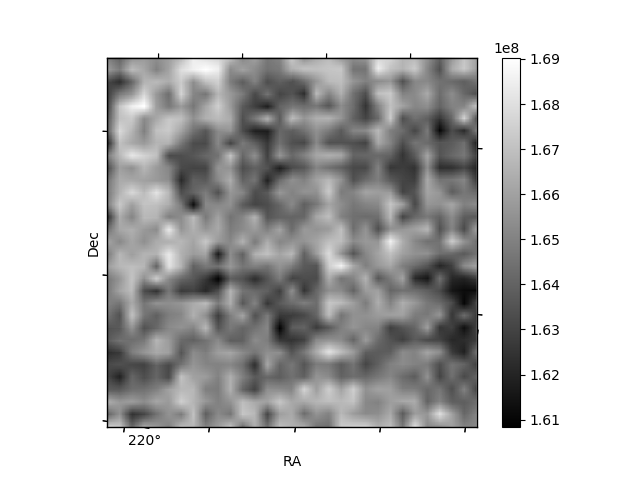
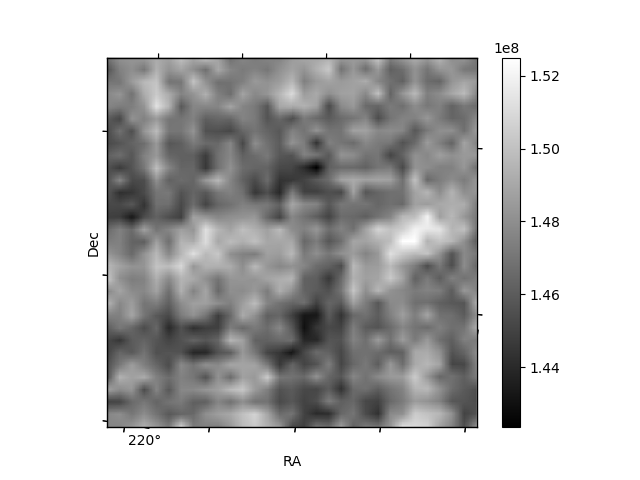
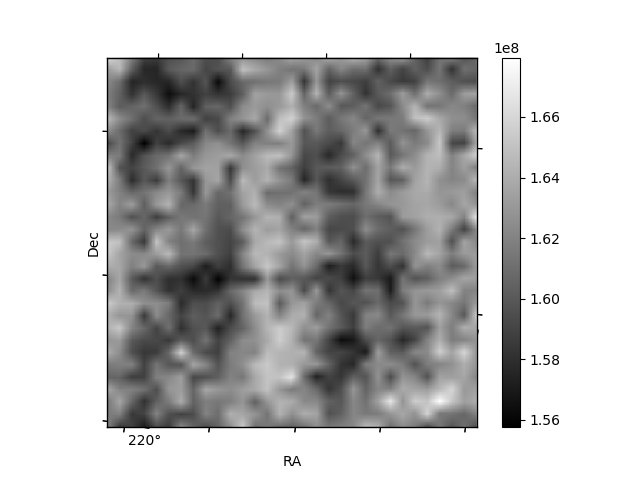
Histogram calculated using DETX and DETY for each event in the final _common_clean file
| Quadrant A | 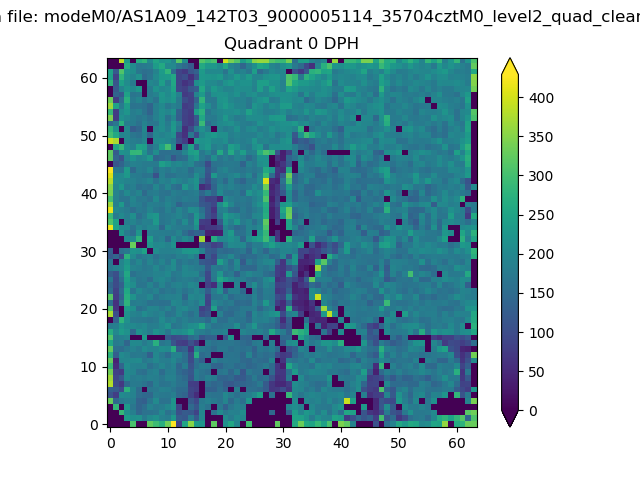 |
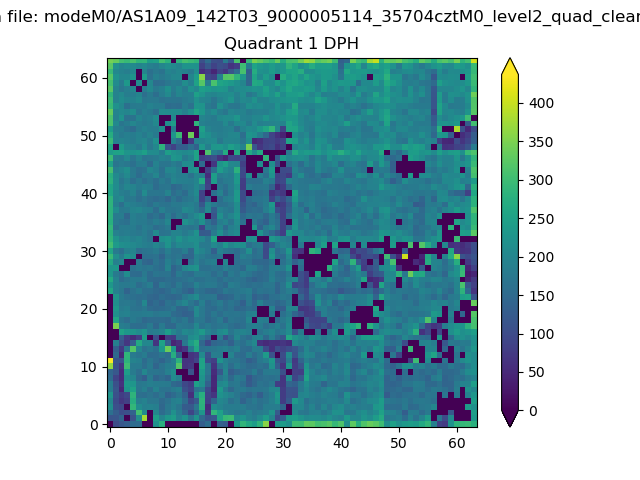 |
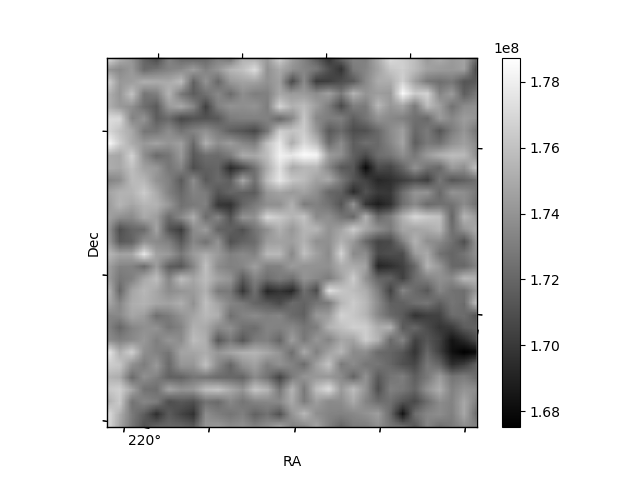
Quadrant B |
|---|---|---|---|
| Quadrant D | 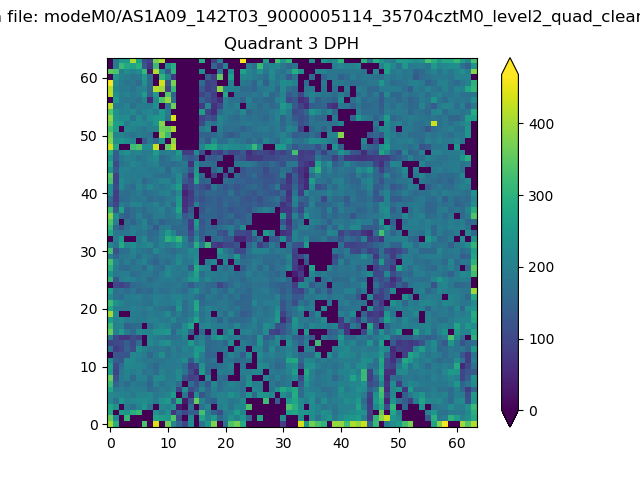 |
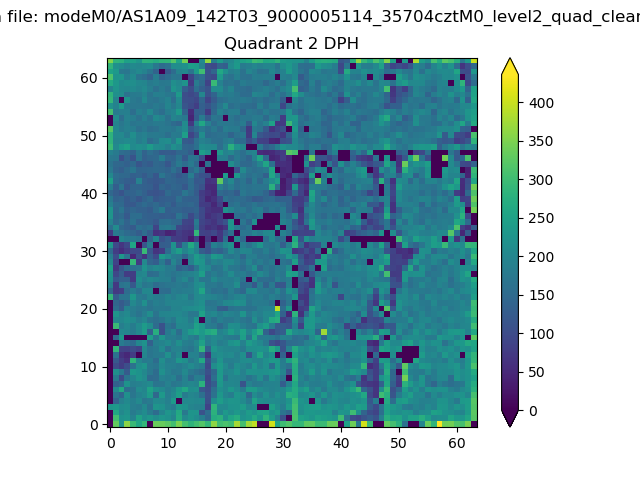 |
Quadrant C |
| Plot type | Count rate plots | Images |
|---|---|---|
| Comparison with Poisson distribution Blue bars denote a histogram of data divided into 1 sec bins. Red curve is a Poisson curve with rate = median count rate of data. |
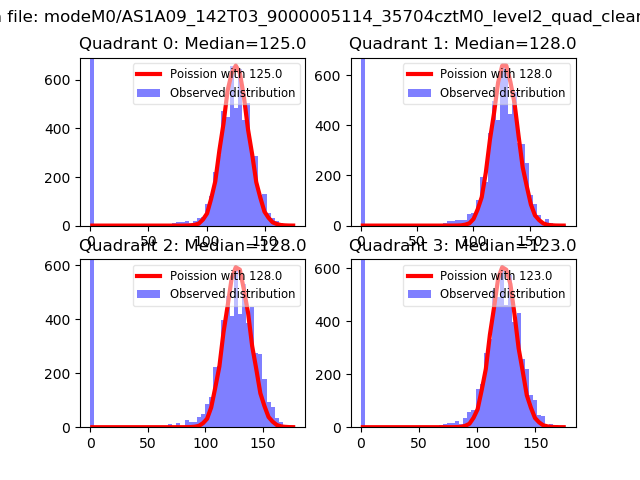 |
 |
| Quadrant-wise count rates Data is divided into 100 sec bins |
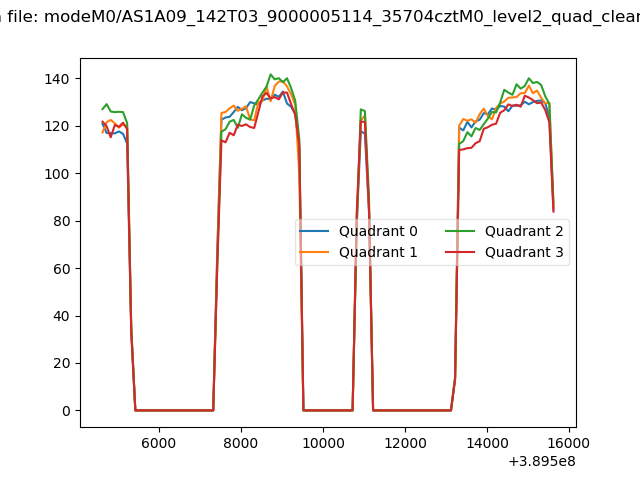 |
|
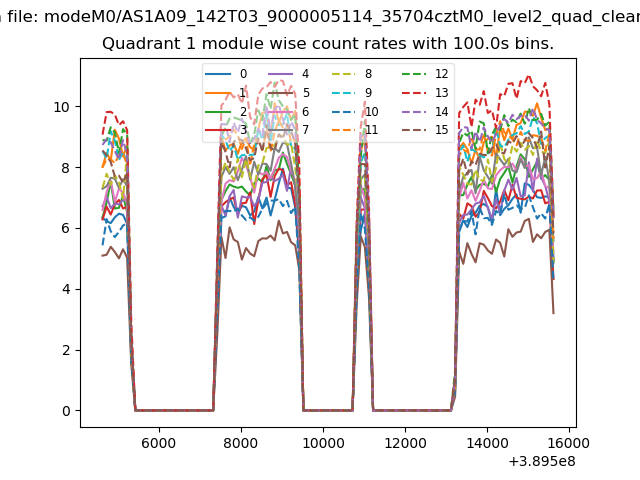
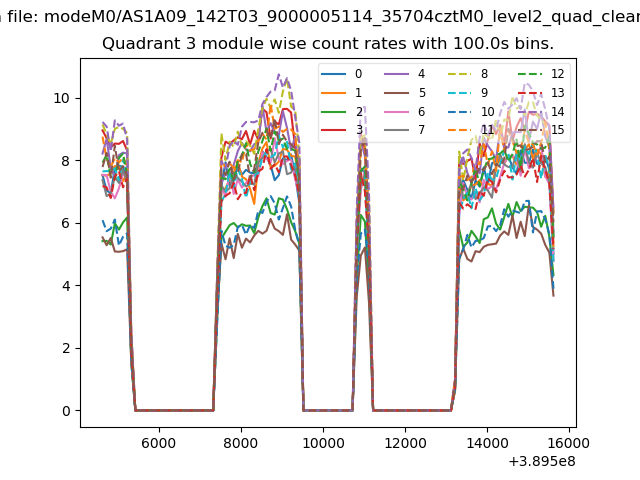
| Module-wise count rates for Quadrant A Data is divided into 100 sec bins |
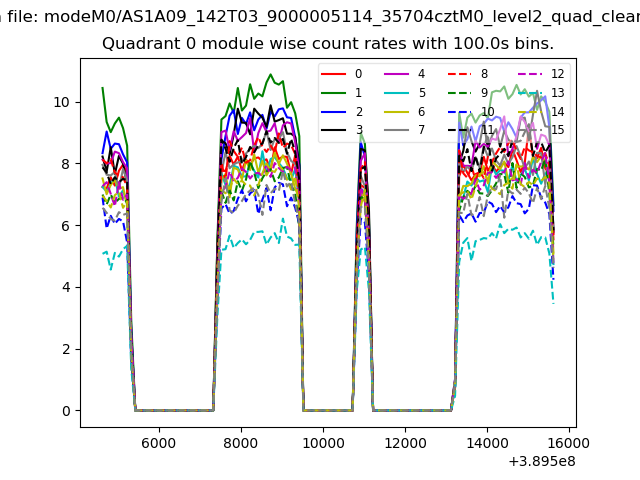 |
 |
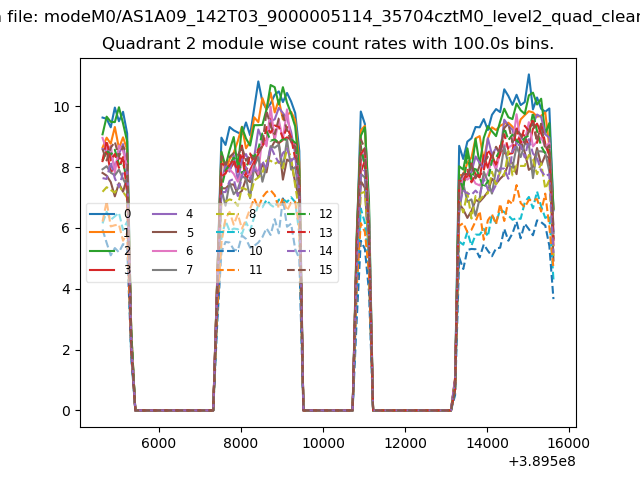
| Module-wise count rates for Quadrant B Data is divided into 100 sec bins |
 |
 |
| Module-wise count rates for Quadrant C Data is divided into 100 sec bins |
 |
 |
| Module-wise count rates for Quadrant D Data is divided into 100 sec bins |
 |
 |
| Parameter | Plot |
|---|---|
| CZT HV Monitor | 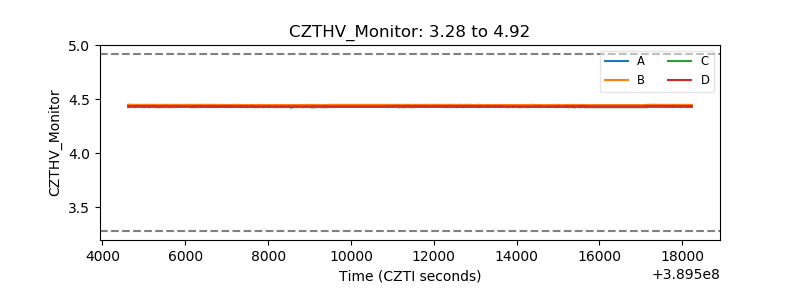 |
| D_VDD | 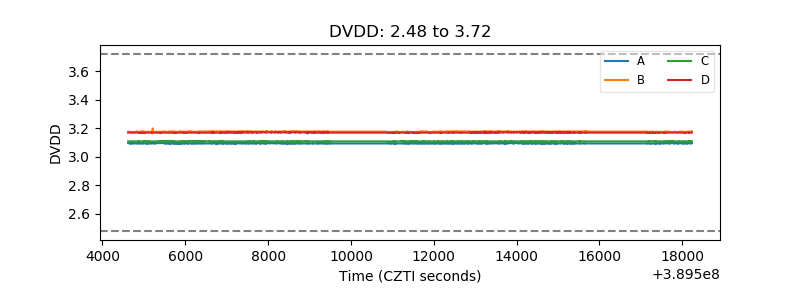 |
| Temperature 1 | 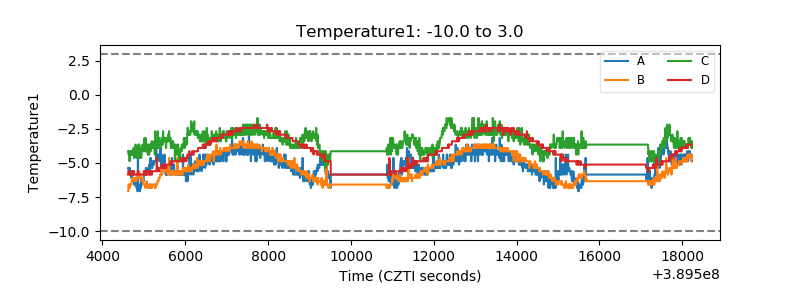 |
| Veto HV Monitor |  |
| Veto LLD | 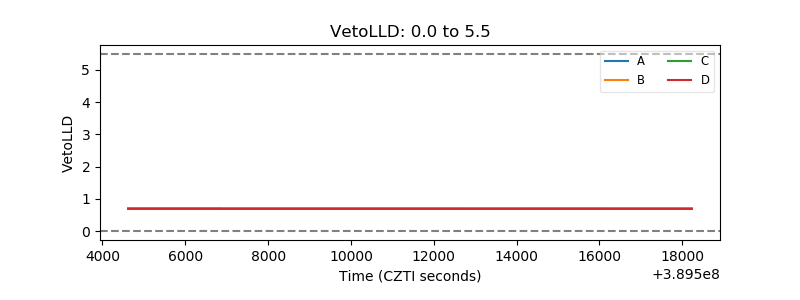 |
| Alpha Counter | 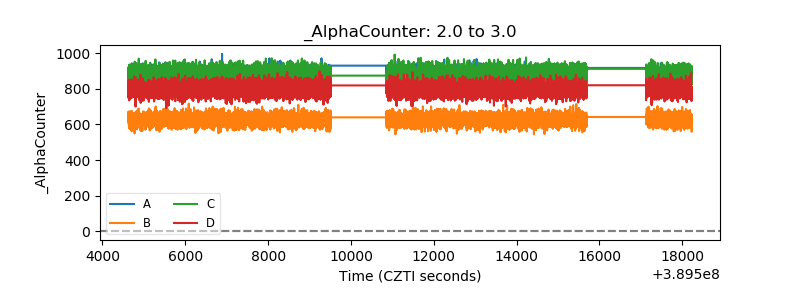 |
| _CPM_Rate | 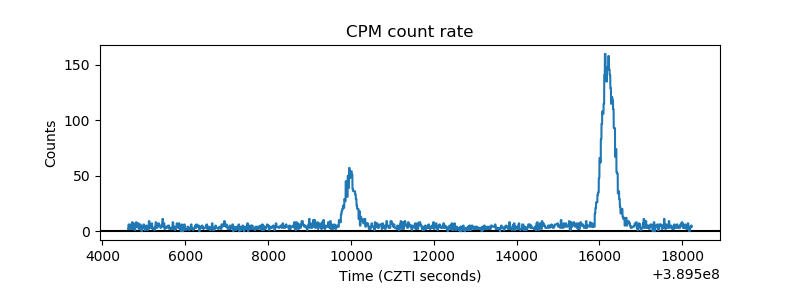 |
| CZT Counter | 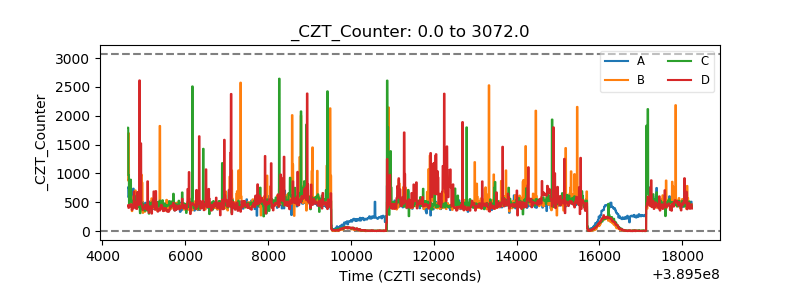 |
| +2.5 Volts monitor | 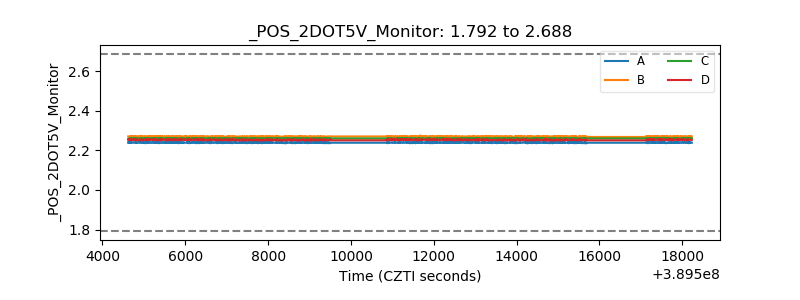 |
| +5 Volts monitor | 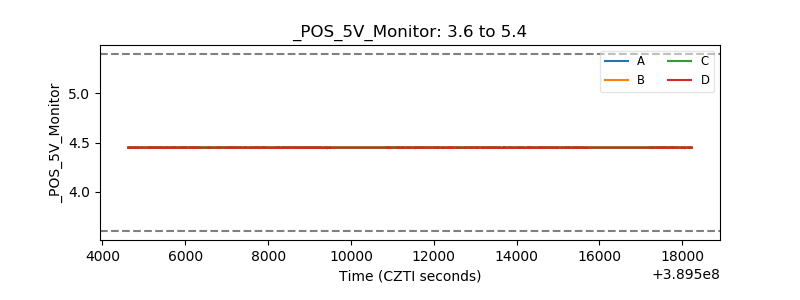 |
| _ROLL_ROT | 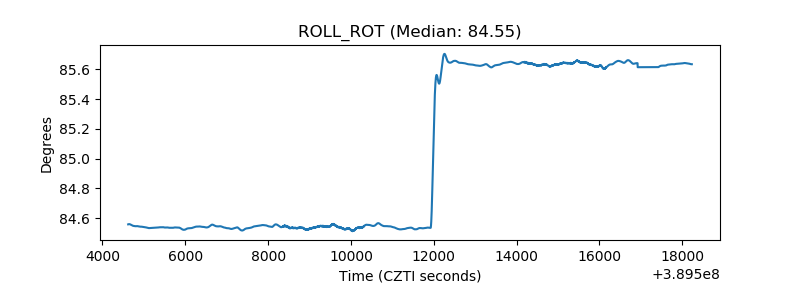 |
| _Roll_DEC | 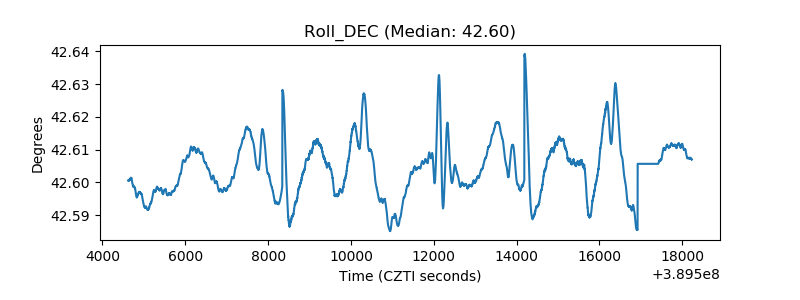 |
| _Roll_RA | 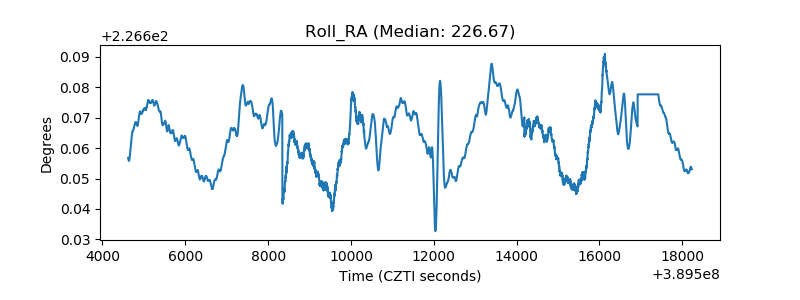 |
| Veto Counter | 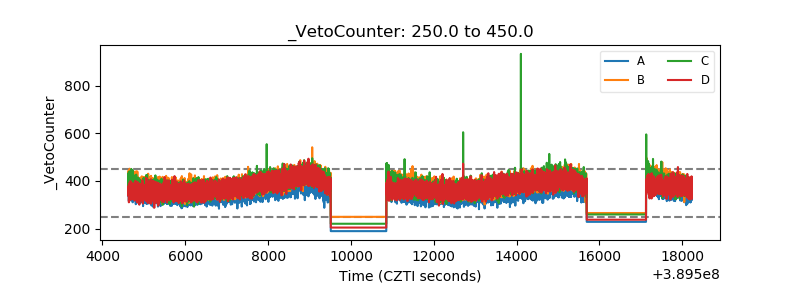 |