| Param | Original file | Final file |
|---|---|---|
| Filename | modeM0/AS1A09_142T03_9000005114_35699cztM0_level2.evt | modeM0/AS1A09_142T03_9000005114_35699cztM0_level2_quad_clean.evt |
| Size (bytes) | 369,063,360 | 64,327,680 |
| Size | 352.0 MB | 61.3 MB |
| Events in quadrant A | 2,346,712 | 395,623 |
| Events in quadrant B | 3,367,515 | 390,046 |
| Events in quadrant C | 2,676,662 | 409,973 |
| Events in quadrant D | 2,442,529 | 398,224 |
| Mode SS | |||
|---|---|---|---|
| Quadrant | BADHDUFLAG | Total packets | Discarded packets |
| A | 0 | 104 | 0 |
| B | 0 | 104 | 0 |
| C | 0 | 104 | 0 |
| D | 0 | 104 | 0 |
| Mode M0 | |||
|---|---|---|---|
| Quadrant | BADHDUFLAG | Total packets | Discarded packets |
| A | 0 | 10360 | 3 |
| B | 0 | 13280 | 2 |
| C | 0 | 11000 | 2 |
| D | 0 | 10758 | 2 |
| Mode M9 | |||
|---|---|---|---|
| Quadrant | BADHDUFLAG | Total packets | Discarded packets |
| A | 0 | 34 | 0 |
| B | 0 | 34 | 0 |
| C | 0 | 34 | 0 |
| D | 0 | 35 | 0 |
| Quadrant | Total seconds | Saturated seconds | Saturation percentage |
|---|---|---|---|
| A | 5042 | 8 | 0.158667% |
| B | 5042 | 277 | 5.493852% |
| C | 5042 | 74 | 1.467672% |
| D | 5042 | 22 | 0.436335% |
Noise dominated data is calculated using 1-second bins in cleaned event files. If a bin has >2000 counts, and if more than 50% of those come from <1% of pixels, then it is considered to be noise-dominated and hence unusable.
| Quadrant | # 1 sec bins | Bins with >0 counts | Bins with >2000 counts | High rate bins dominated by noise | Noise dominated (total time) | Noise dominated (detector-on time) | Marked lightcurve |
|---|---|---|---|---|---|---|---|
| A | 6955 | 5043 | 1 | 1 | 0.01% | 0.02% | 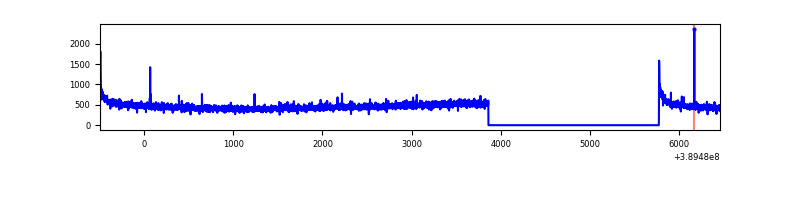 |
| B | 6955 | 5043 | 240 | 240 | 3.45% | 4.76% | 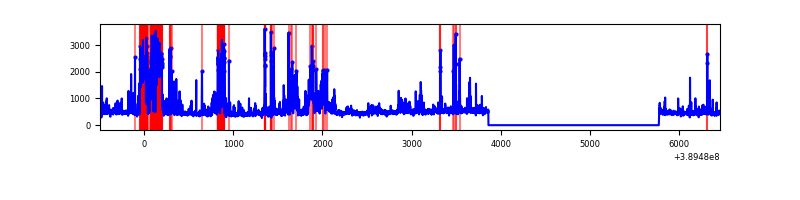 |
| C | 6955 | 5043 | 50 | 50 | 0.72% | 0.99% | 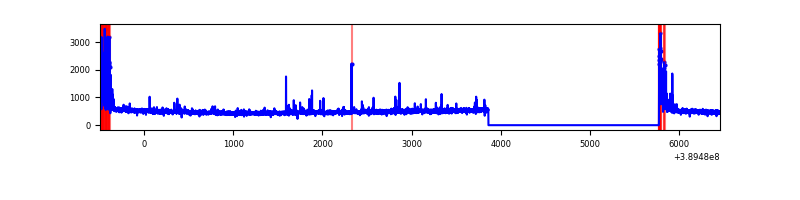 |
| D | 6955 | 5043 | 28 | 28 | 0.40% | 0.56% | 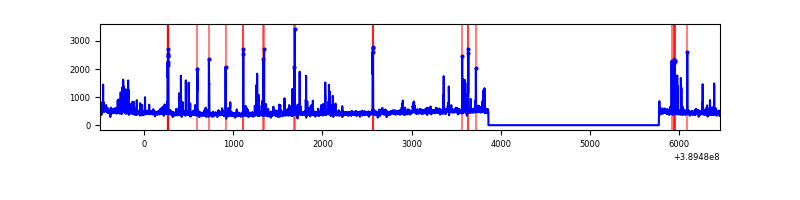 |
Top three noisy pixels from each quadrant. If the there are fewer than three noisy pixels in the level2.evt file, extra rows are filled as -1
| Pixel properties | Quadrant properties | ||||||
|---|---|---|---|---|---|---|---|
| Quadrant | DetID | PixID | Counts | Sigma | Mean | Median | Sigma |
| A | 10 | 83 | 134700 | 1165.69 | 567 | 556 | 115.1 |
| A | 10 | 255 | 13375 | 111.39 | 567 | 556 | 115.1 |
| A | 13 | 6 | 7983 | 64.54 | 567 | 556 | 115.1 |
| B | 5 | 172 | 856370 | 8049.24 | 555 | 540 | 106.3 |
| B | 10 | 244 | 245767 | 2306.4 | 555 | 540 | 106.3 |
| B | 5 | 255 | 37878 | 351.17 | 555 | 540 | 106.3 |
| C | 0 | 10 | 266277 | 2039.73 | 560 | 564 | 130.3 |
| C | 15 | 214 | 213846 | 1637.25 | 560 | 564 | 130.3 |
| C | 4 | 254 | 9701 | 70.14 | 560 | 564 | 130.3 |
| D | 13 | 249 | 135820 | 993.19 | 558 | 541 | 136.2 |
| D | 12 | 6 | 63867 | 464.93 | 558 | 541 | 136.2 |
| D | 2 | 153 | 33662 | 243.17 | 558 | 541 | 136.2 |
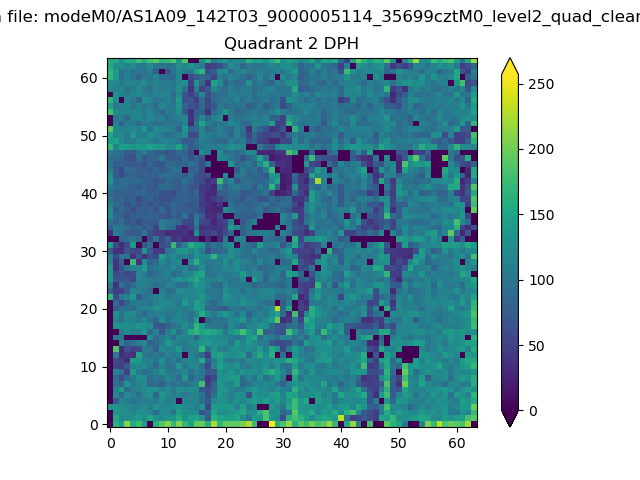
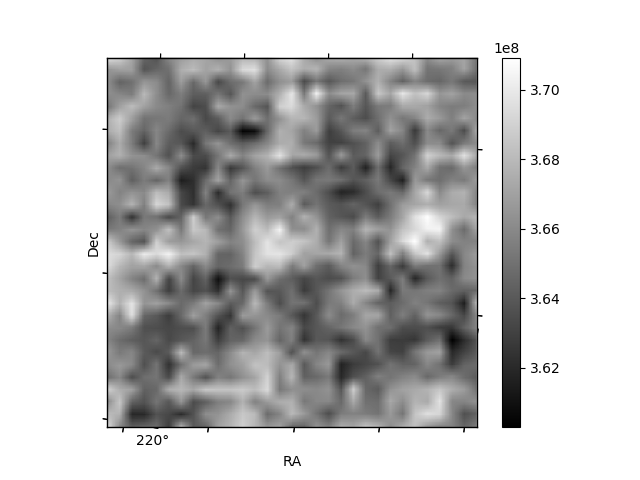
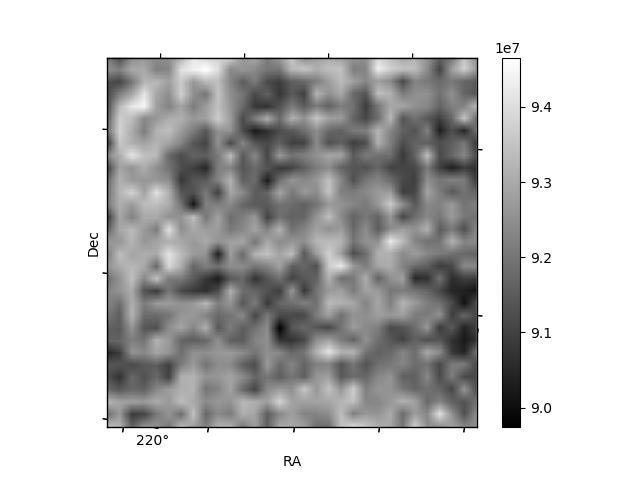
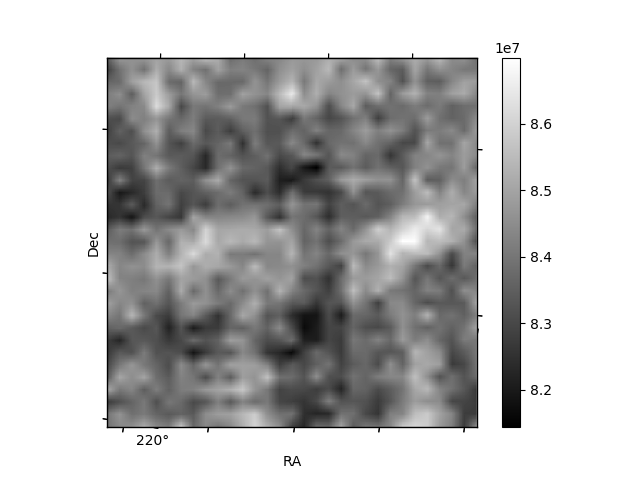
Histogram calculated using DETX and DETY for each event in the final _common_clean file
| Quadrant A | 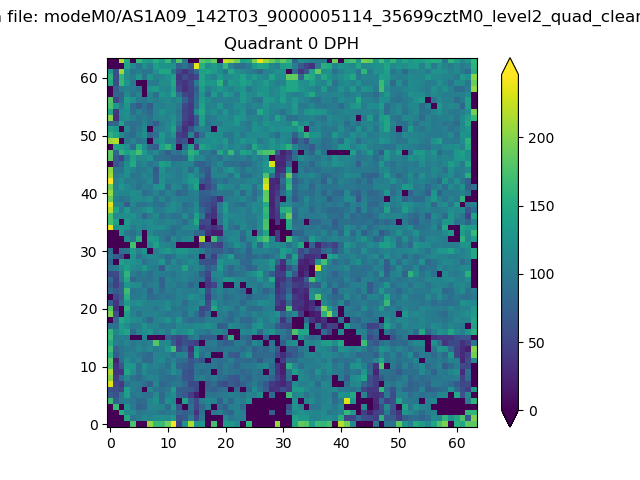 |
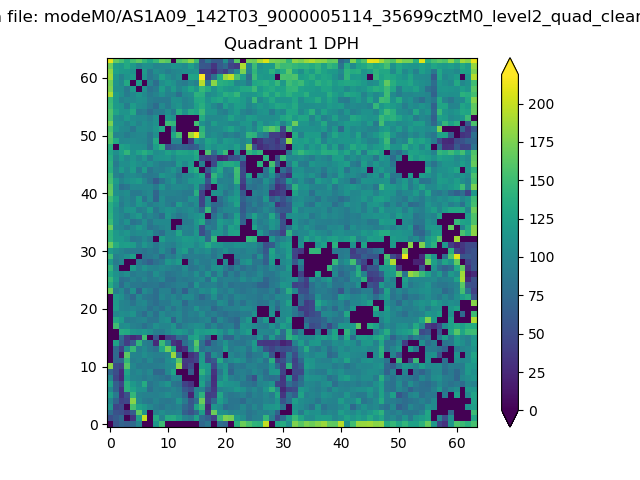 |
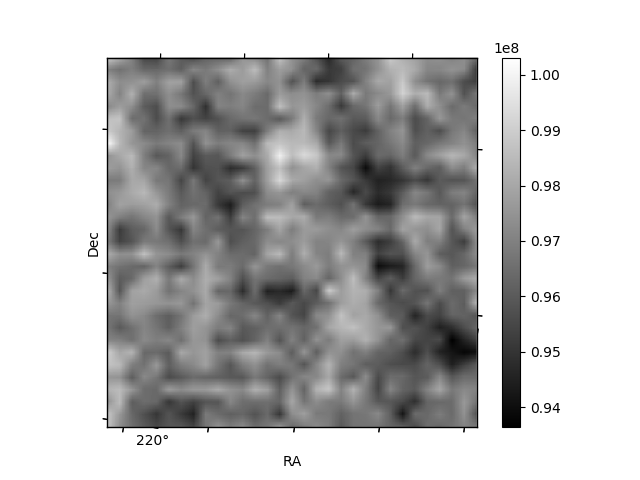
Quadrant B |
|---|---|---|---|
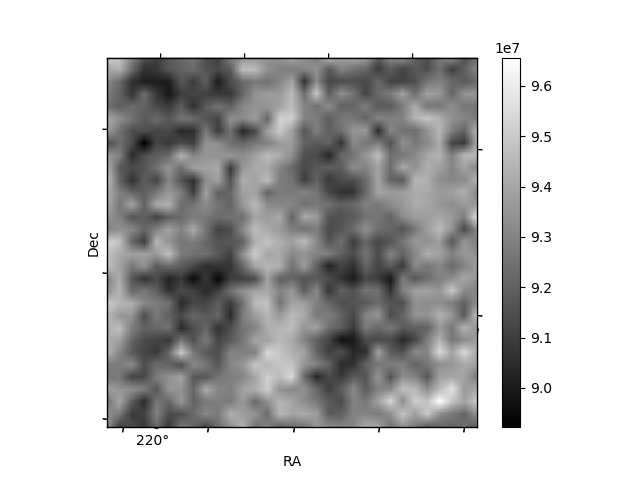
| Quadrant D | 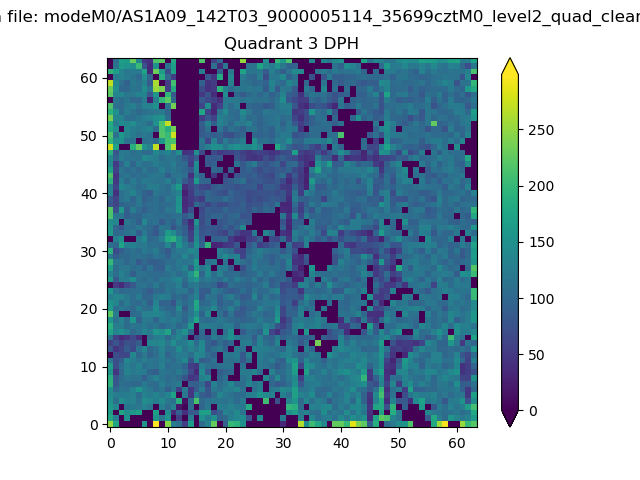 |
 |
Quadrant C |
| Plot type | Count rate plots | Images |
|---|---|---|
| Comparison with Poisson distribution Blue bars denote a histogram of data divided into 1 sec bins. Red curve is a Poisson curve with rate = median count rate of data. |
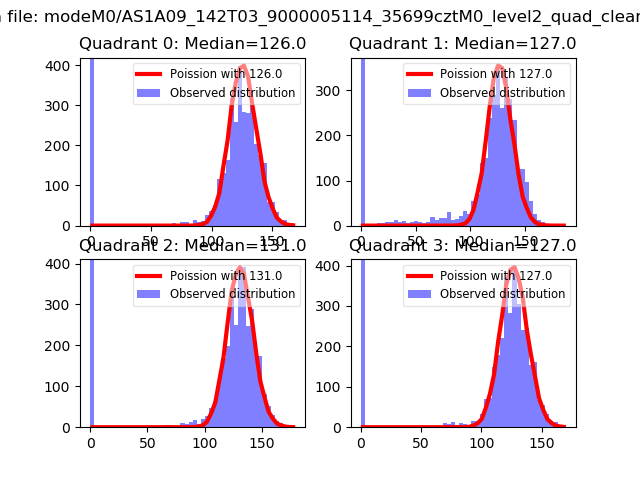 |
 |
| Quadrant-wise count rates Data is divided into 100 sec bins |
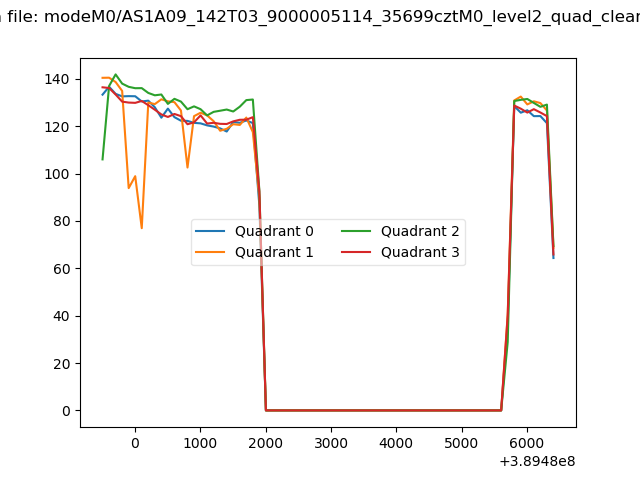 |
|
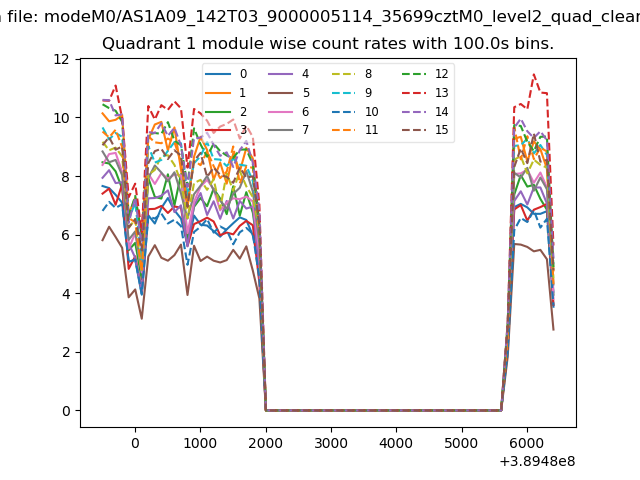
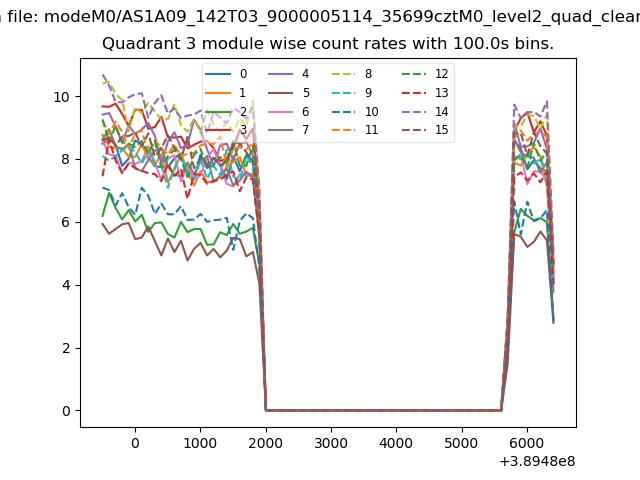
| Module-wise count rates for Quadrant A Data is divided into 100 sec bins |
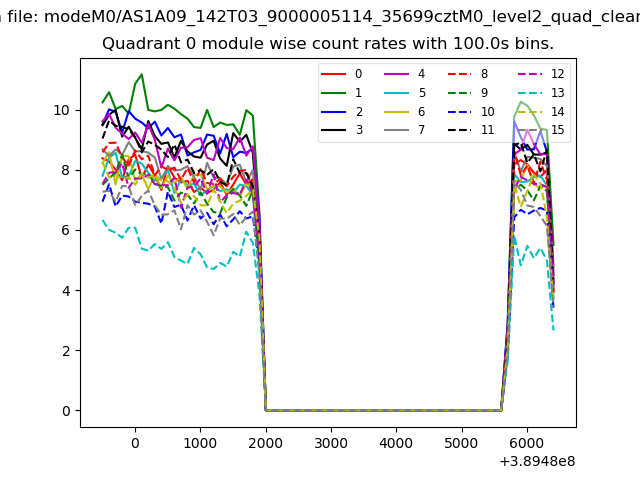 |
 |
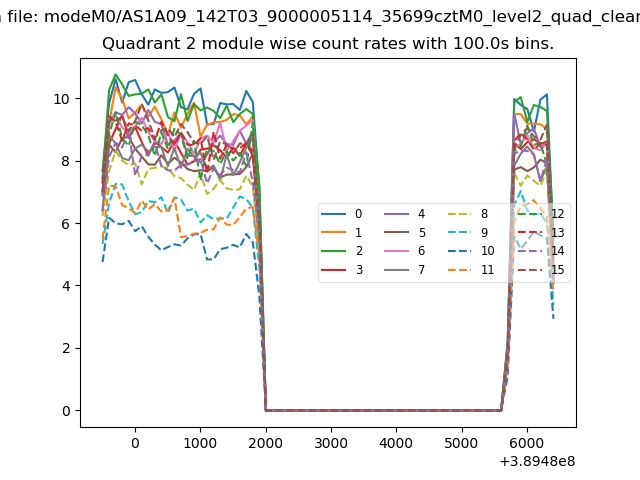
| Module-wise count rates for Quadrant B Data is divided into 100 sec bins |
 |
 |
| Module-wise count rates for Quadrant C Data is divided into 100 sec bins |
 |
 |
| Module-wise count rates for Quadrant D Data is divided into 100 sec bins |
 |
 |
| Parameter | Plot |
|---|---|
| CZT HV Monitor | 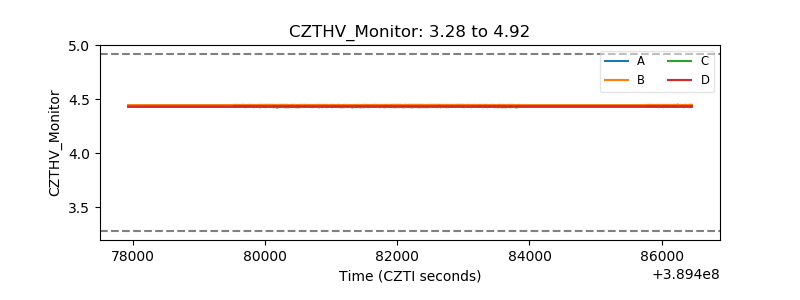 |
| D_VDD | 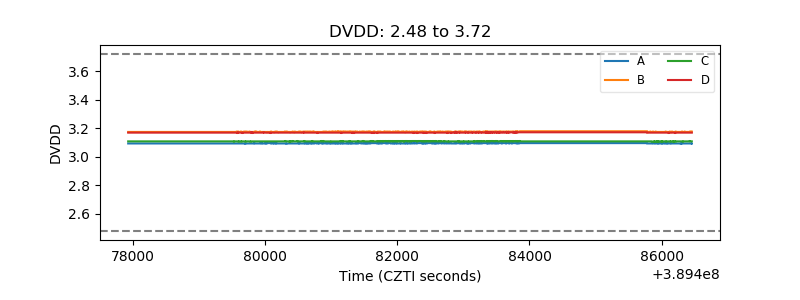 |
| Temperature 1 | 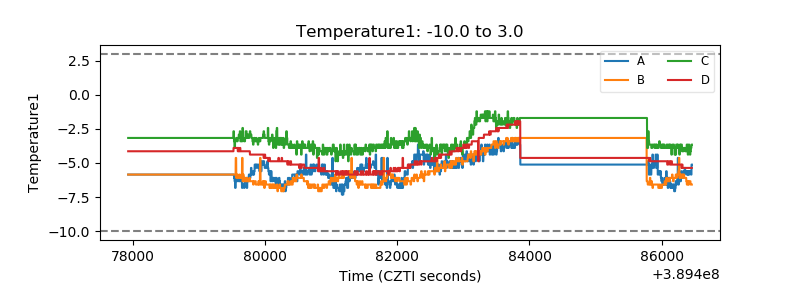 |
| Veto HV Monitor | 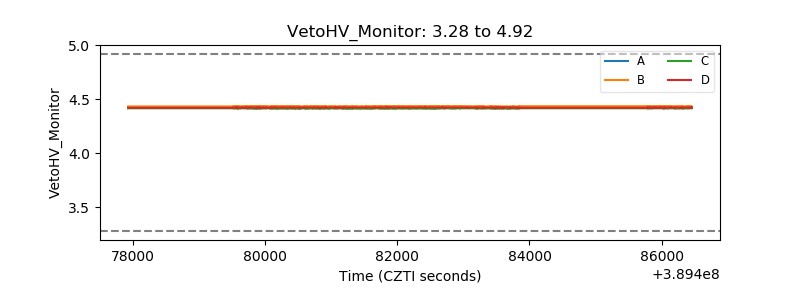 |
| Veto LLD | 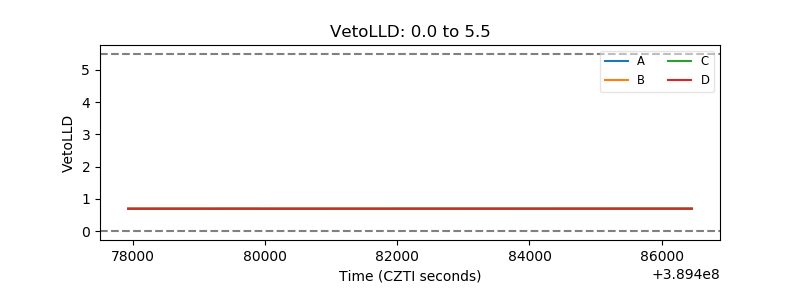 |
| Alpha Counter | 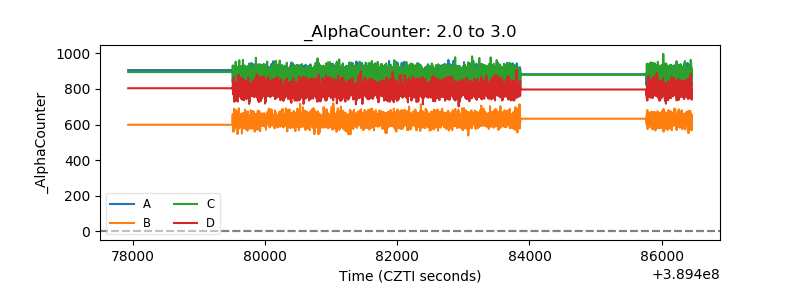 |
| _CPM_Rate | 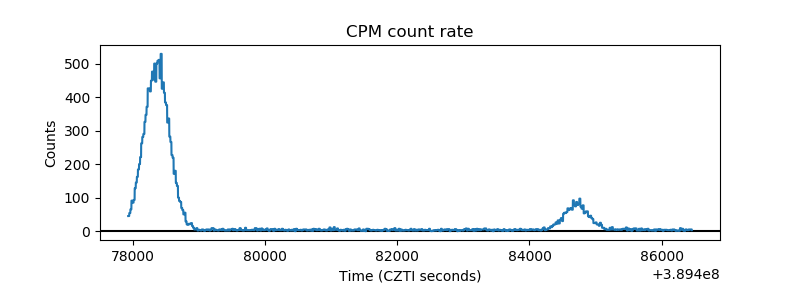 |
| CZT Counter | 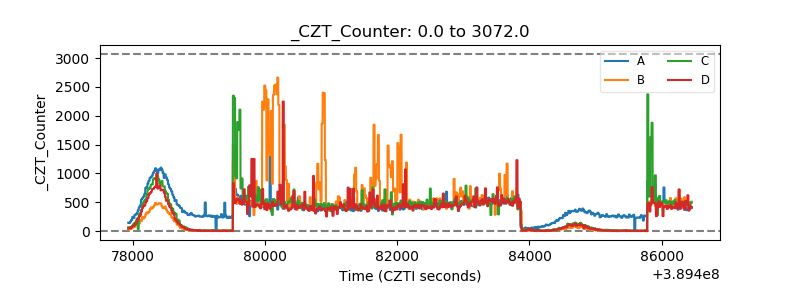 |
| +2.5 Volts monitor | 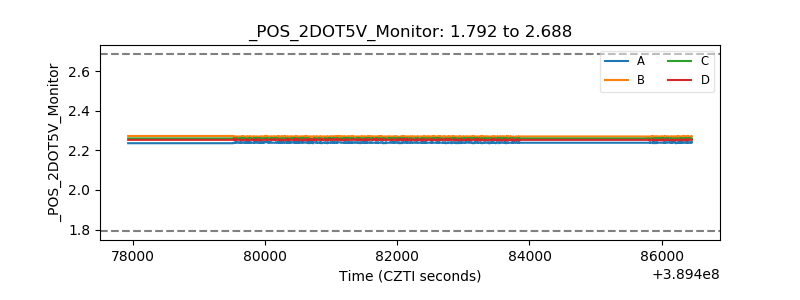 |
| +5 Volts monitor | 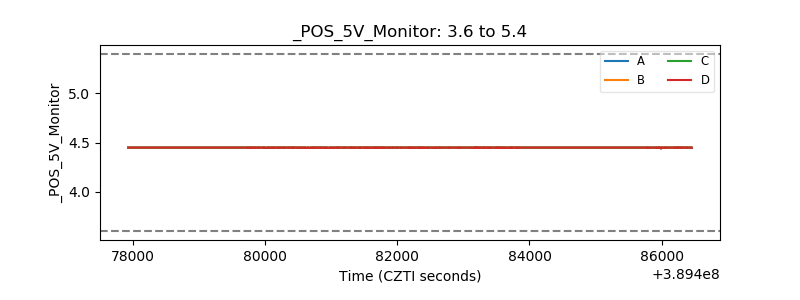 |
| _ROLL_ROT | 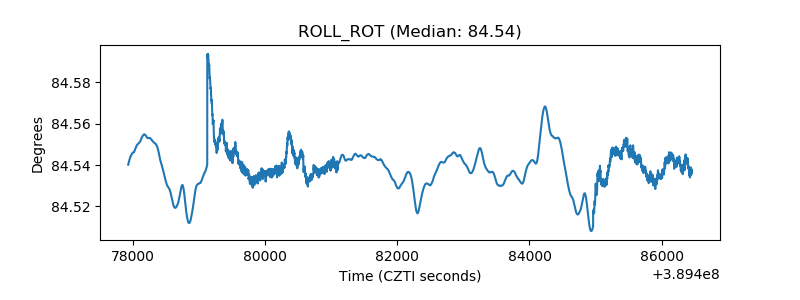 |
| _Roll_DEC | 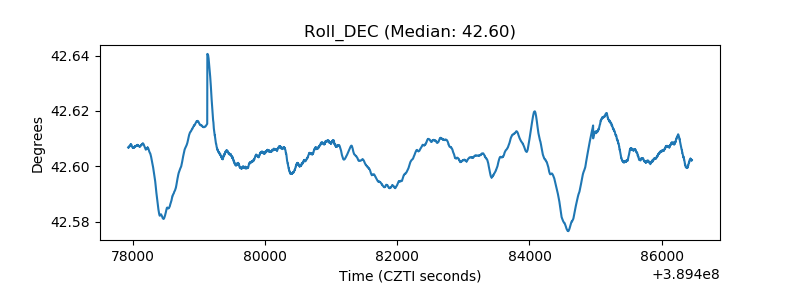 |
| _Roll_RA | 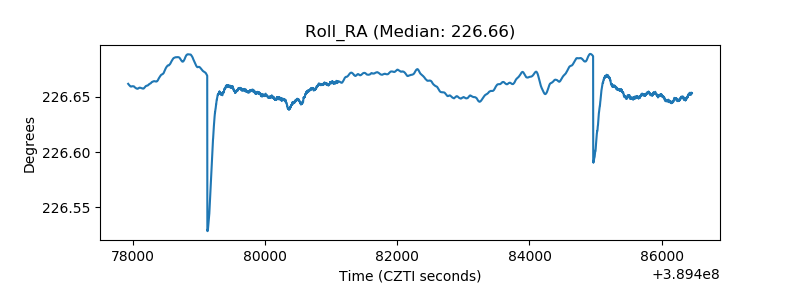 |
| Veto Counter | 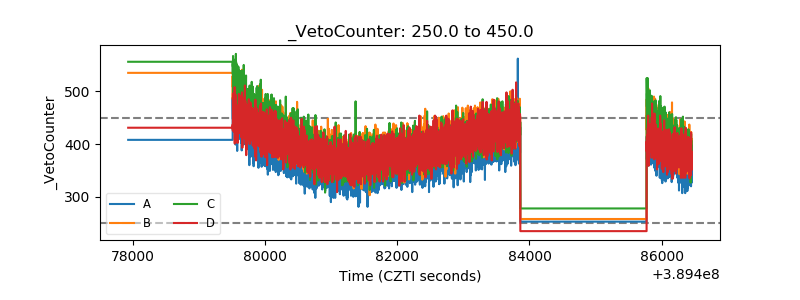 |