| Param | Original file | Final file |
|---|---|---|
| Filename | modeM0/AS1A09_142T03_9000005114cztM0_level2_bc.evt | modeM0/AS1A09_142T03_9000005114cztM0_level2_quad_clean.evt |
| Size (bytes) | 1,272,254,400 | 398,839,680 |
| Size | 1.2 GB | 380.4 MB |
| Events in quadrant A | 7,396,136 | 2,404,112 |
| Events in quadrant B | 9,858,893 | 2,434,463 |
| Events in quadrant C | 9,328,243 | 2,466,396 |
| Events in quadrant D | 9,551,294 | 2,363,356 |
| Mode SS | |||
|---|---|---|---|
| Quadrant | BADHDUFLAG | Total packets | Discarded packets |
| A | 0 | 714 | 0 |
| B | 0 | 714 | 0 |
| C | 0 | 714 | 0 |
| D | 0 | 714 | 0 |
| Mode M0 | |||
|---|---|---|---|
| Quadrant | BADHDUFLAG | Total packets | Discarded packets |
| A | 0 | 71283 | 0 |
| B | 0 | 81362 | 0 |
| C | 0 | 75258 | 0 |
| D | 0 | 79629 | 0 |
| Mode M9 | |||
|---|---|---|---|
| Quadrant | BADHDUFLAG | Total packets | Discarded packets |
| A | 0 | 111 | 0 |
| B | 0 | 111 | 0 |
| C | 0 | 111 | 0 |
| D | 0 | 111 | 0 |
| Quadrant | Total seconds | Saturated seconds | Saturation percentage |
|---|---|---|---|
| A | 35115 | 32 | 0.091129% |
| B | 35115 | 704 | 2.004841% |
| C | 35115 | 335 | 0.954008% |
| D | 35115 | 462 | 1.315677% |
Noise dominated data is calculated using 1-second bins in cleaned event files. If a bin has >2000 counts, and if more than 50% of those come from <1% of pixels, then it is considered to be noise-dominated and hence unusable.
| Quadrant | # 1 sec bins | Bins with >0 counts | Bins with >2000 counts | High rate bins dominated by noise | Noise dominated (total time) | Noise dominated (detector-on time) | Marked lightcurve |
|---|---|---|---|---|---|---|---|
| A | 46102 | 35122 | 0 | 0 | 0.00% | 0.00% | 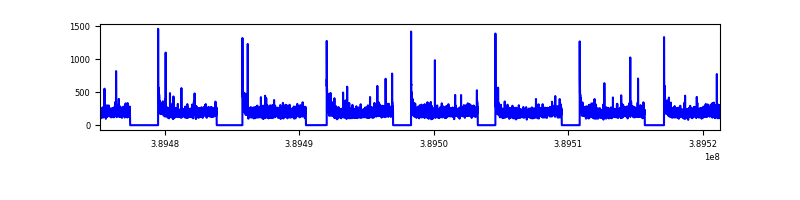 |
| B | 46102 | 35115 | 35 | 35 | 0.08% | 0.10% | 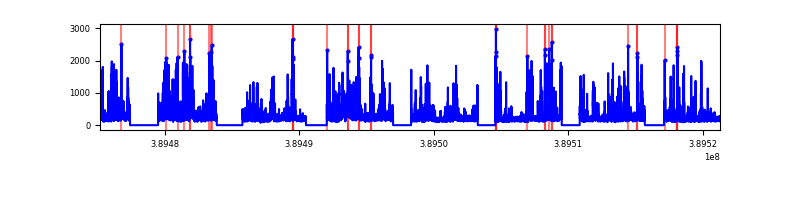 |
| C | 46102 | 35115 | 94 | 94 | 0.20% | 0.27% | 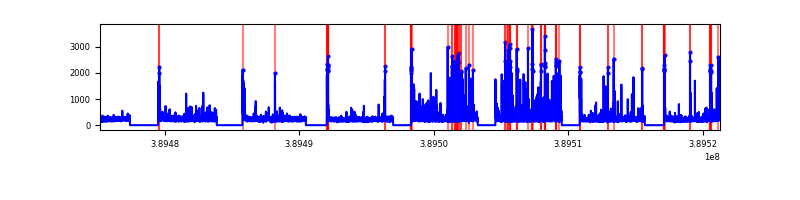 |
| D | 46102 | 35115 | 66 | 66 | 0.14% | 0.19% | 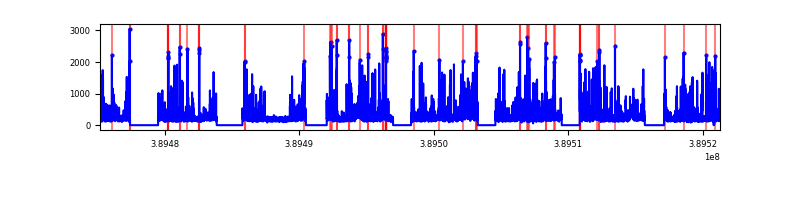 |
Top three noisy pixels from each quadrant. If the there are fewer than three noisy pixels in the level2.evt file, extra rows are filled as -1
| Pixel properties | Quadrant properties | ||||||
|---|---|---|---|---|---|---|---|
| Quadrant | DetID | PixID | Counts | Sigma | Mean | Median | Sigma |
| A | 10 | 83 | 664580 | 1729.96 | 1719 | 1685 | 383.2 |
| A | 13 | 6 | 42188 | 105.7 | 1719 | 1685 | 383.2 |
| A | 10 | 255 | 41223 | 103.18 | 1719 | 1685 | 383.2 |
| B | 5 | 172 | 1930849 | 5570.03 | 1736 | 1693 | 346.3 |
| B | 10 | 244 | 715430 | 2060.76 | 1736 | 1693 | 346.3 |
| B | 5 | 255 | 364131 | 1046.46 | 1736 | 1693 | 346.3 |
| C | 15 | 214 | 1385012 | 3457.5 | 1730 | 1713 | 400.1 |
| C | 0 | 10 | 1026470 | 2561.34 | 1730 | 1713 | 400.1 |
| C | 14 | 128 | 66617 | 162.22 | 1730 | 1713 | 400.1 |
| D | 13 | 249 | 1252864 | 3034.96 | 1732 | 1677 | 412.3 |
| D | 12 | 6 | 427426 | 1032.72 | 1732 | 1677 | 412.3 |
| D | 2 | 153 | 290817 | 701.36 | 1732 | 1677 | 412.3 |
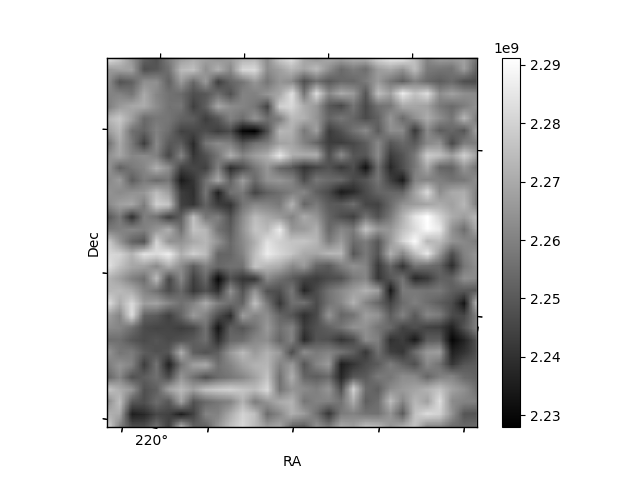
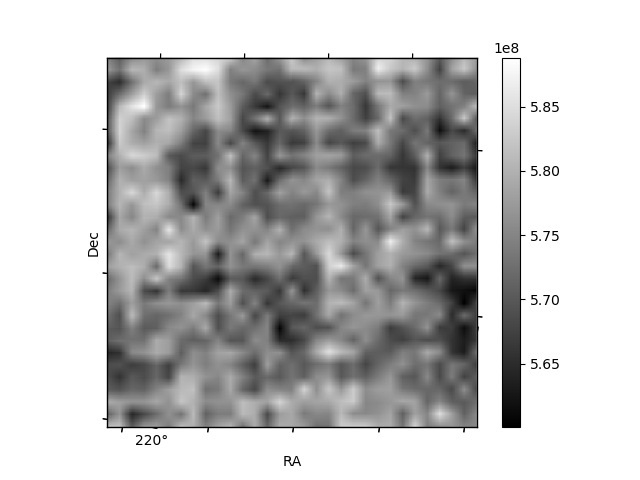
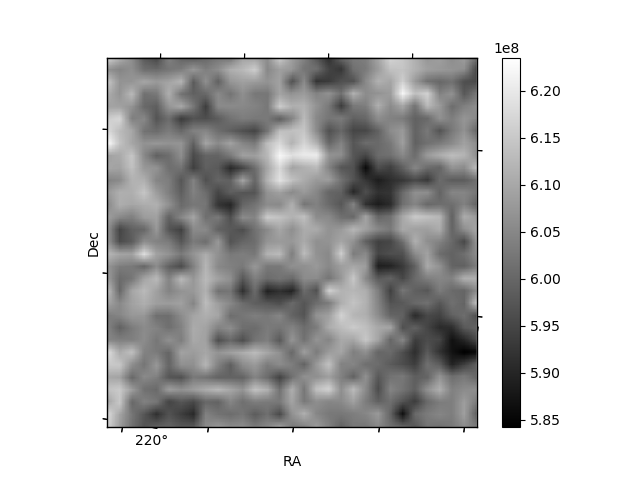
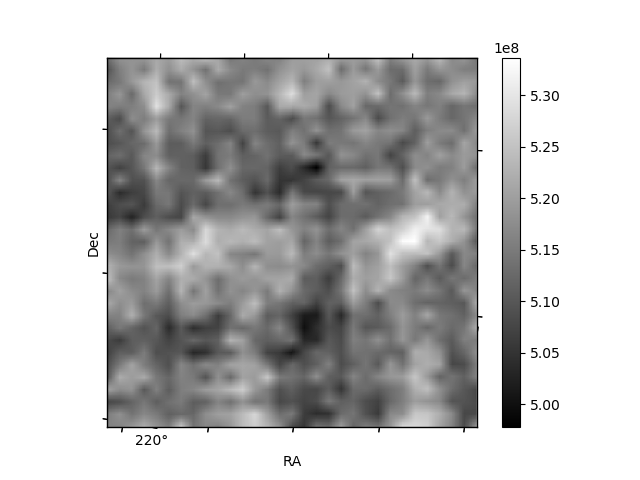
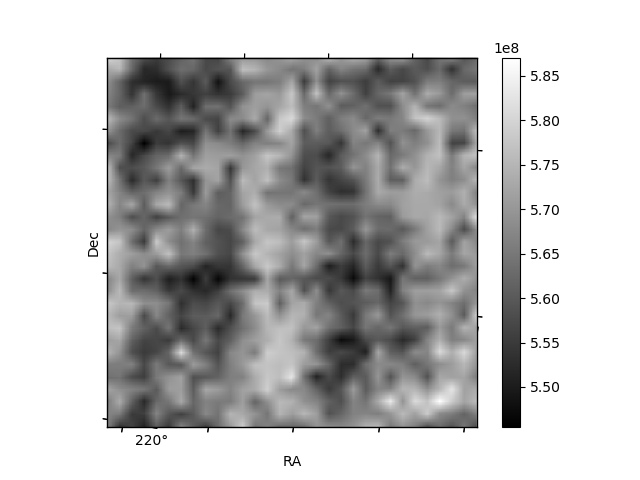
Histogram calculated using DETX and DETY for each event in the final _common_clean file
| Quadrant A | 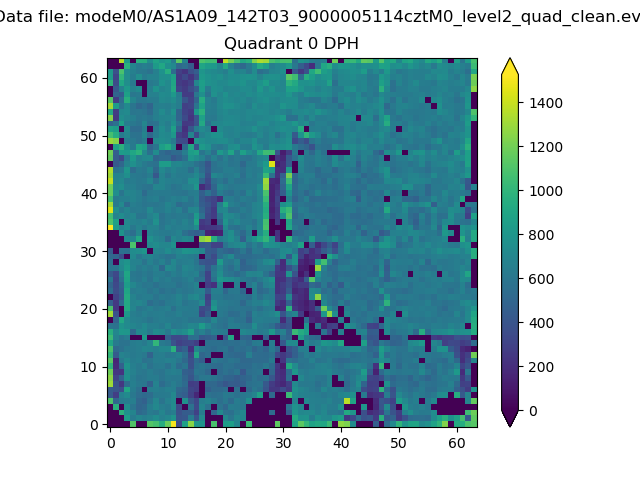 |
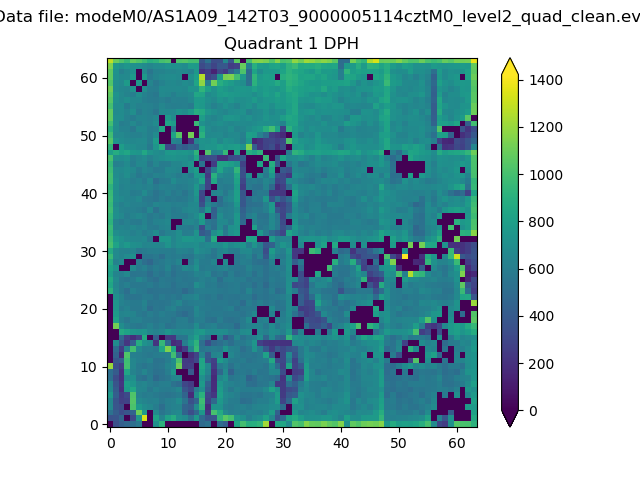 |
Quadrant B |
|---|---|---|---|
| Quadrant D | 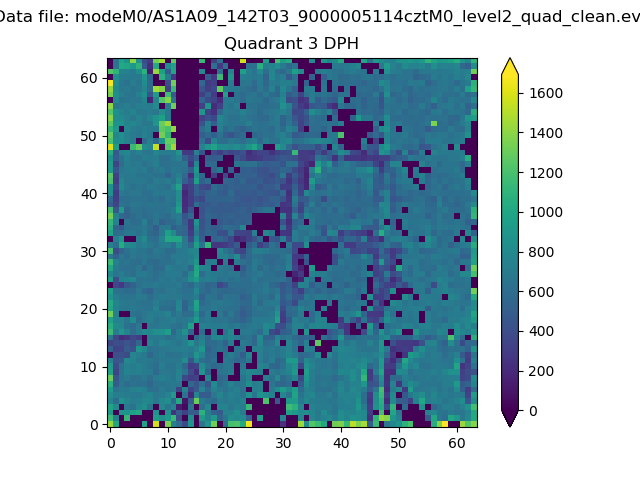 |
 |
Quadrant C |
| Plot type | Count rate plots | Images |
|---|---|---|
| Comparison with Poisson distribution Blue bars denote a histogram of data divided into 1 sec bins. Red curve is a Poisson curve with rate = median count rate of data. |
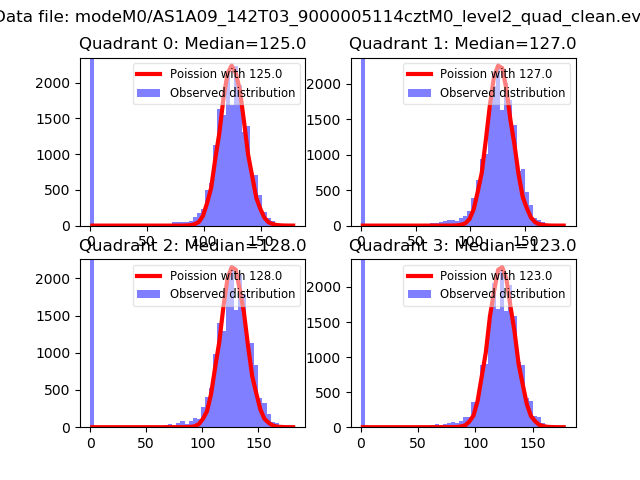 |
 |
| Quadrant-wise count rates Data is divided into 100 sec bins |
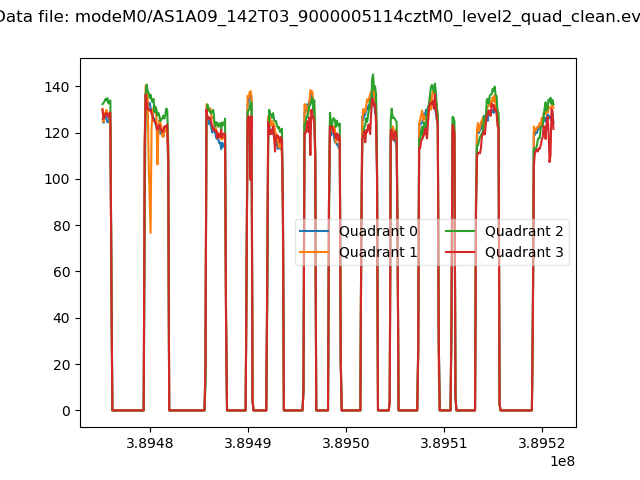 |
|
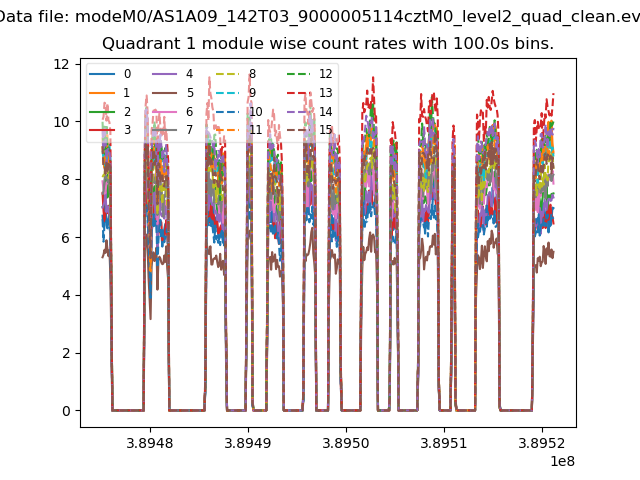
| Module-wise count rates for Quadrant A Data is divided into 100 sec bins |
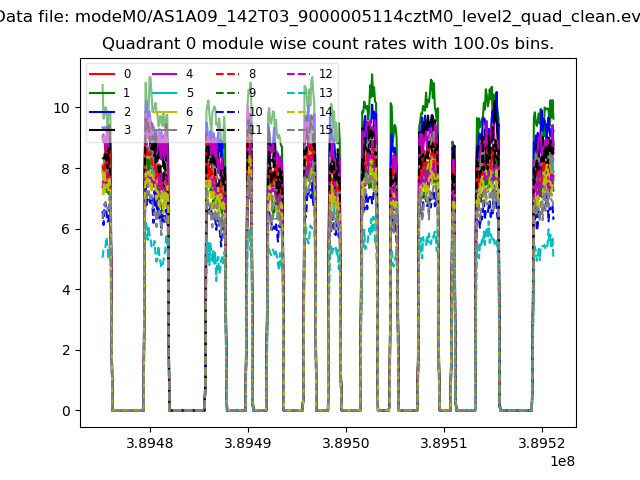 |
 |
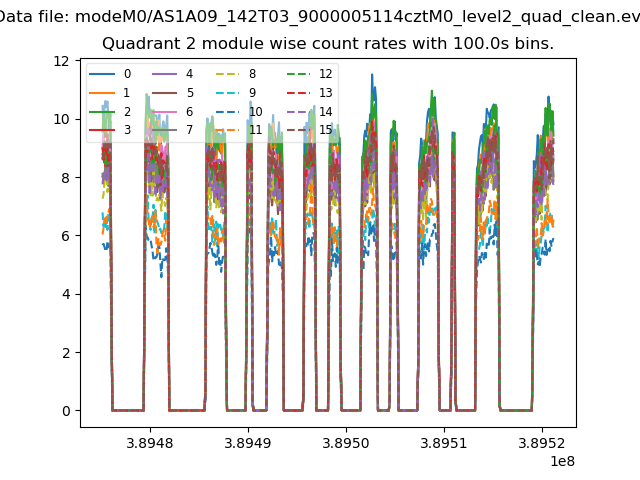
| Module-wise count rates for Quadrant B Data is divided into 100 sec bins |
 |
 |
| Module-wise count rates for Quadrant C Data is divided into 100 sec bins |
 |
 |
| Module-wise count rates for Quadrant D Data is divided into 100 sec bins |
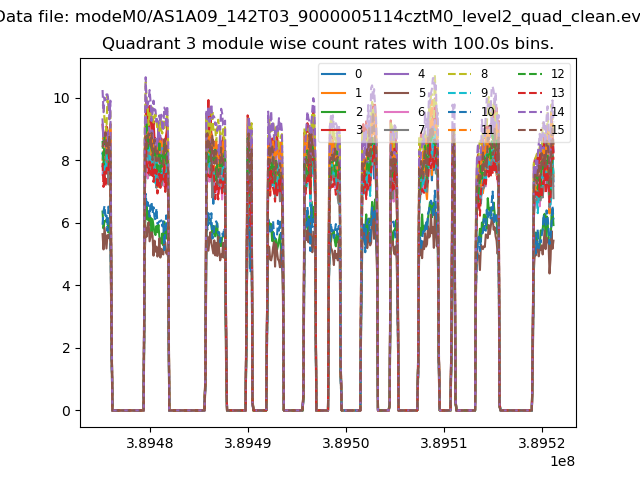 |
 |
| Parameter | Plot |
|---|---|
| CZT HV Monitor | 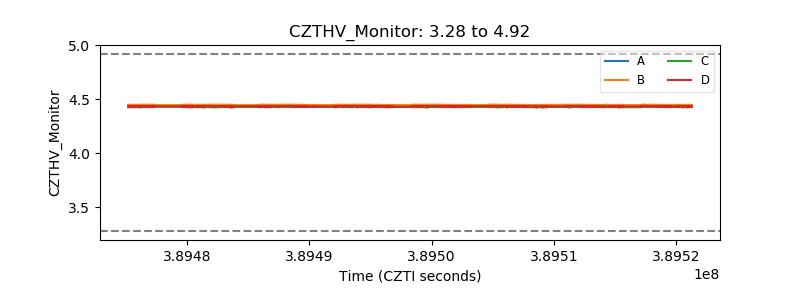 |
| D_VDD | 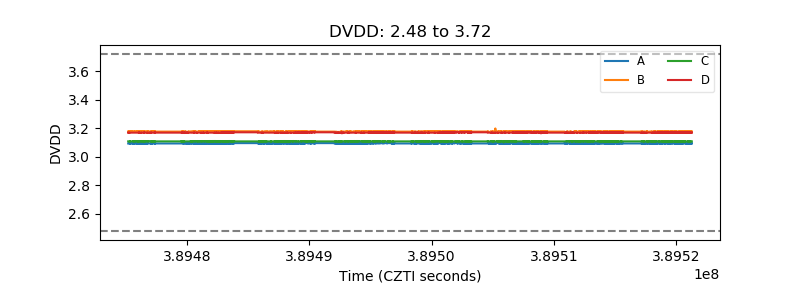 |
| Temperature 1 | 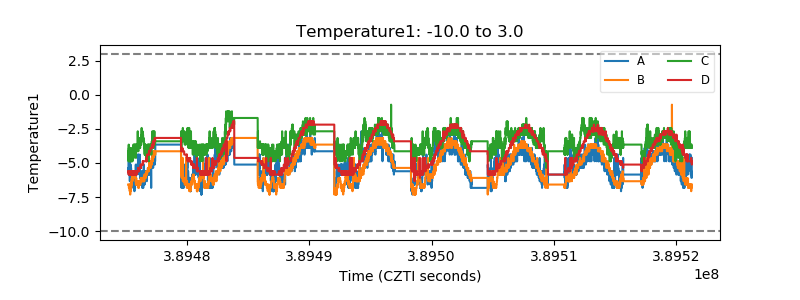 |
| Veto HV Monitor | 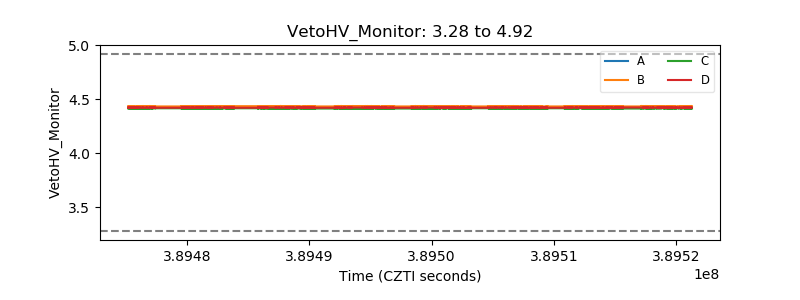 |
| Veto LLD | 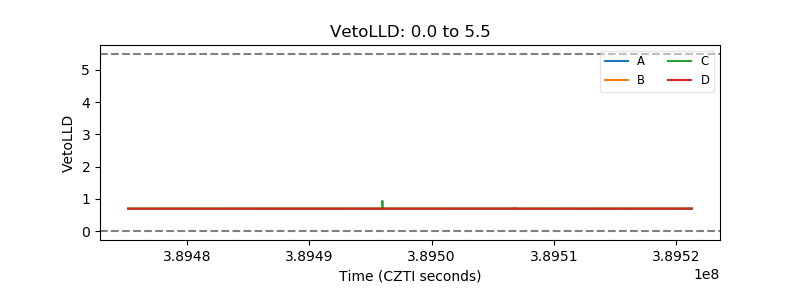 |
| Alpha Counter | 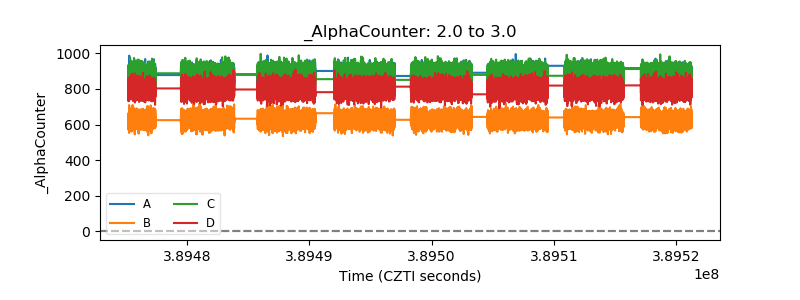 |
| _CPM_Rate | 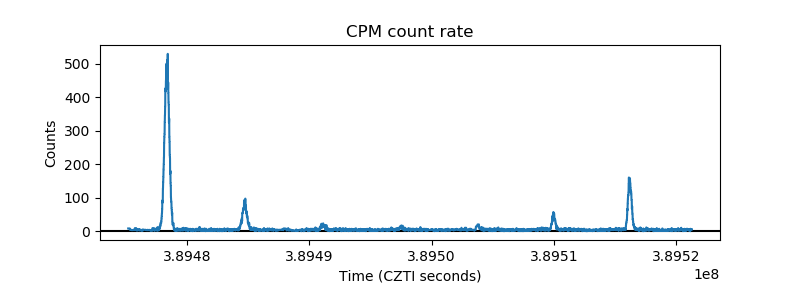 |
| CZT Counter | 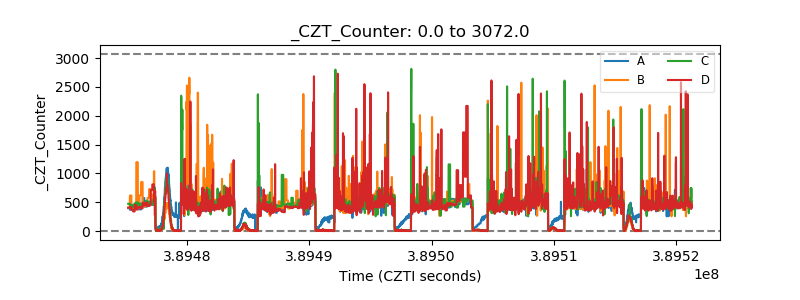 |
| +2.5 Volts monitor | 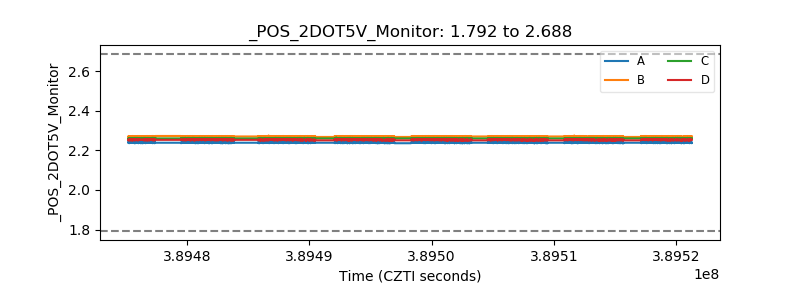 |
| +5 Volts monitor | 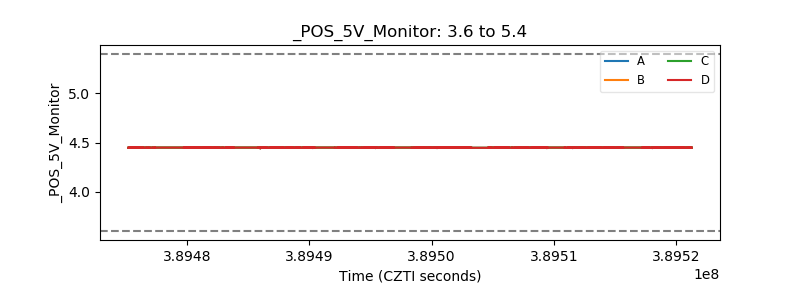 |
| _ROLL_ROT | 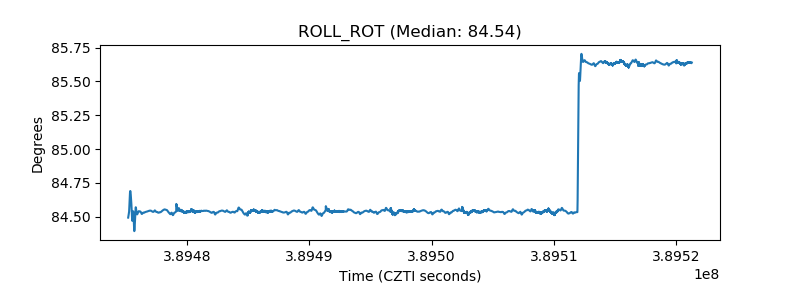 |
| _Roll_DEC | 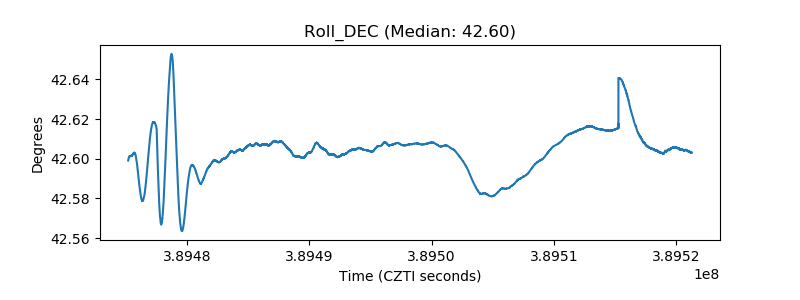 |
| _Roll_RA | 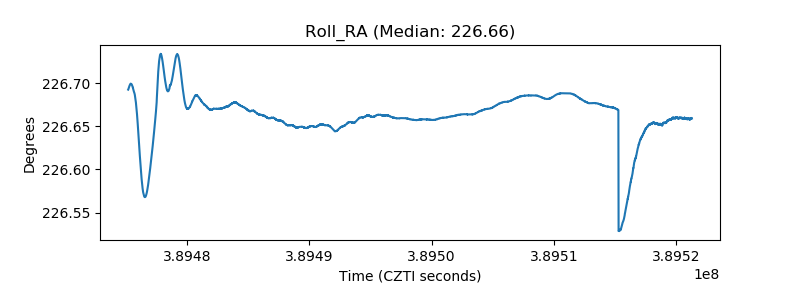 |
| Veto Counter | 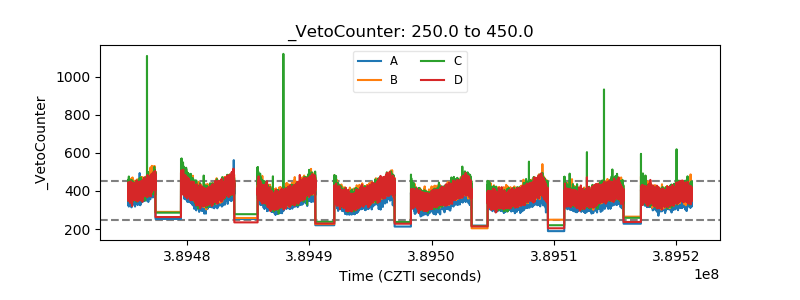 |