| Param | Original file | Final file |
|---|---|---|
| Filename | modeM0/AS1A09_142T02_9000005112_35694cztM0_level2.evt | modeM0/AS1A09_142T02_9000005112_35694cztM0_level2_quad_clean.evt |
| Size (bytes) | 401,762,880 | 94,988,160 |
| Size | 383.2 MB | 90.6 MB |
| Events in quadrant A | 2,728,847 | 639,733 |
| Events in quadrant B | 3,021,190 | 636,542 |
| Events in quadrant C | 2,845,787 | 627,303 |
| Events in quadrant D | 3,206,934 | 597,649 |
| Mode SS | |||
|---|---|---|---|
| Quadrant | BADHDUFLAG | Total packets | Discarded packets |
| A | 0 | 108 | 0 |
| B | 0 | 108 | 0 |
| C | 0 | 108 | 0 |
| D | 0 | 108 | 0 |
| Mode M0 | |||
|---|---|---|---|
| Quadrant | BADHDUFLAG | Total packets | Discarded packets |
| A | 0 | 11478 | 3 |
| B | 0 | 12218 | 2 |
| C | 0 | 11565 | 2 |
| D | 0 | 12984 | 2 |
| Mode M9 | |||
|---|---|---|---|
| Quadrant | BADHDUFLAG | Total packets | Discarded packets |
| A | 0 | 35 | 0 |
| B | 0 | 35 | 0 |
| C | 0 | 35 | 0 |
| D | 0 | 35 | 0 |
| Quadrant | Total seconds | Saturated seconds | Saturation percentage |
|---|---|---|---|
| A | 5368 | 11 | 0.204918% |
| B | 5368 | 87 | 1.620715% |
| C | 5368 | 40 | 0.745156% |
| D | 5368 | 148 | 2.757079% |
Noise dominated data is calculated using 1-second bins in cleaned event files. If a bin has >2000 counts, and if more than 50% of those come from <1% of pixels, then it is considered to be noise-dominated and hence unusable.
| Quadrant | # 1 sec bins | Bins with >0 counts | Bins with >2000 counts | High rate bins dominated by noise | Noise dominated (total time) | Noise dominated (detector-on time) | Marked lightcurve |
|---|---|---|---|---|---|---|---|
| A | 7221 | 5369 | 1 | 1 | 0.01% | 0.02% |  |
| B | 7221 | 5369 | 60 | 60 | 0.83% | 1.12% | 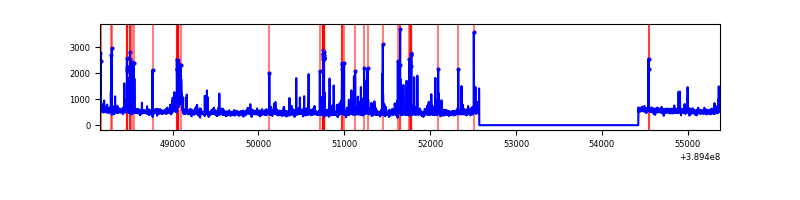 |
| C | 7221 | 5369 | 33 | 33 | 0.46% | 0.61% | 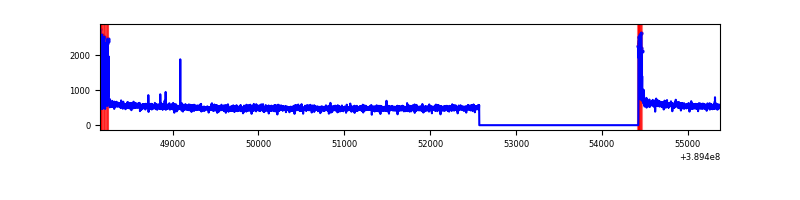 |
| D | 7221 | 5369 | 137 | 137 | 1.90% | 2.55% | 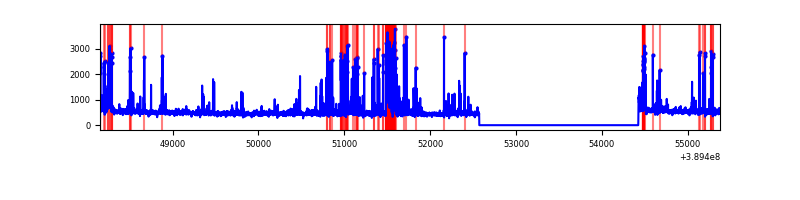 |
Top three noisy pixels from each quadrant. If the there are fewer than three noisy pixels in the level2.evt file, extra rows are filled as -1
| Pixel properties | Quadrant properties | ||||||
|---|---|---|---|---|---|---|---|
| Quadrant | DetID | PixID | Counts | Sigma | Mean | Median | Sigma |
| A | 10 | 83 | 148319 | 1121.58 | 658 | 646 | 131.7 |
| A | 13 | 6 | 24504 | 181.2 | 658 | 646 | 131.7 |
| A | 7 | 3 | 10829 | 77.34 | 658 | 646 | 131.7 |
| B | 5 | 172 | 200567 | 1636.67 | 641 | 625 | 122.2 |
| B | 5 | 255 | 179551 | 1464.64 | 641 | 625 | 122.2 |
| B | 3 | 112 | 40968 | 330.24 | 641 | 625 | 122.2 |
| C | 15 | 214 | 224906 | 1530.43 | 635 | 641 | 146.5 |
| C | 0 | 10 | 134215 | 911.53 | 635 | 641 | 146.5 |
| C | 4 | 254 | 6751 | 41.7 | 635 | 641 | 146.5 |
| D | 12 | 6 | 406818 | 2635.62 | 635 | 618 | 154.1 |
| D | 13 | 249 | 160252 | 1035.78 | 635 | 618 | 154.1 |
| D | 2 | 153 | 42035 | 268.73 | 635 | 618 | 154.1 |
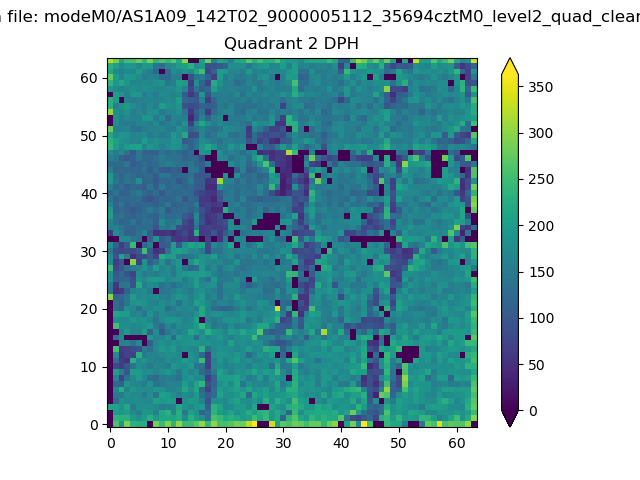
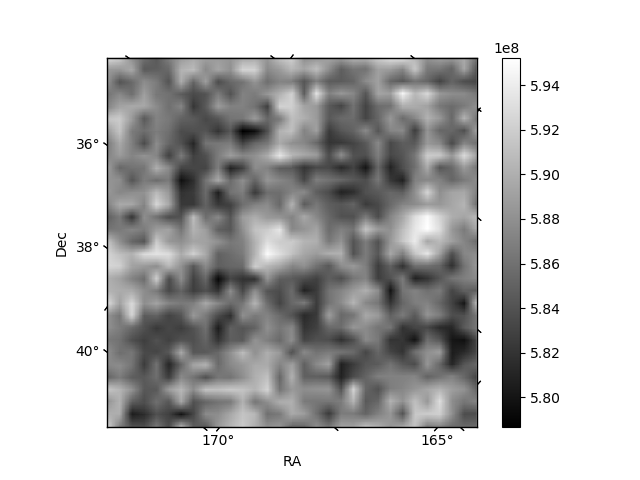
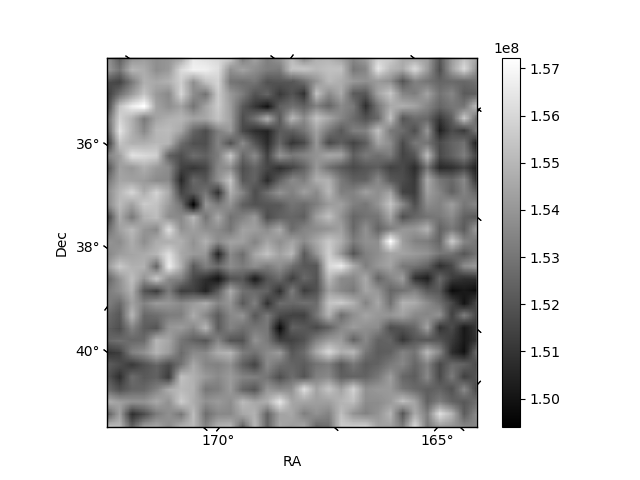
Histogram calculated using DETX and DETY for each event in the final _common_clean file
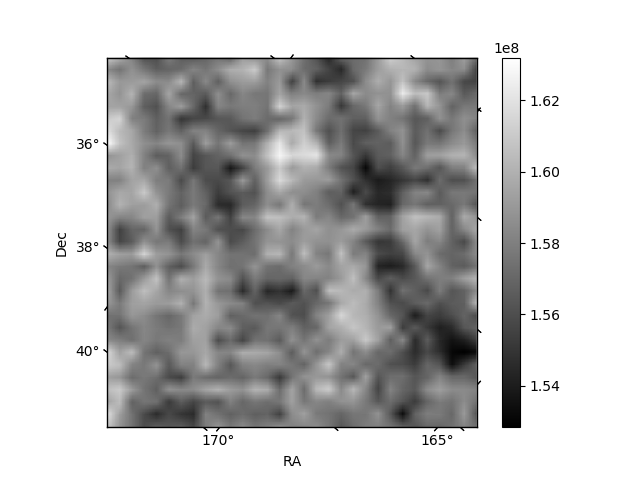
| Quadrant A | 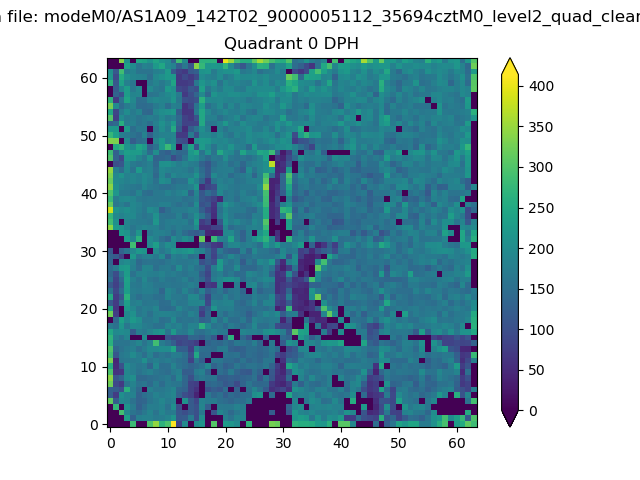 |
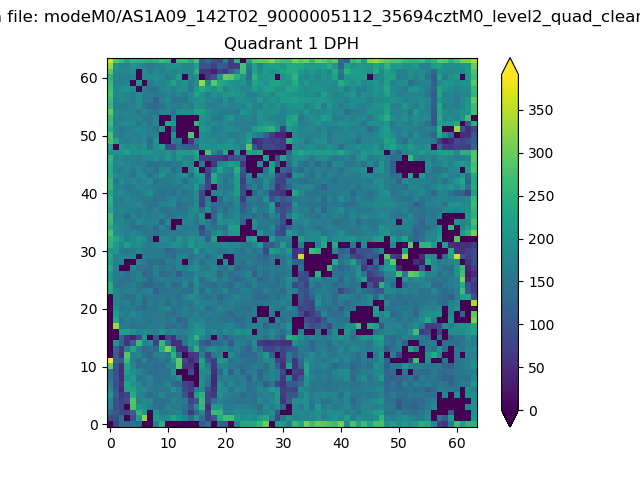 |
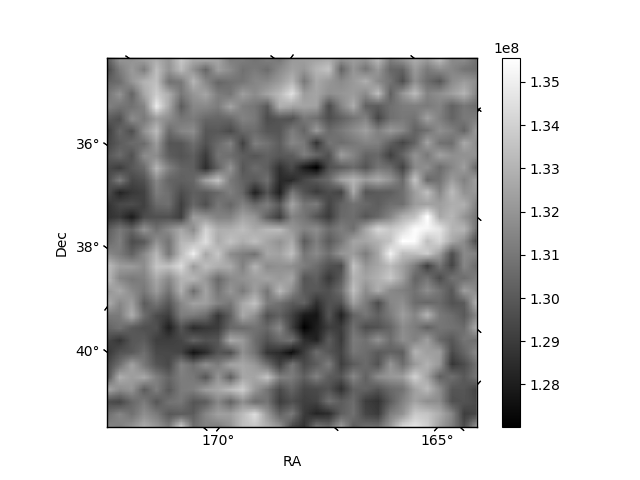
Quadrant B |
|---|---|---|---|
| Quadrant D | 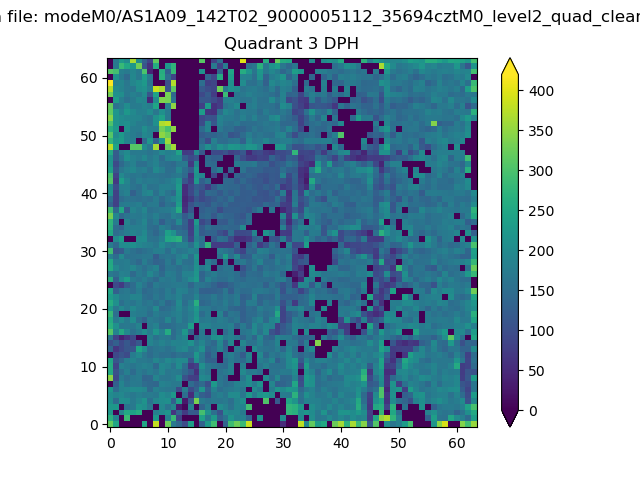 |
 |
Quadrant C |
| Plot type | Count rate plots | Images |
|---|---|---|
| Comparison with Poisson distribution Blue bars denote a histogram of data divided into 1 sec bins. Red curve is a Poisson curve with rate = median count rate of data. |
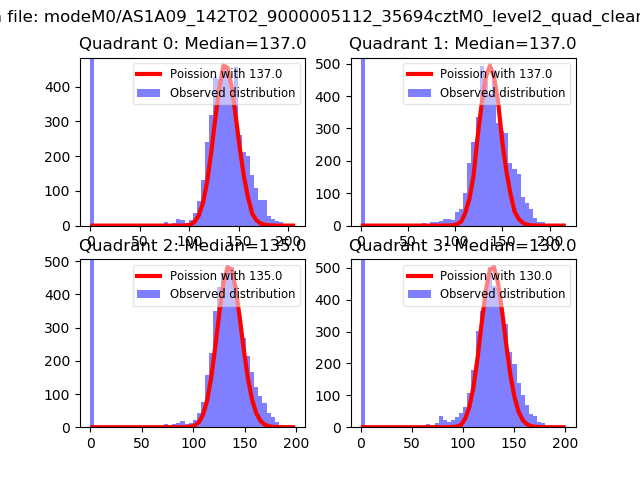 |
 |
| Quadrant-wise count rates Data is divided into 100 sec bins |
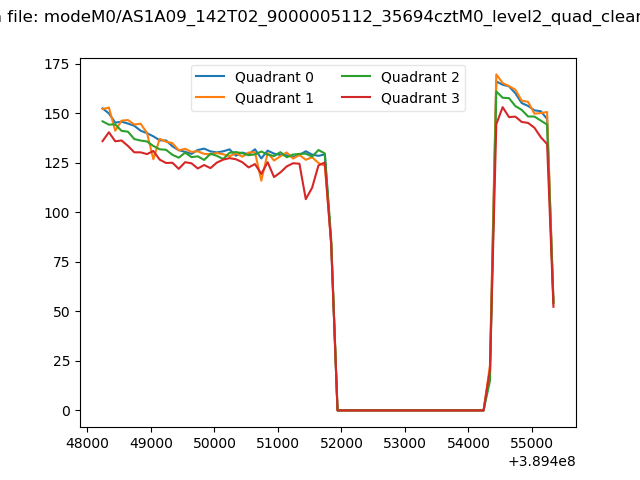 |
|
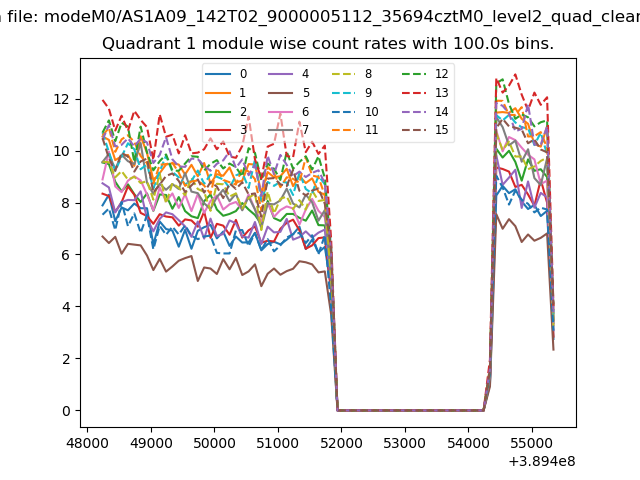
| Module-wise count rates for Quadrant A Data is divided into 100 sec bins |
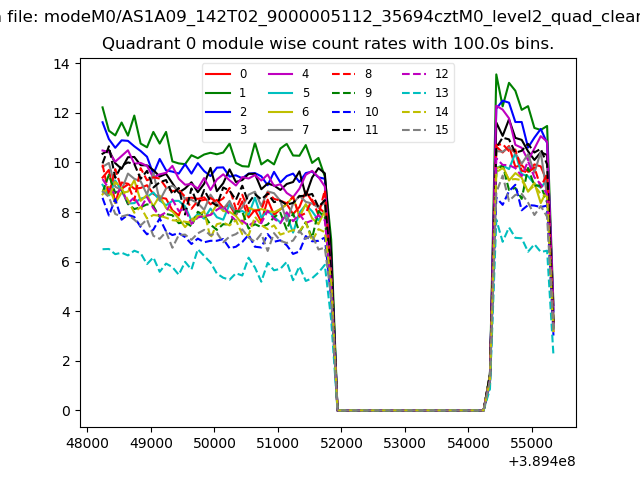 |
 |
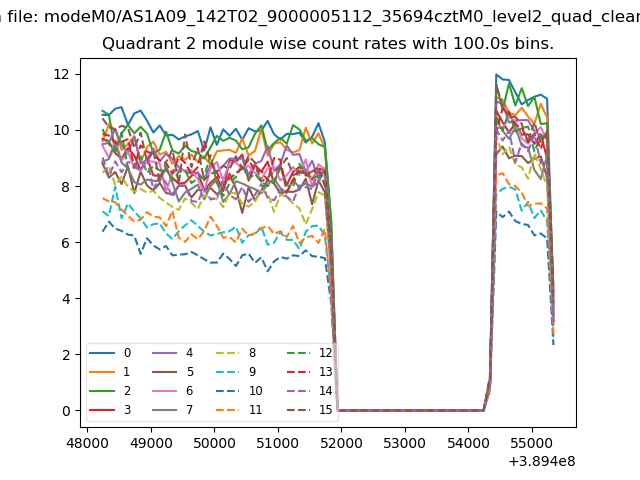
| Module-wise count rates for Quadrant B Data is divided into 100 sec bins |
 |
 |
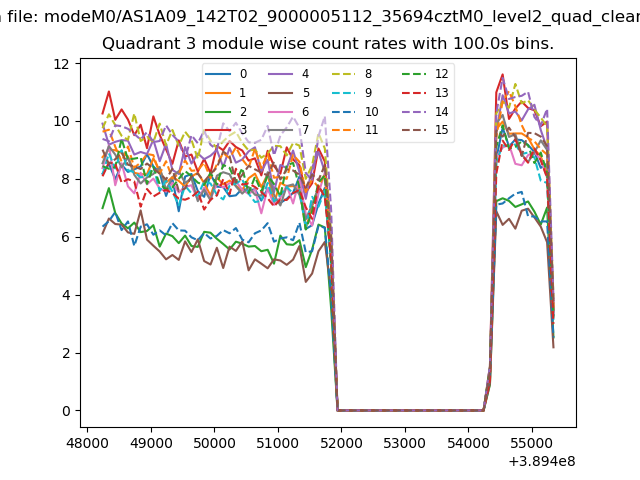
| Module-wise count rates for Quadrant C Data is divided into 100 sec bins |
 |
 |
| Module-wise count rates for Quadrant D Data is divided into 100 sec bins |
 |
 |
| Parameter | Plot |
|---|---|
| CZT HV Monitor | 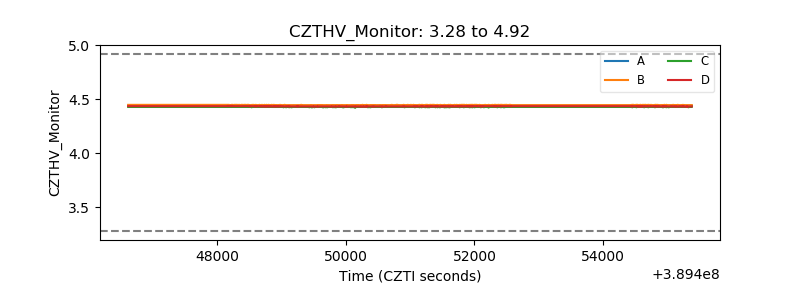 |
| D_VDD | 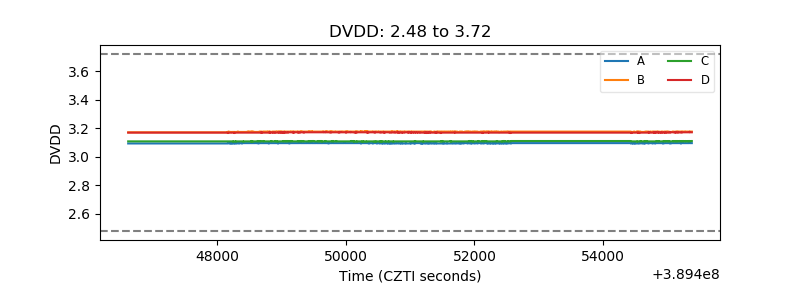 |
| Temperature 1 | 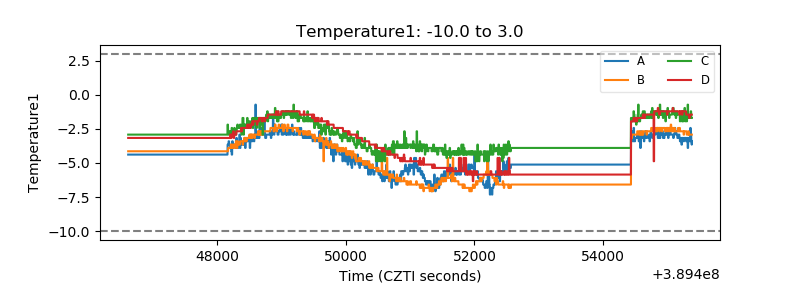 |
| Veto HV Monitor | 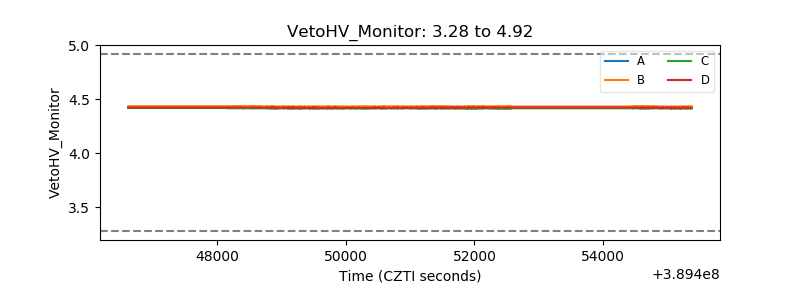 |
| Veto LLD | 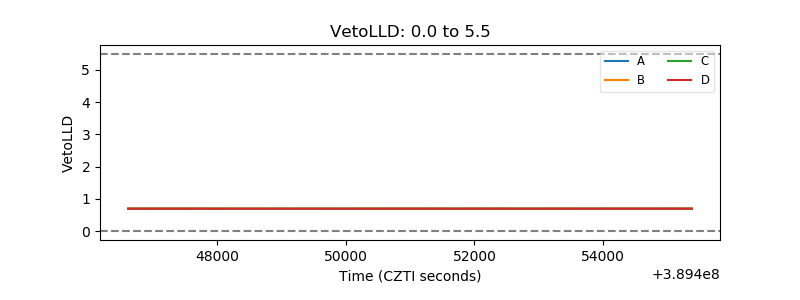 |
| Alpha Counter | 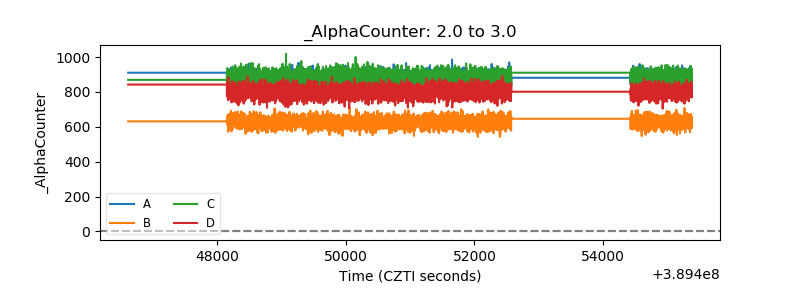 |
| _CPM_Rate | 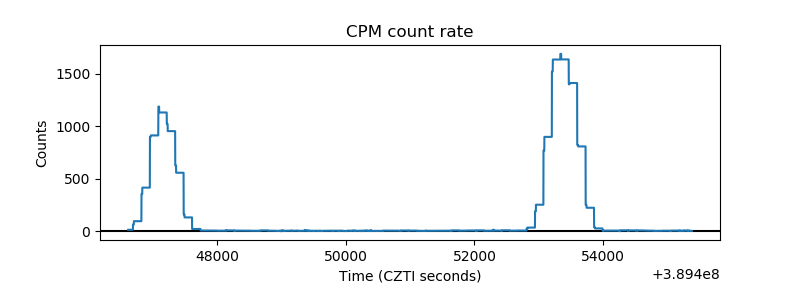 |
| CZT Counter | 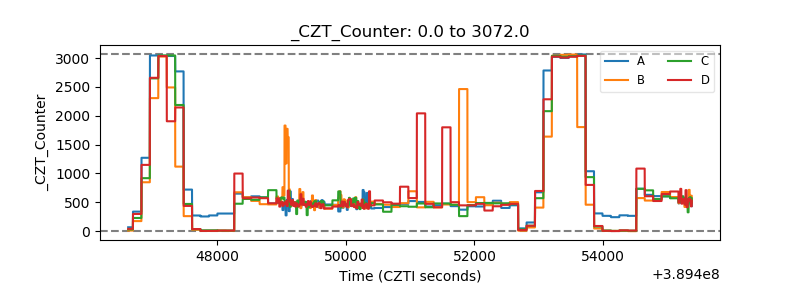 |
| +2.5 Volts monitor | 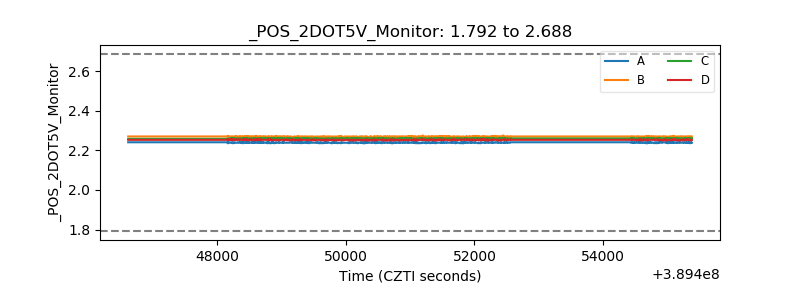 |
| +5 Volts monitor | 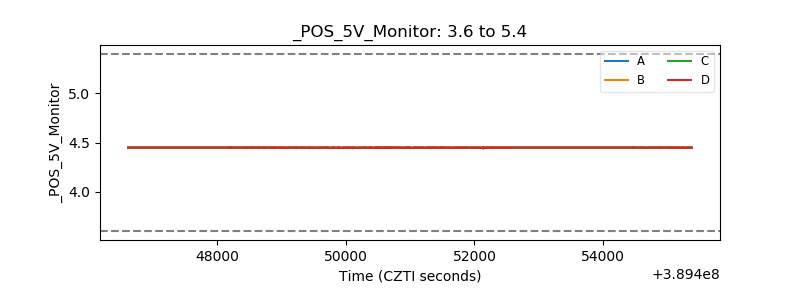 |
| _ROLL_ROT | 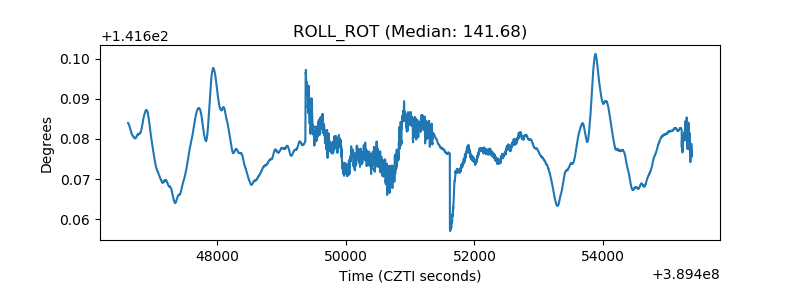 |
| _Roll_DEC | 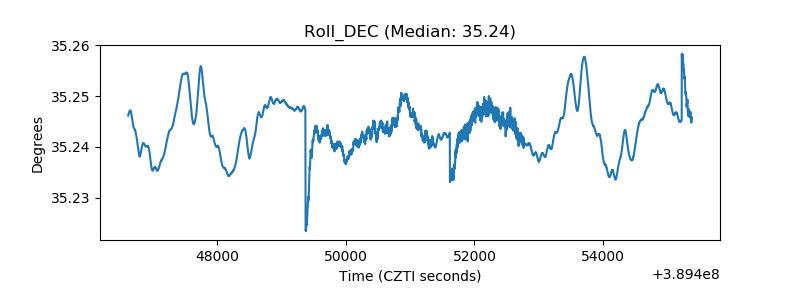 |
| _Roll_RA | 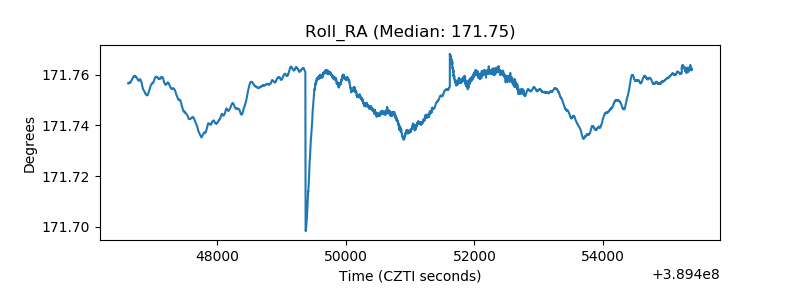 |
| Veto Counter | 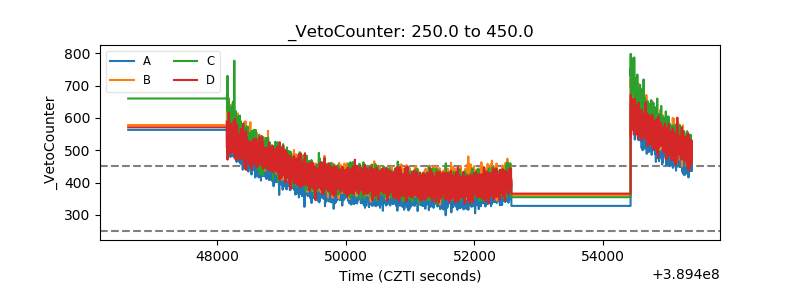 |