| Param | Original file | Final file |
|---|---|---|
| Filename | modeM0/AS1A09_142T02_9000005112_35693cztM0_level2.evt | modeM0/AS1A09_142T02_9000005112_35693cztM0_level2_quad_clean.evt |
| Size (bytes) | 166,155,840 | 33,684,480 |
| Size | 158.5 MB | 32.1 MB |
| Events in quadrant A | 1,116,063 | 220,589 |
| Events in quadrant B | 1,341,841 | 219,560 |
| Events in quadrant C | 1,174,014 | 216,768 |
| Events in quadrant D | 1,252,339 | 207,716 |
| Mode SS | |||
|---|---|---|---|
| Quadrant | BADHDUFLAG | Total packets | Discarded packets |
| A | 0 | 44 | 0 |
| B | 0 | 44 | 0 |
| C | 0 | 44 | 0 |
| D | 0 | 44 | 0 |
| Mode M0 | |||
|---|---|---|---|
| Quadrant | BADHDUFLAG | Total packets | Discarded packets |
| A | 0 | 4620 | 2 |
| B | 0 | 5289 | 1 |
| C | 0 | 4704 | 1 |
| D | 0 | 5090 | 1 |
| Mode M9 | |||
|---|---|---|---|
| Quadrant | BADHDUFLAG | Total packets | Discarded packets |
| A | 0 | 17 | 0 |
| B | 0 | 17 | 0 |
| C | 0 | 17 | 0 |
| D | 0 | 17 | 0 |
| Quadrant | Total seconds | Saturated seconds | Saturation percentage |
|---|---|---|---|
| A | 2143 | 4 | 0.186654% |
| B | 2143 | 65 | 3.033131% |
| C | 2143 | 27 | 1.259916% |
| D | 2143 | 51 | 2.379841% |
Noise dominated data is calculated using 1-second bins in cleaned event files. If a bin has >2000 counts, and if more than 50% of those come from <1% of pixels, then it is considered to be noise-dominated and hence unusable.
| Quadrant | # 1 sec bins | Bins with >0 counts | Bins with >2000 counts | High rate bins dominated by noise | Noise dominated (total time) | Noise dominated (detector-on time) | Marked lightcurve |
|---|---|---|---|---|---|---|---|
| A | 3875 | 2144 | 0 | 0 | 0.00% | 0.00% | 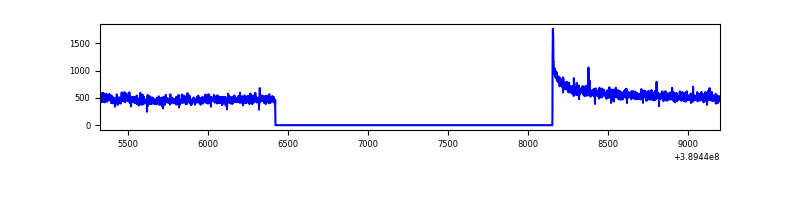 |
| B | 3875 | 2144 | 47 | 47 | 1.21% | 2.19% | 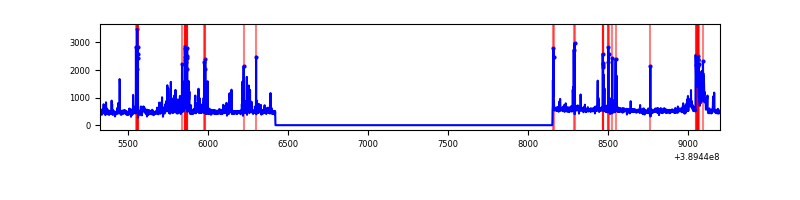 |
| C | 3875 | 2144 | 21 | 21 | 0.54% | 0.98% | 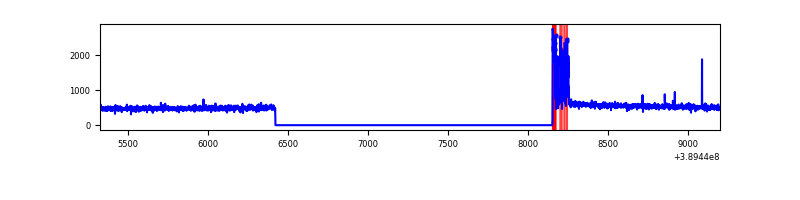 |
| D | 3875 | 2144 | 36 | 36 | 0.93% | 1.68% | 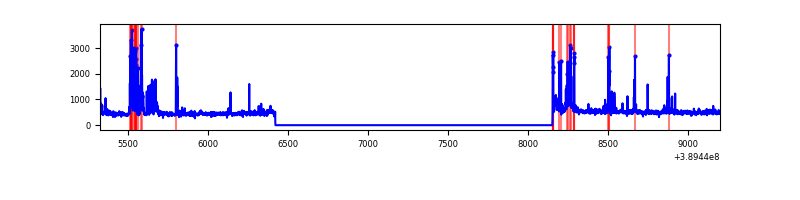 |
Top three noisy pixels from each quadrant. If the there are fewer than three noisy pixels in the level2.evt file, extra rows are filled as -1
| Pixel properties | Quadrant properties | ||||||
|---|---|---|---|---|---|---|---|
| Quadrant | DetID | PixID | Counts | Sigma | Mean | Median | Sigma |
| A | 10 | 83 | 66972 | 1201.54 | 266 | 260 | 55.5 |
| A | 15 | 169 | 12241 | 215.79 | 266 | 260 | 55.5 |
| A | 13 | 6 | 7157 | 124.22 | 266 | 260 | 55.5 |
| B | 5 | 255 | 180880 | 3506.28 | 259 | 252 | 51.5 |
| B | 5 | 172 | 125657 | 2434.31 | 259 | 252 | 51.5 |
| B | 0 | 189 | 6651 | 124.21 | 259 | 252 | 51.5 |
| C | 15 | 214 | 90467 | 1492.25 | 255 | 256 | 60.5 |
| C | 0 | 10 | 86785 | 1431.35 | 255 | 256 | 60.5 |
| C | 1 | 241 | 1998 | 28.82 | 255 | 256 | 60.5 |
| D | 2 | 250 | 127158 | 2016.96 | 254 | 247 | 62.9 |
| D | 13 | 249 | 81112 | 1285.17 | 254 | 247 | 62.9 |
| D | 2 | 153 | 19699 | 309.15 | 254 | 247 | 62.9 |
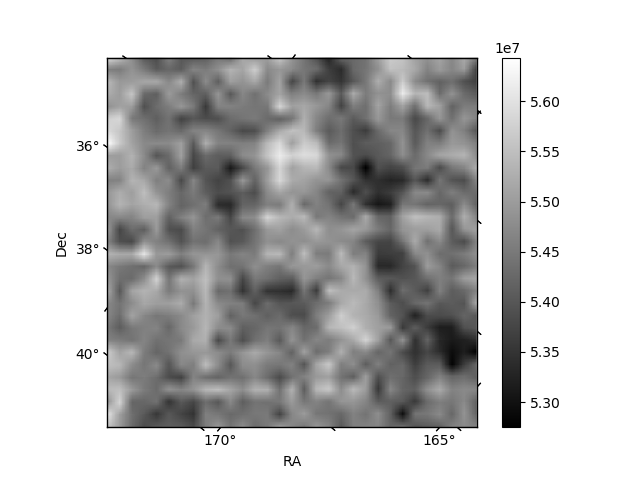
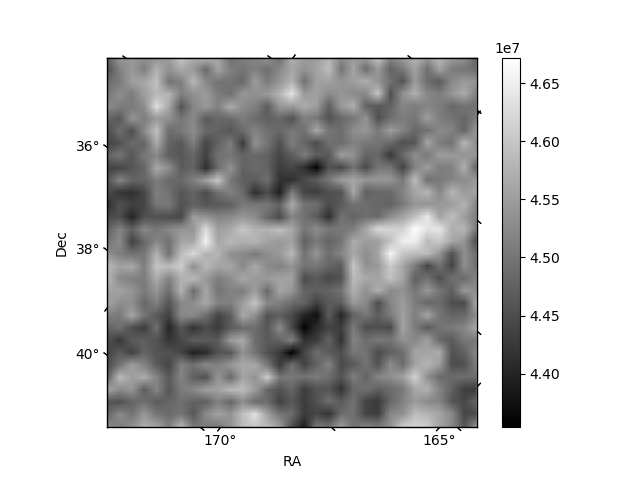
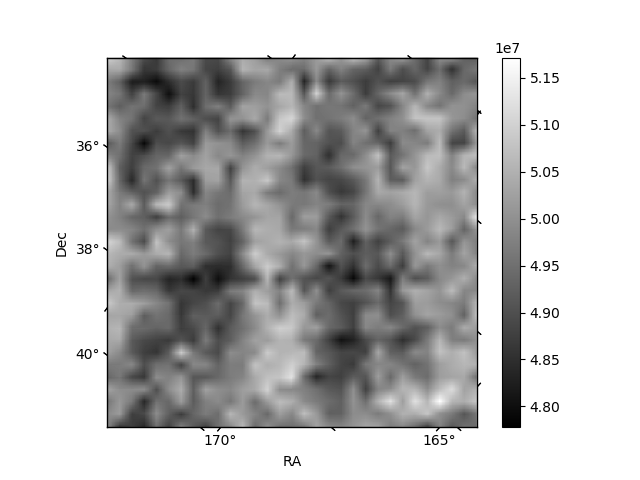
Histogram calculated using DETX and DETY for each event in the final _common_clean file
| Quadrant A | 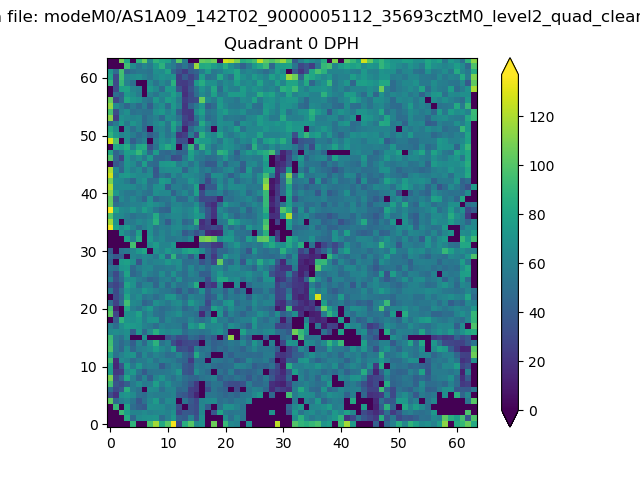 |
 |
Quadrant B |
|---|---|---|---|
| Quadrant D | 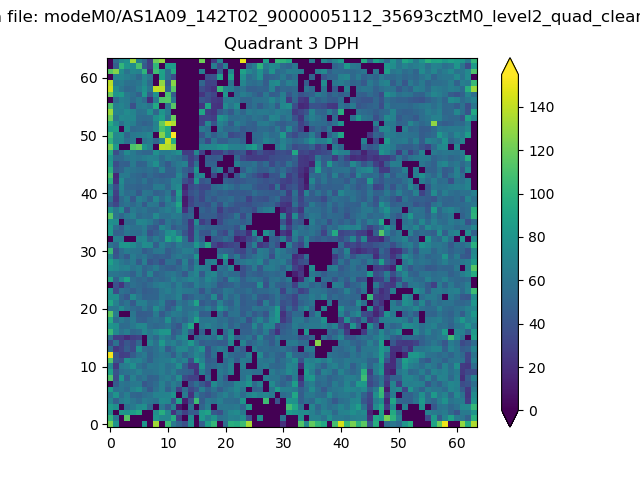 |
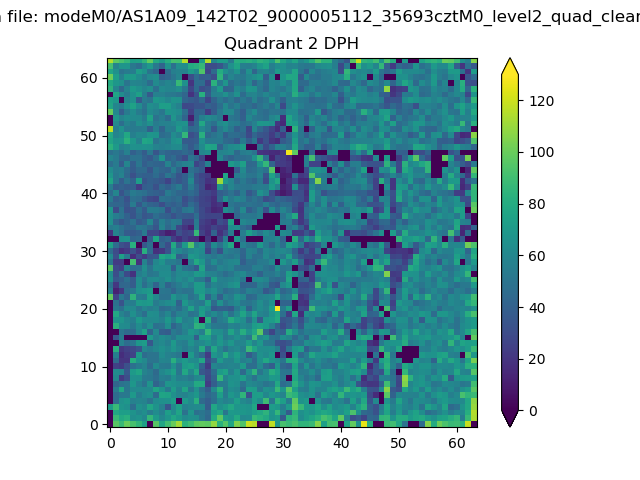 |
Quadrant C |
| Plot type | Count rate plots | Images |
|---|---|---|
| Comparison with Poisson distribution Blue bars denote a histogram of data divided into 1 sec bins. Red curve is a Poisson curve with rate = median count rate of data. |
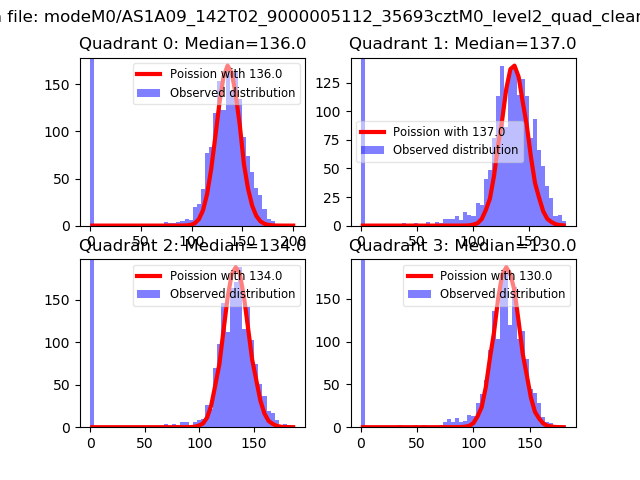 |
 |
| Quadrant-wise count rates Data is divided into 100 sec bins |
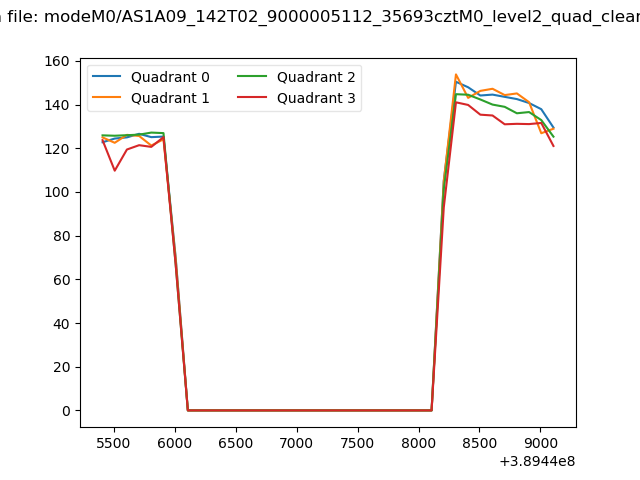 |
|
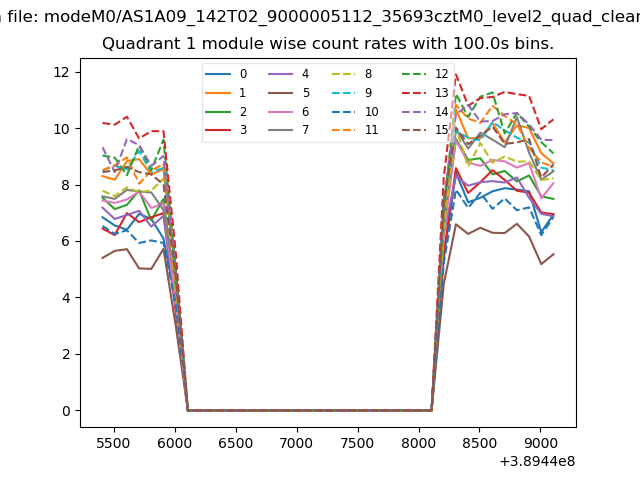
| Module-wise count rates for Quadrant A Data is divided into 100 sec bins |
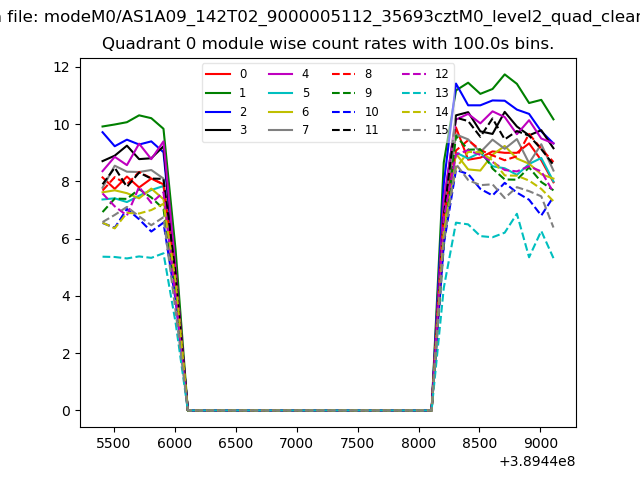 |
 |
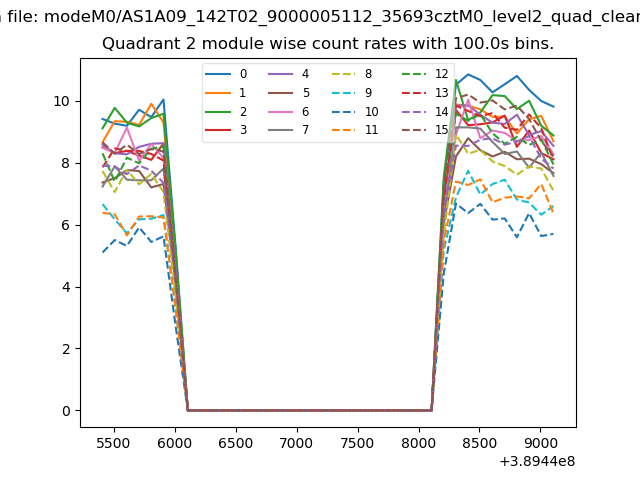
| Module-wise count rates for Quadrant B Data is divided into 100 sec bins |
 |
 |
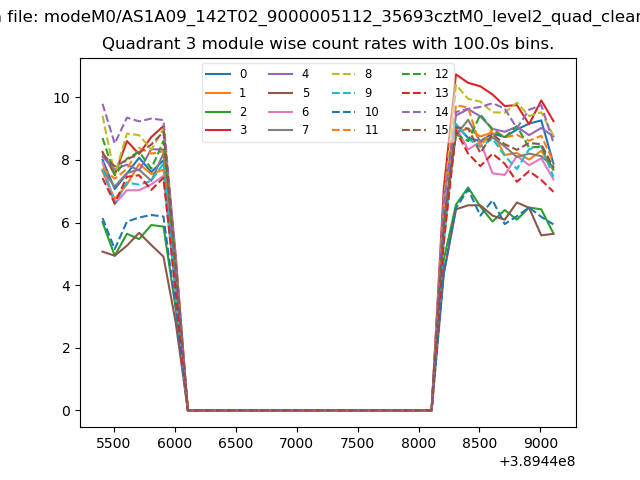
| Module-wise count rates for Quadrant C Data is divided into 100 sec bins |
 |
 |
| Module-wise count rates for Quadrant D Data is divided into 100 sec bins |
 |
 |
| Parameter | Plot |
|---|---|
| CZT HV Monitor |  |
| D_VDD | 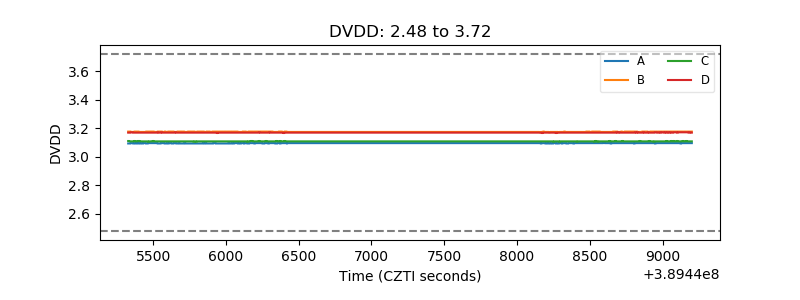 |
| Temperature 1 | 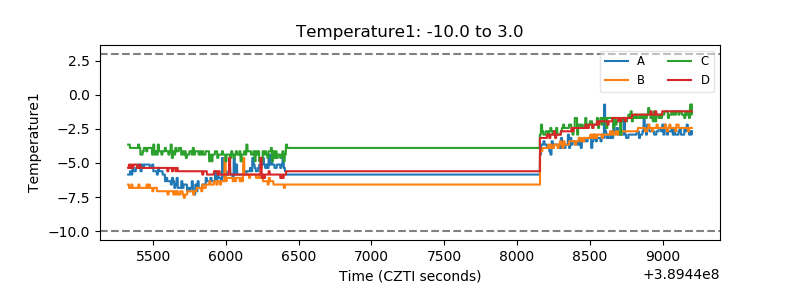 |
| Veto HV Monitor | 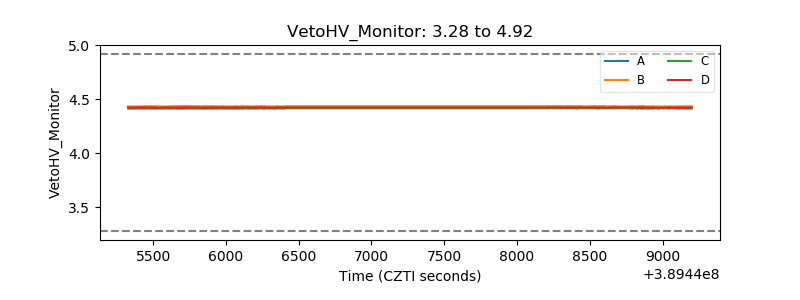 |
| Veto LLD | 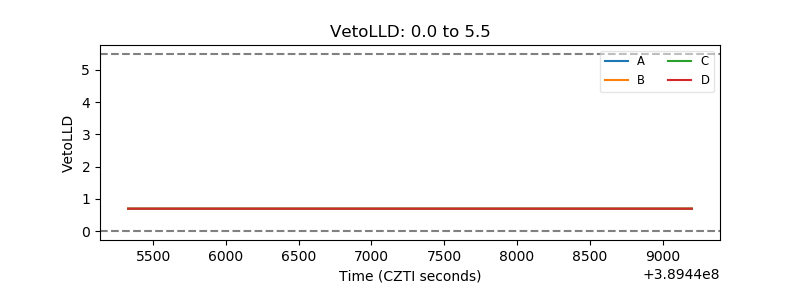 |
| Alpha Counter | 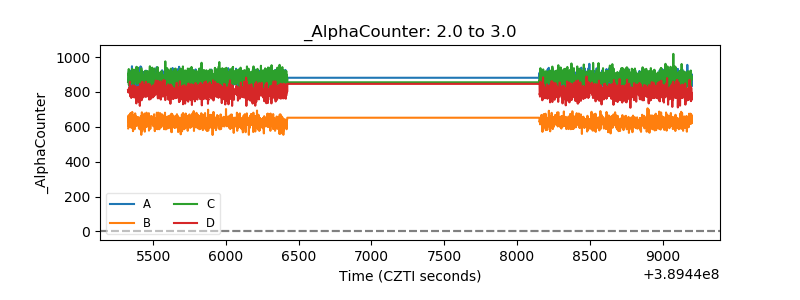 |
| _CPM_Rate | 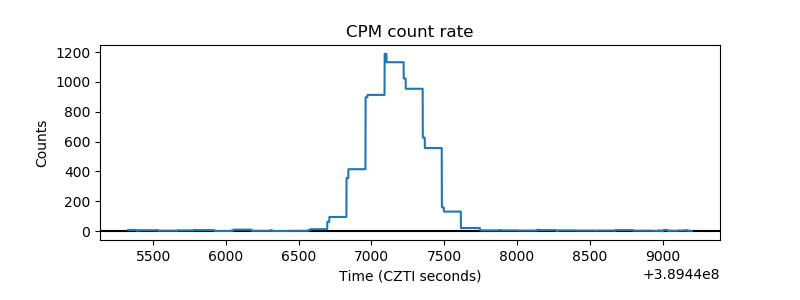 |
| CZT Counter | 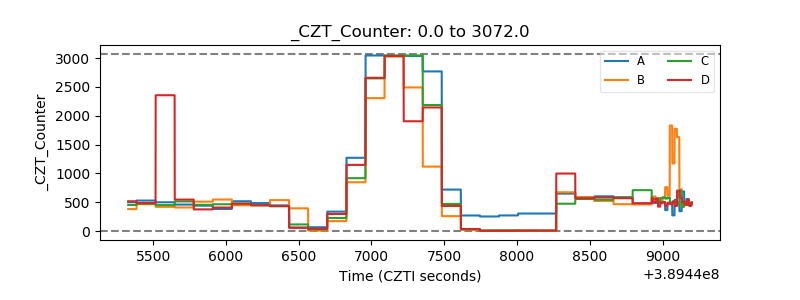 |
| +2.5 Volts monitor | 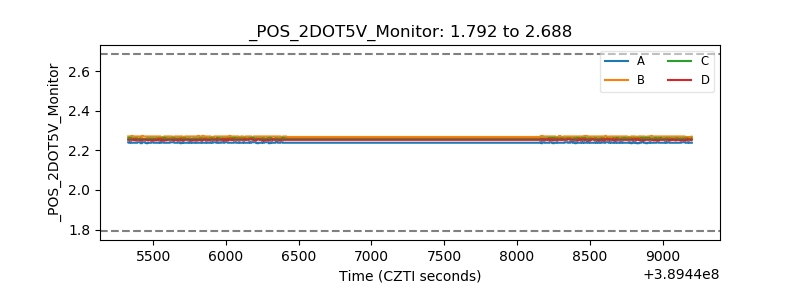 |
| +5 Volts monitor | 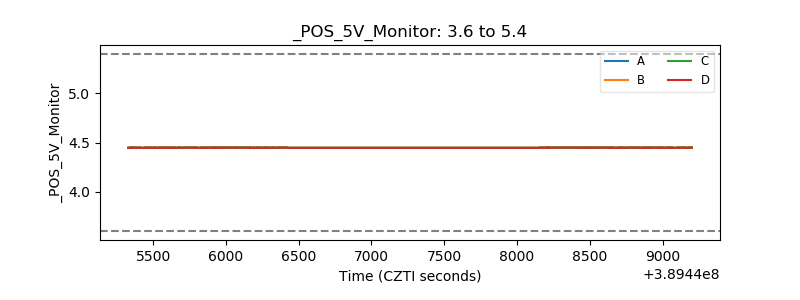 |
| _ROLL_ROT | 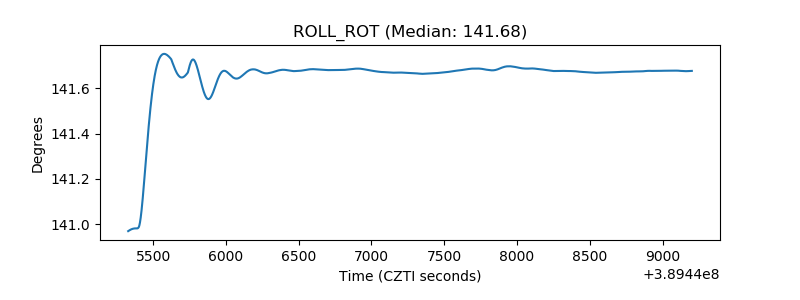 |
| _Roll_DEC | 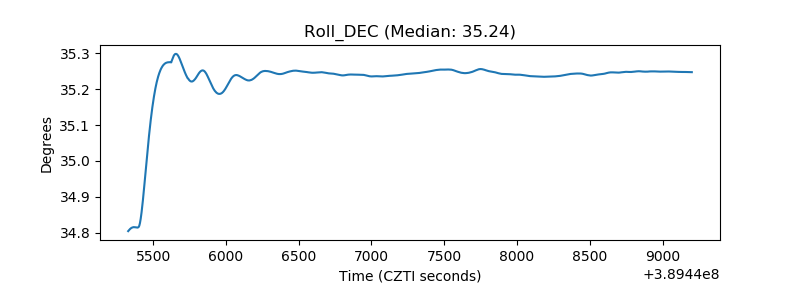 |
| _Roll_RA | 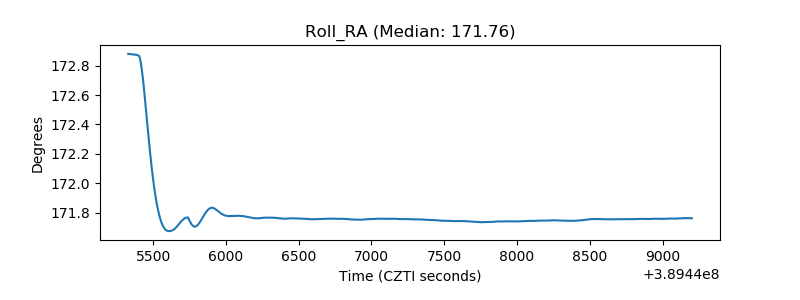 |
| Veto Counter | 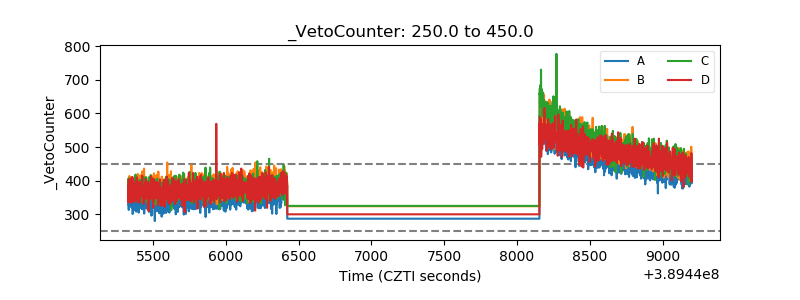 |