| Param | Original file | Final file |
|---|---|---|
| Filename | modeM0/AS1A09_029T04_9000005110_35693cztM0_level2.evt | modeM0/AS1A09_029T04_9000005110_35693cztM0_level2_quad_clean.evt |
| Size (bytes) | 185,224,320 | 46,630,080 |
| Size | 176.6 MB | 44.5 MB |
| Events in quadrant A | 1,315,882 | 312,612 |
| Events in quadrant B | 1,292,004 | 316,229 |
| Events in quadrant C | 1,246,825 | 310,744 |
| Events in quadrant D | 1,585,015 | 294,887 |
| Mode M9 | |||
|---|---|---|---|
| Quadrant | BADHDUFLAG | Total packets | Discarded packets |
| A | 0 | 11 | 0 |
| B | 0 | 11 | 0 |
| C | 0 | 11 | 0 |
| D | 0 | 12 | 0 |
| Mode SS | |||
|---|---|---|---|
| Quadrant | BADHDUFLAG | Total packets | Discarded packets |
| A | 0 | 50 | 0 |
| B | 0 | 50 | 0 |
| C | 0 | 50 | 0 |
| D | 0 | 50 | 0 |
| Mode M0 | |||
|---|---|---|---|
| Quadrant | BADHDUFLAG | Total packets | Discarded packets |
| A | 0 | 5444 | 1 |
| B | 0 | 5457 | 1 |
| C | 0 | 5274 | 1 |
| D | 0 | 6385 | 1 |
| Quadrant | Total seconds | Saturated seconds | Saturation percentage |
|---|---|---|---|
| A | 2465 | 6 | 0.243408% |
| B | 2465 | 37 | 1.501014% |
| C | 2465 | 20 | 0.811359% |
| D | 2465 | 84 | 3.407708% |
Noise dominated data is calculated using 1-second bins in cleaned event files. If a bin has >2000 counts, and if more than 50% of those come from <1% of pixels, then it is considered to be noise-dominated and hence unusable.
| Quadrant | # 1 sec bins | Bins with >0 counts | Bins with >2000 counts | High rate bins dominated by noise | Noise dominated (total time) | Noise dominated (detector-on time) | Marked lightcurve |
|---|---|---|---|---|---|---|---|
| A | 2465 | 2465 | 0 | 0 | 0.00% | 0.00% | 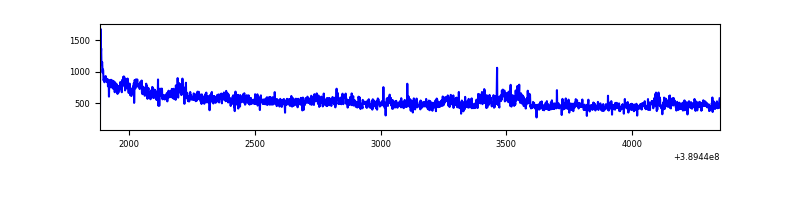 |
| B | 2465 | 2465 | 30 | 30 | 1.22% | 1.22% | 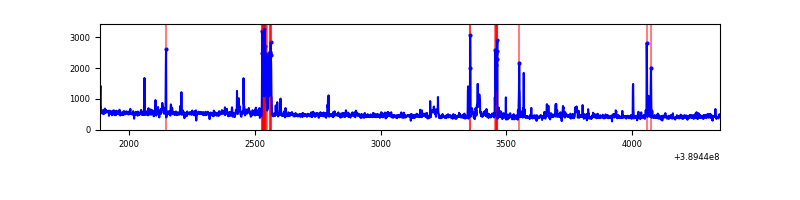 |
| C | 2465 | 2465 | 14 | 14 | 0.57% | 0.57% | 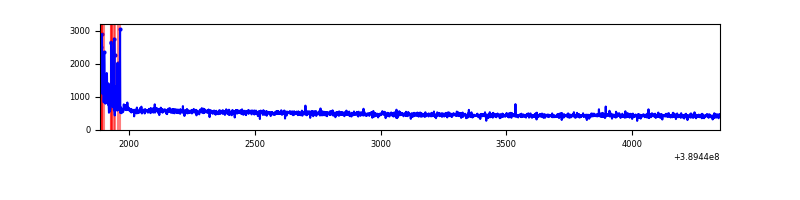 |
| D | 2465 | 2465 | 64 | 64 | 2.60% | 2.60% | 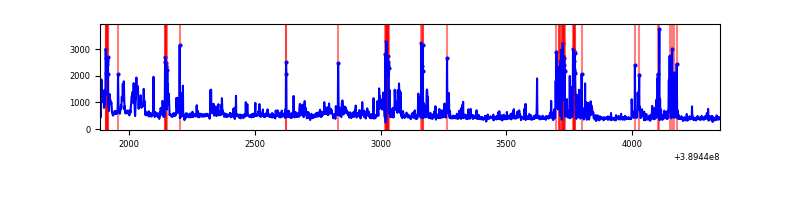 |
Top three noisy pixels from each quadrant. If the there are fewer than three noisy pixels in the level2.evt file, extra rows are filled as -1
| Pixel properties | Quadrant properties | ||||||
|---|---|---|---|---|---|---|---|
| Quadrant | DetID | PixID | Counts | Sigma | Mean | Median | Sigma |
| A | 15 | 169 | 109370 | 1795.21 | 290 | 284 | 60.8 |
| A | 10 | 83 | 72423 | 1187.18 | 290 | 284 | 60.8 |
| A | 13 | 6 | 9470 | 151.17 | 290 | 284 | 60.8 |
| B | 5 | 172 | 100552 | 1795.34 | 282 | 275 | 55.9 |
| B | 5 | 255 | 45497 | 809.65 | 282 | 275 | 55.9 |
| B | 15 | 85 | 15961 | 280.84 | 282 | 275 | 55.9 |
| C | 15 | 214 | 105504 | 1616.74 | 275 | 276 | 65.1 |
| C | 0 | 10 | 62912 | 962.35 | 275 | 276 | 65.1 |
| C | 4 | 254 | 4586 | 66.22 | 275 | 276 | 65.1 |
| D | 2 | 250 | 246169 | 3546.42 | 278 | 269 | 69.3 |
| D | 13 | 249 | 136077 | 1958.65 | 278 | 269 | 69.3 |
| D | 10 | 118 | 93062 | 1338.28 | 278 | 269 | 69.3 |
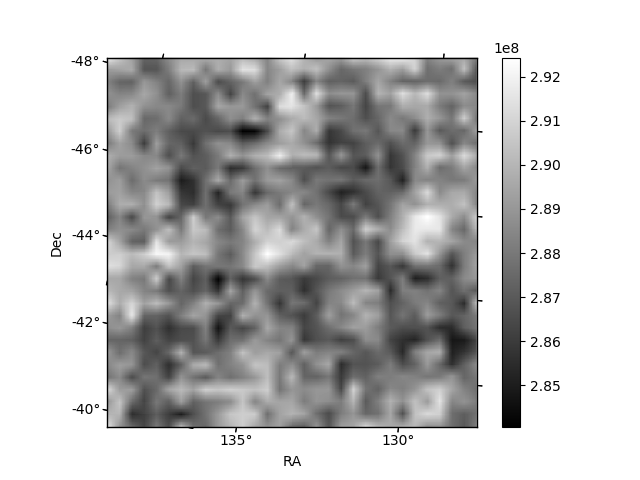
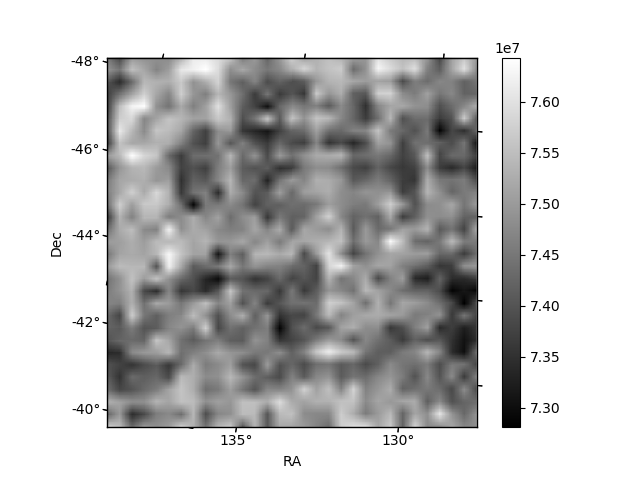
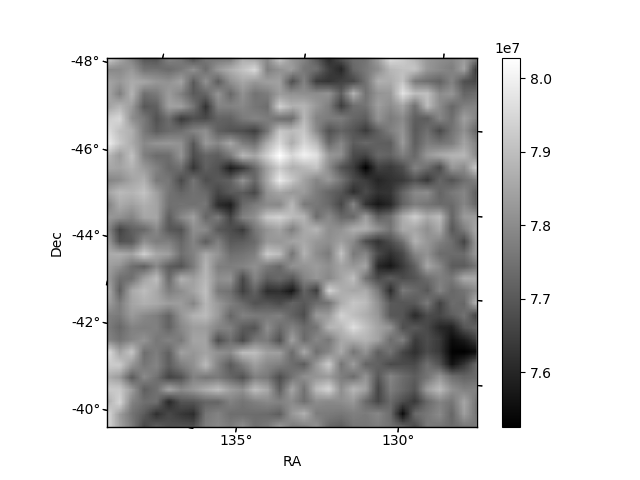
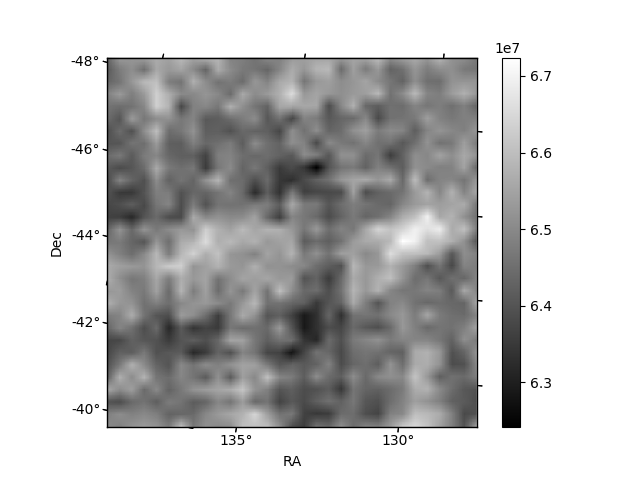
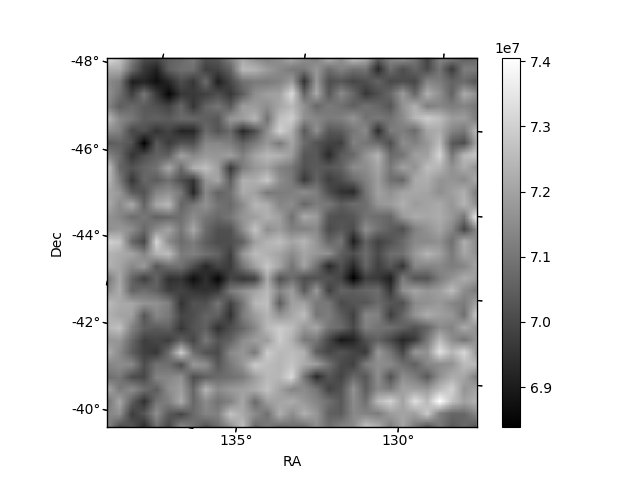
Histogram calculated using DETX and DETY for each event in the final _common_clean file
| Quadrant A | 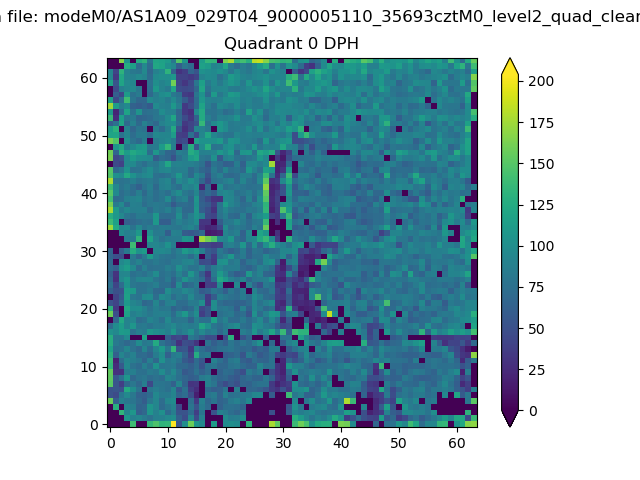 |
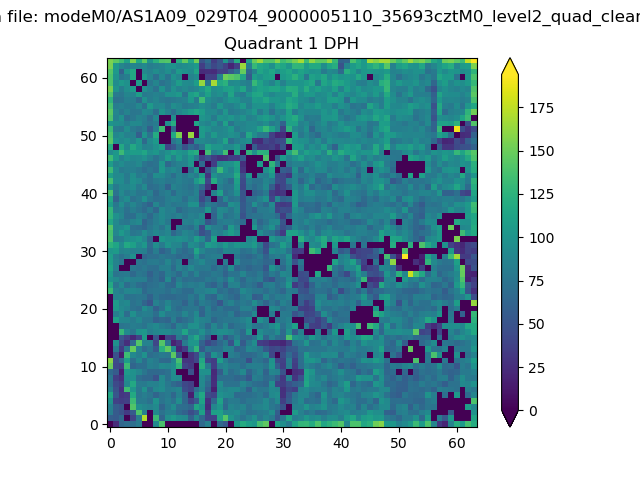 |
Quadrant B |
|---|---|---|---|
| Quadrant D | 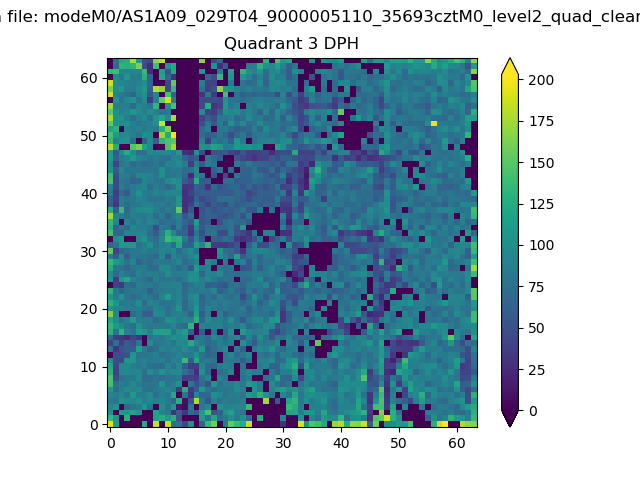 |
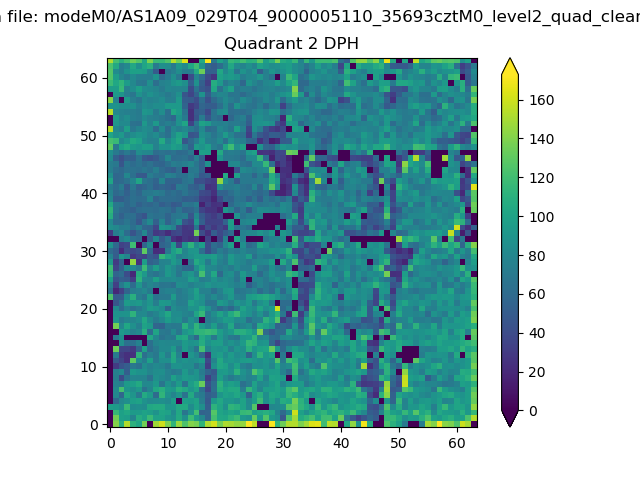 |
Quadrant C |
| Plot type | Count rate plots | Images |
|---|---|---|
| Comparison with Poisson distribution Blue bars denote a histogram of data divided into 1 sec bins. Red curve is a Poisson curve with rate = median count rate of data. |
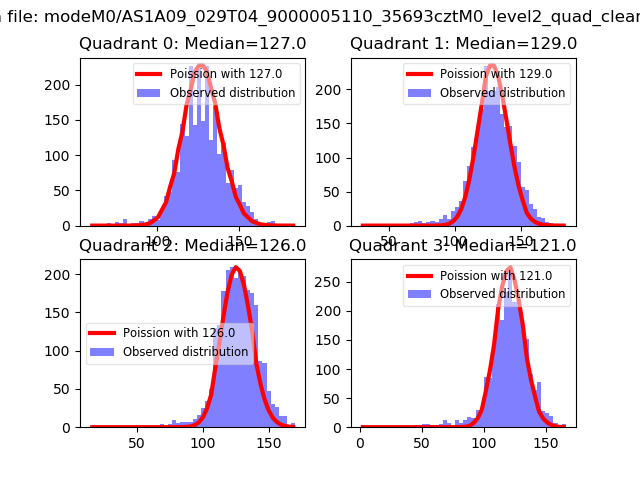 |
 |
| Quadrant-wise count rates Data is divided into 100 sec bins |
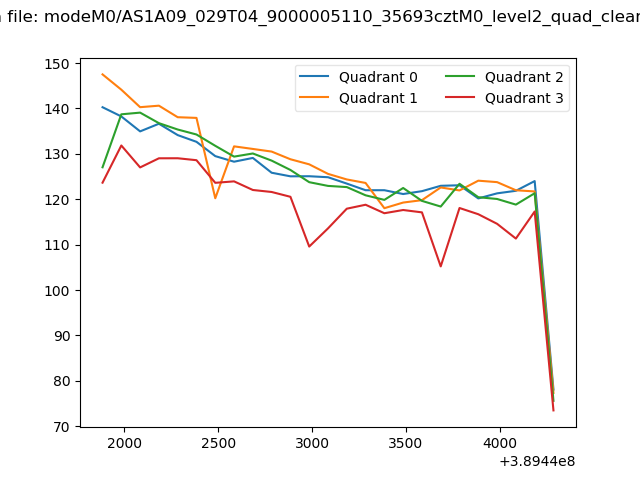 |
|
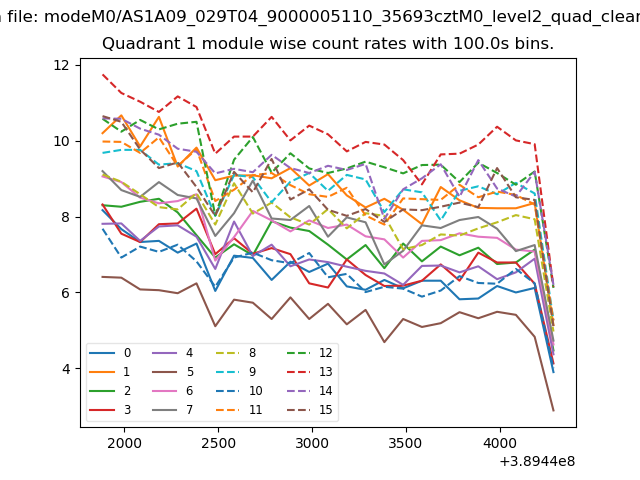
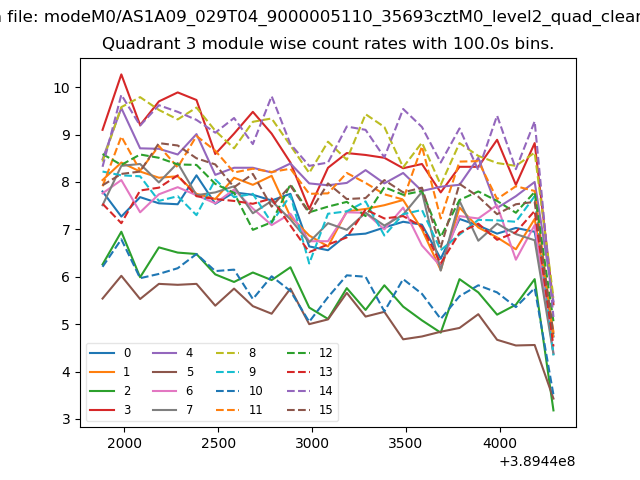
| Module-wise count rates for Quadrant A Data is divided into 100 sec bins |
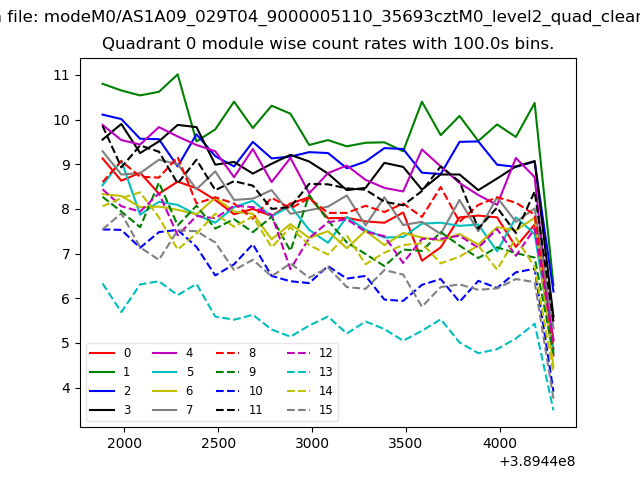 |
 |
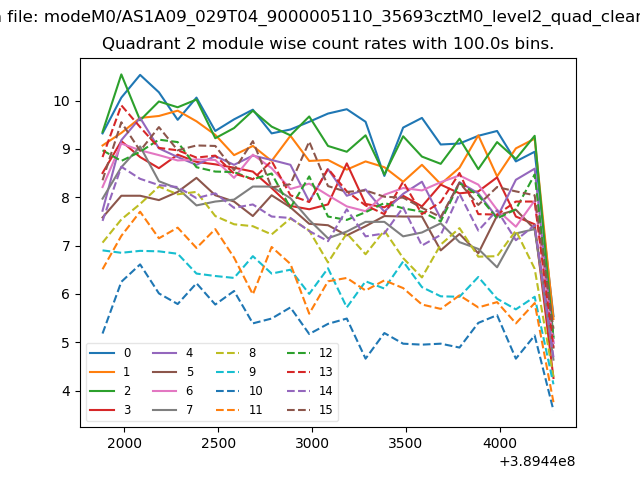
| Module-wise count rates for Quadrant B Data is divided into 100 sec bins |
 |
 |
| Module-wise count rates for Quadrant C Data is divided into 100 sec bins |
 |
 |
| Module-wise count rates for Quadrant D Data is divided into 100 sec bins |
 |
 |
| Parameter | Plot |
|---|---|
| CZT HV Monitor | 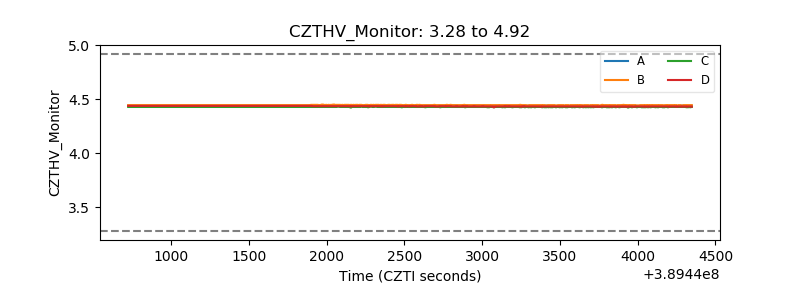 |
| D_VDD | 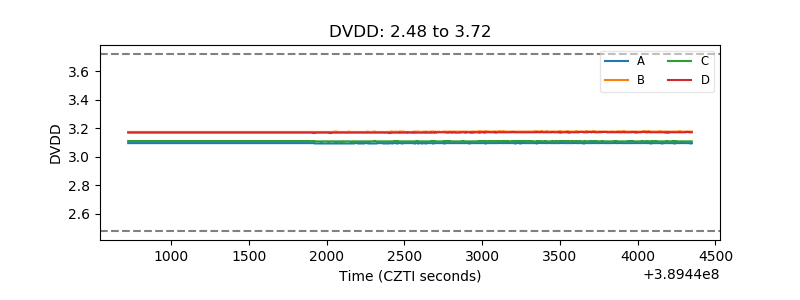 |
| Temperature 1 | 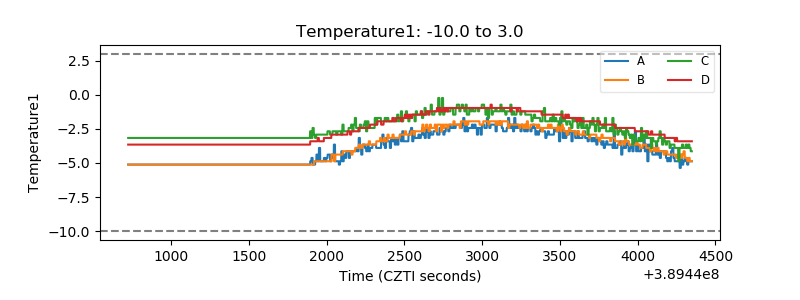 |
| Veto HV Monitor |  |
| Veto LLD | 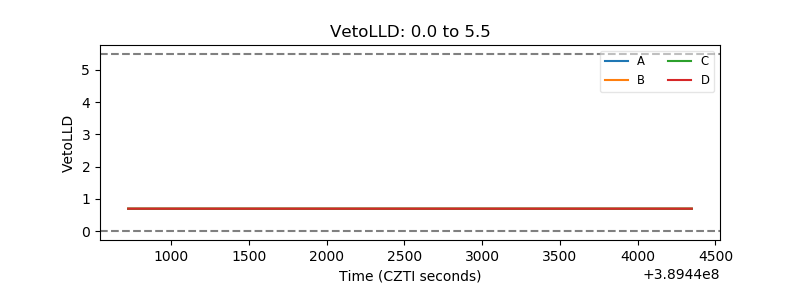 |
| Alpha Counter | 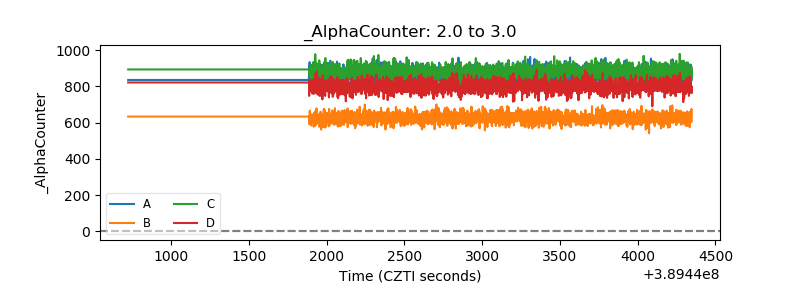 |
| _CPM_Rate | 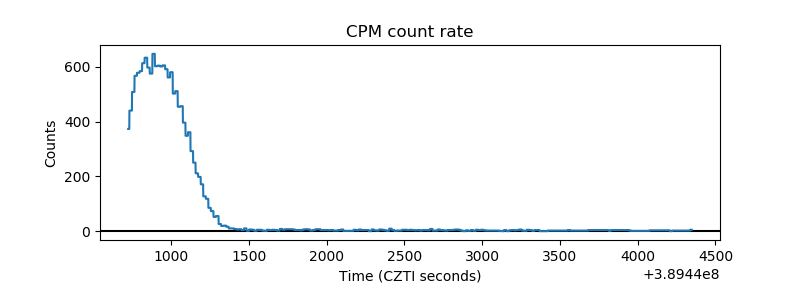 |
| CZT Counter | 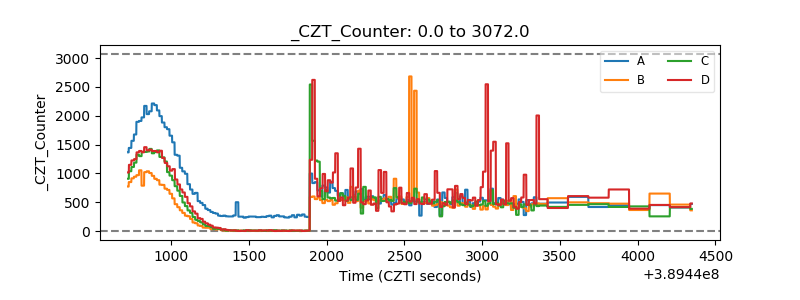 |
| +2.5 Volts monitor | 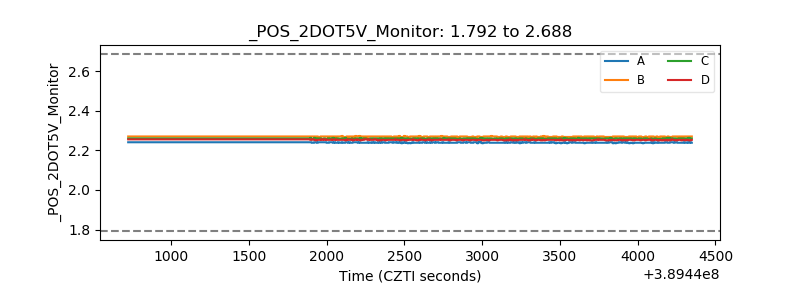 |
| +5 Volts monitor | 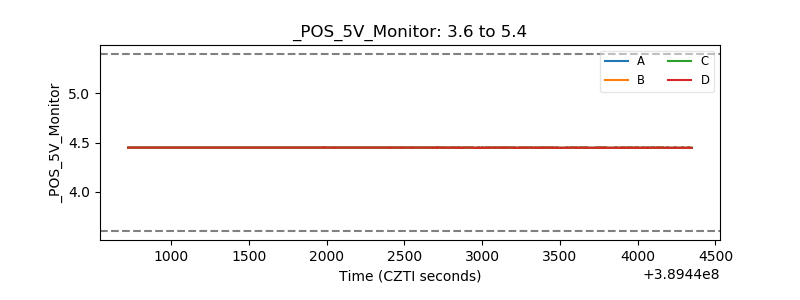 |
| _ROLL_ROT | 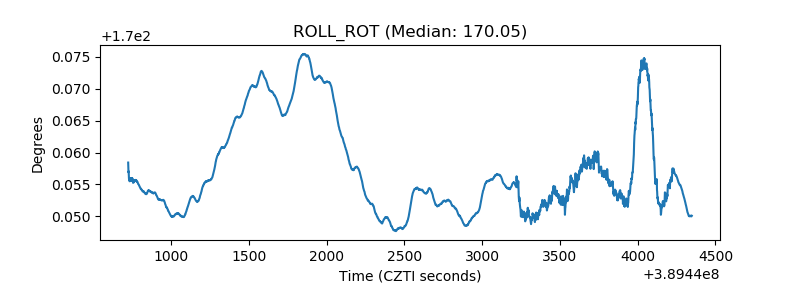 |
| _Roll_DEC | 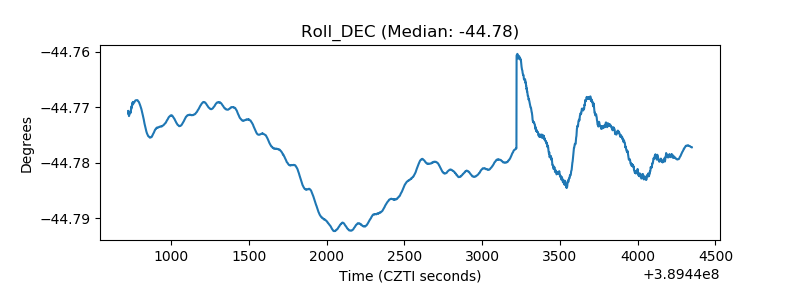 |
| _Roll_RA | 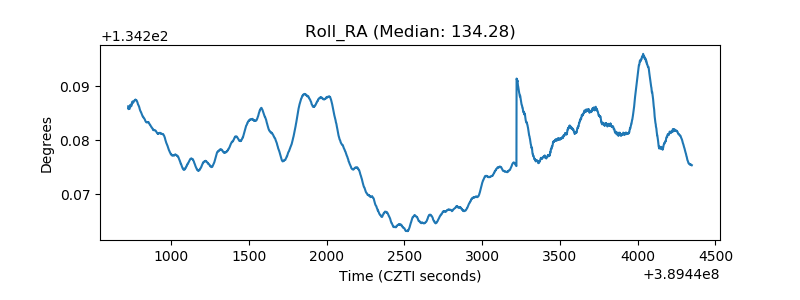 |
| Veto Counter | 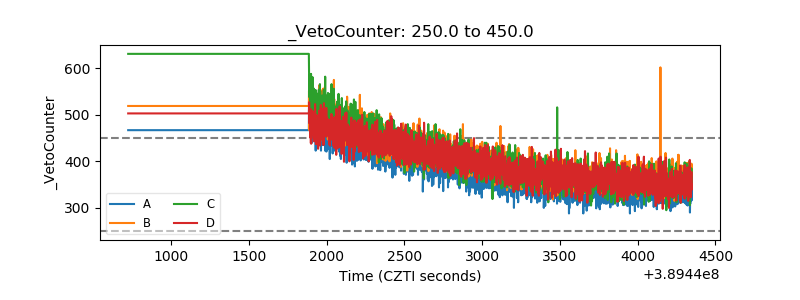 |