| Param | Original file | Final file |
|---|---|---|
| Filename | modeM0/AS1A09_029T04_9000005110_35691cztM0_level2.evt | modeM0/AS1A09_029T04_9000005110_35691cztM0_level2_quad_clean.evt |
| Size (bytes) | 415,972,800 | 90,028,800 |
| Size | 396.7 MB | 85.9 MB |
| Events in quadrant A | 2,870,950 | 591,626 |
| Events in quadrant B | 3,276,534 | 596,192 |
| Events in quadrant C | 2,806,444 | 588,995 |
| Events in quadrant D | 3,267,003 | 561,827 |
| Mode M9 | |||
|---|---|---|---|
| Quadrant | BADHDUFLAG | Total packets | Discarded packets |
| A | 0 | 21 | 0 |
| B | 0 | 21 | 0 |
| C | 0 | 21 | 0 |
| D | 0 | 22 | 0 |
| Mode SS | |||
|---|---|---|---|
| Quadrant | BADHDUFLAG | Total packets | Discarded packets |
| A | 0 | 112 | 0 |
| B | 0 | 112 | 0 |
| C | 0 | 112 | 0 |
| D | 0 | 112 | 0 |
| Mode M0 | |||
|---|---|---|---|
| Quadrant | BADHDUFLAG | Total packets | Discarded packets |
| A | 0 | 12002 | 3 |
| B | 0 | 13364 | 2 |
| C | 0 | 11728 | 2 |
| D | 0 | 13499 | 2 |
| Quadrant | Total seconds | Saturated seconds | Saturation percentage |
|---|---|---|---|
| A | 5544 | 13 | 0.234488% |
| B | 5544 | 245 | 4.419192% |
| C | 5544 | 35 | 0.631313% |
| D | 5544 | 104 | 1.875902% |
Noise dominated data is calculated using 1-second bins in cleaned event files. If a bin has >2000 counts, and if more than 50% of those come from <1% of pixels, then it is considered to be noise-dominated and hence unusable.
| Quadrant | # 1 sec bins | Bins with >0 counts | Bins with >2000 counts | High rate bins dominated by noise | Noise dominated (total time) | Noise dominated (detector-on time) | Marked lightcurve |
|---|---|---|---|---|---|---|---|
| A | 7157 | 5545 | 0 | 0 | 0.00% | 0.00% | 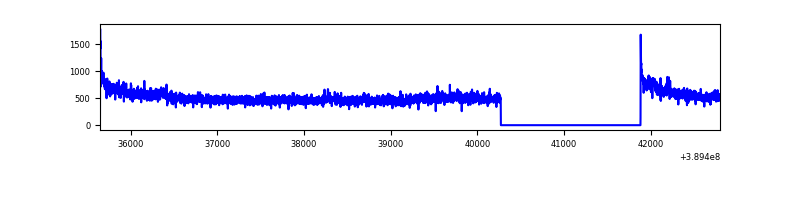 |
| B | 7157 | 5545 | 172 | 172 | 2.40% | 3.10% | 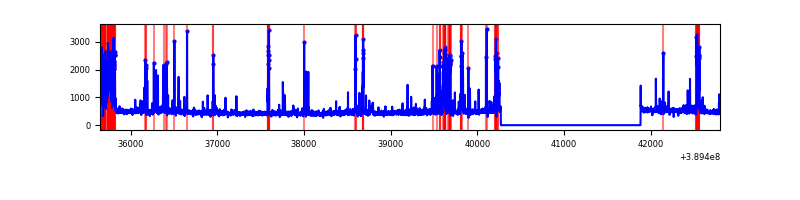 |
| C | 7157 | 5545 | 21 | 21 | 0.29% | 0.38% | 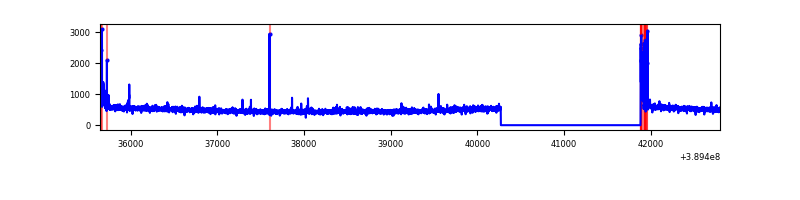 |
| D | 7157 | 5545 | 72 | 72 | 1.01% | 1.30% | 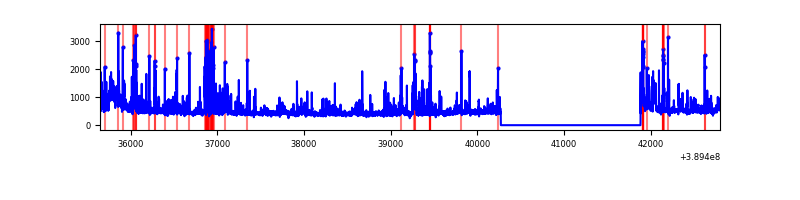 |
Top three noisy pixels from each quadrant. If the there are fewer than three noisy pixels in the level2.evt file, extra rows are filled as -1
| Pixel properties | Quadrant properties | ||||||
|---|---|---|---|---|---|---|---|
| Quadrant | DetID | PixID | Counts | Sigma | Mean | Median | Sigma |
| A | 15 | 169 | 214531 | 1623.94 | 647 | 633 | 131.7 |
| A | 10 | 83 | 146558 | 1107.88 | 647 | 633 | 131.7 |
| A | 13 | 6 | 9444 | 66.89 | 647 | 633 | 131.7 |
| B | 5 | 172 | 597612 | 4909.24 | 628 | 611 | 121.6 |
| B | 5 | 255 | 165404 | 1355.12 | 628 | 611 | 121.6 |
| B | 12 | 111 | 15353 | 121.23 | 628 | 611 | 121.6 |
| C | 15 | 214 | 236281 | 1617.05 | 623 | 628 | 145.7 |
| C | 0 | 10 | 117078 | 799.08 | 623 | 628 | 145.7 |
| C | 4 | 254 | 10967 | 70.95 | 623 | 628 | 145.7 |
| D | 2 | 250 | 411238 | 2666.18 | 624 | 607 | 154.0 |
| D | 13 | 249 | 293908 | 1904.37 | 624 | 607 | 154.0 |
| D | 10 | 118 | 75725 | 487.73 | 624 | 607 | 154.0 |
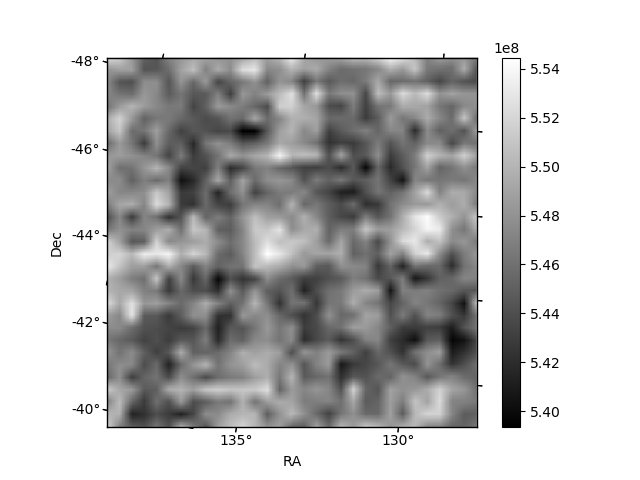
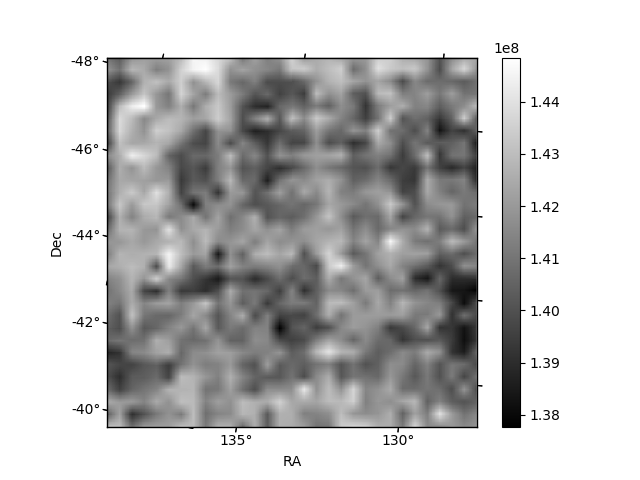
Histogram calculated using DETX and DETY for each event in the final _common_clean file
| Quadrant A | 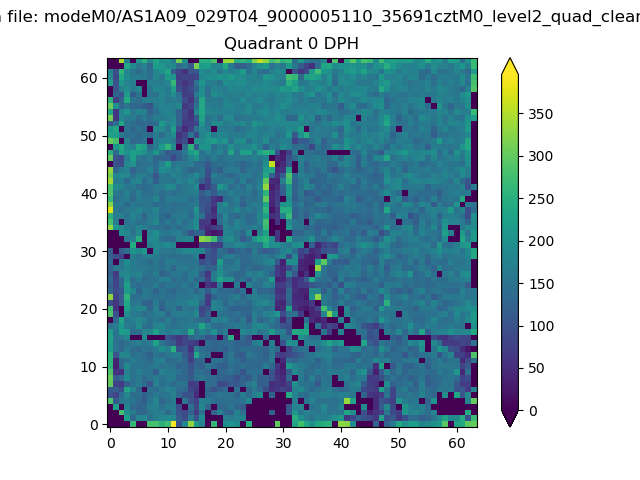 |
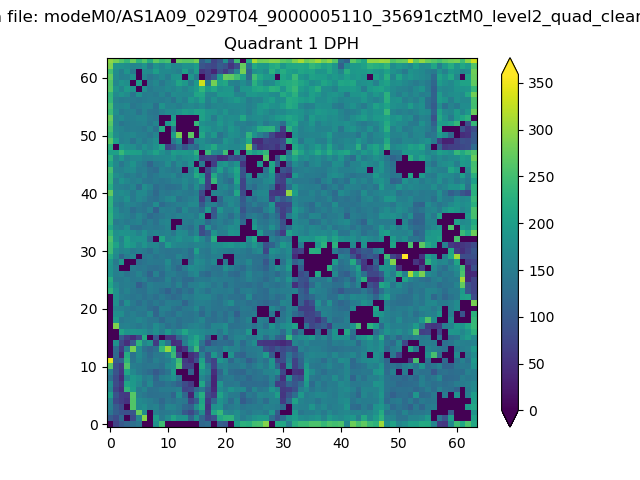 |
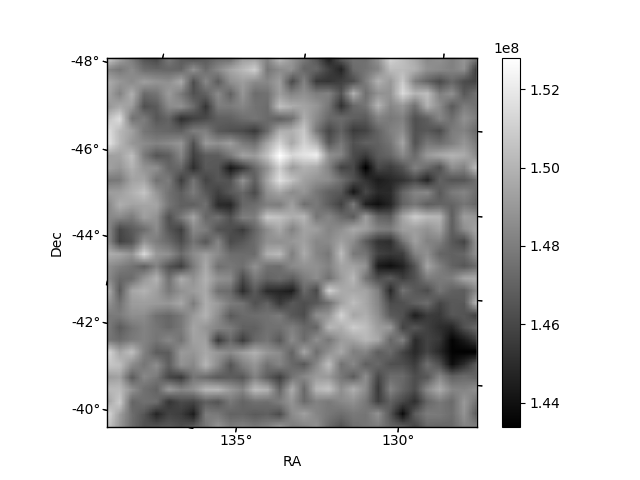
Quadrant B |
|---|---|---|---|
| Quadrant D | 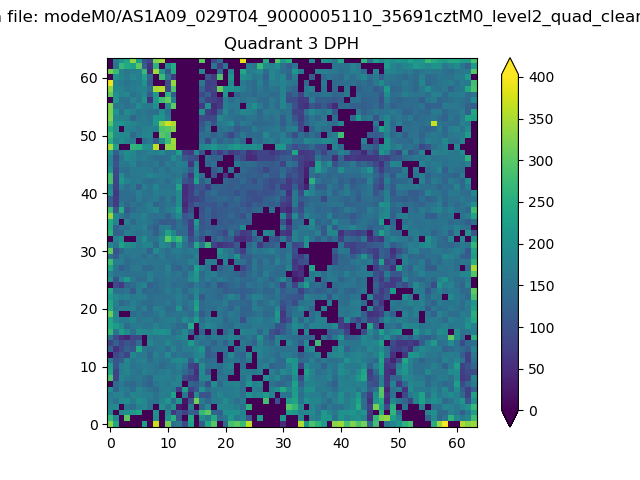 |
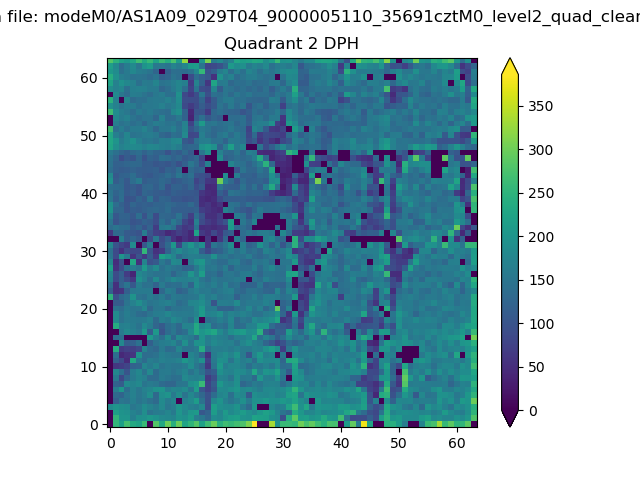 |
Quadrant C |
| Plot type | Count rate plots | Images |
|---|---|---|
| Comparison with Poisson distribution Blue bars denote a histogram of data divided into 1 sec bins. Red curve is a Poisson curve with rate = median count rate of data. |
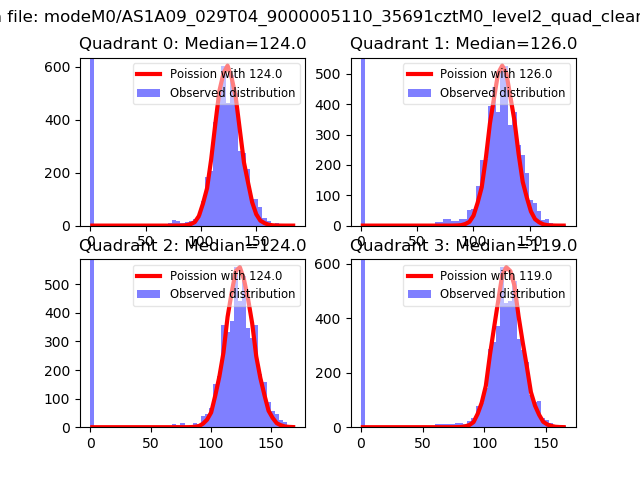 |
 |
| Quadrant-wise count rates Data is divided into 100 sec bins |
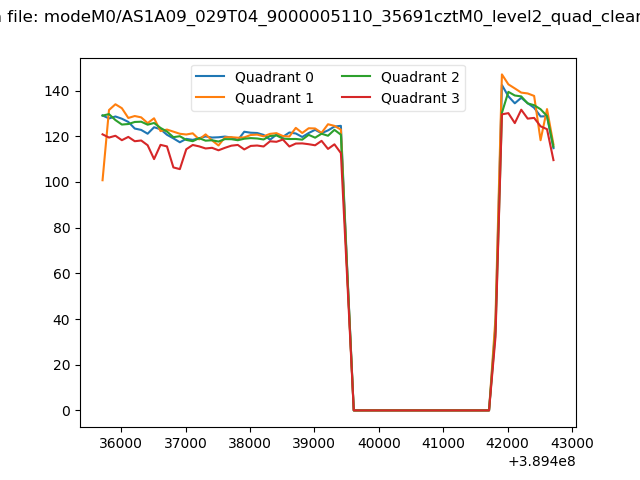 |
|
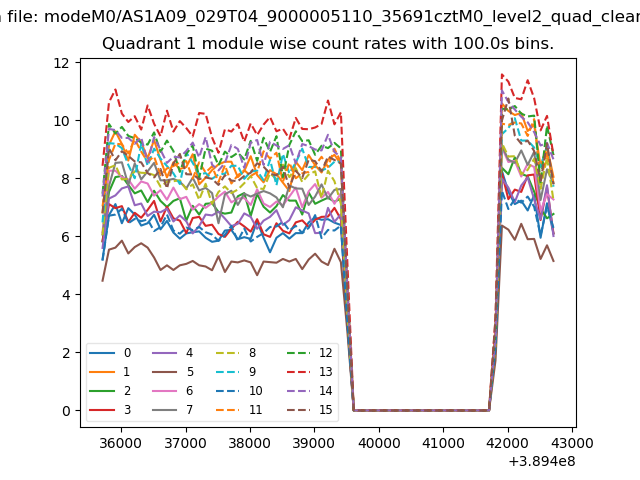
| Module-wise count rates for Quadrant A Data is divided into 100 sec bins |
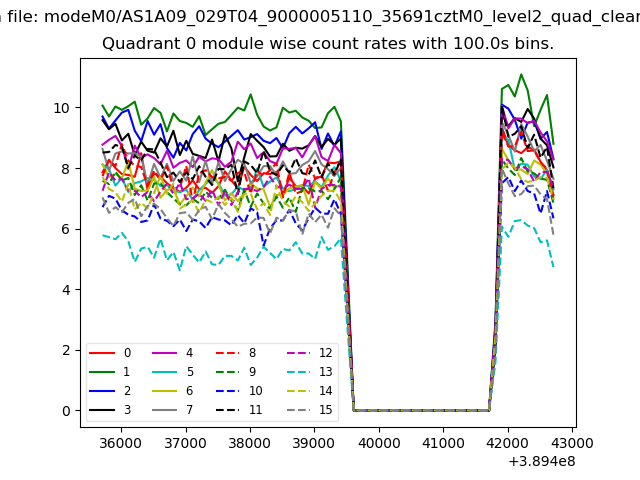 |
 |
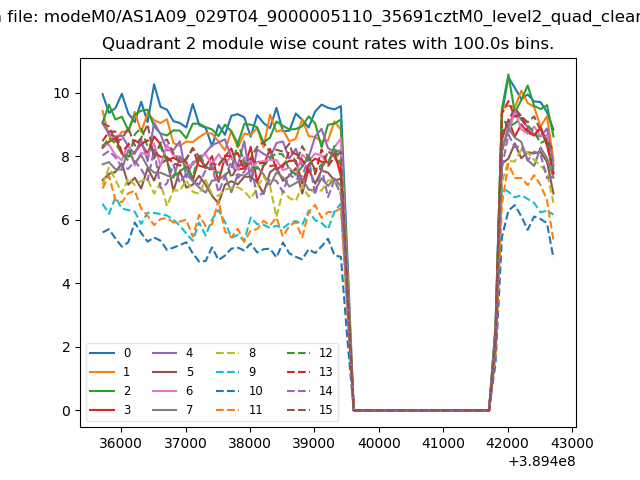
| Module-wise count rates for Quadrant B Data is divided into 100 sec bins |
 |
 |
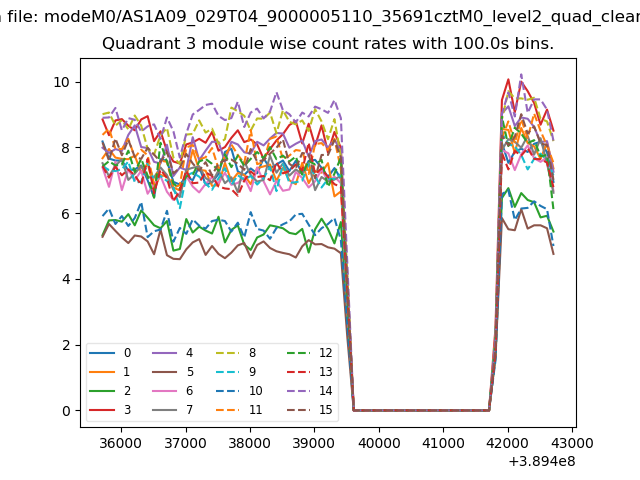
| Module-wise count rates for Quadrant C Data is divided into 100 sec bins |
 |
 |
| Module-wise count rates for Quadrant D Data is divided into 100 sec bins |
 |
 |
| Parameter | Plot |
|---|---|
| CZT HV Monitor | 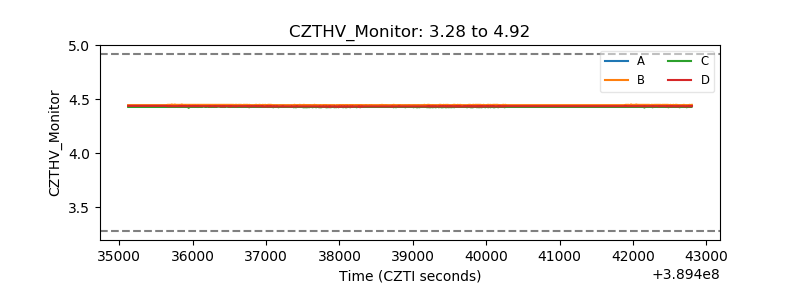 |
| D_VDD | 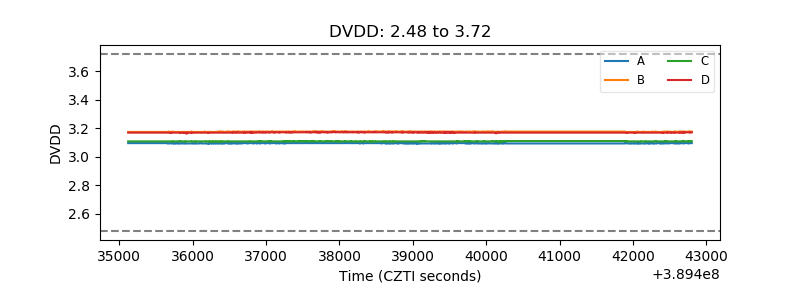 |
| Temperature 1 | 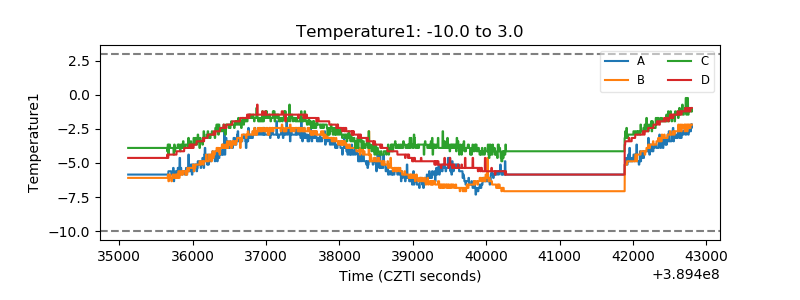 |
| Veto HV Monitor | 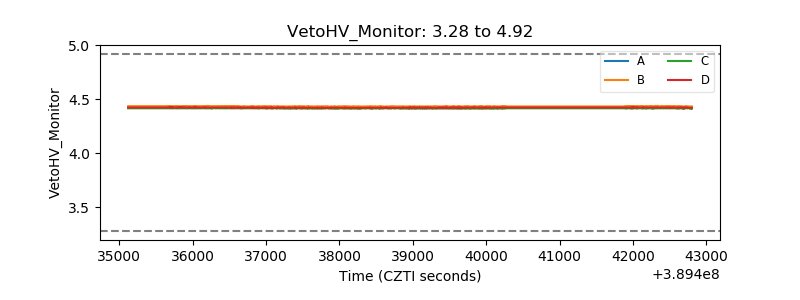 |
| Veto LLD | 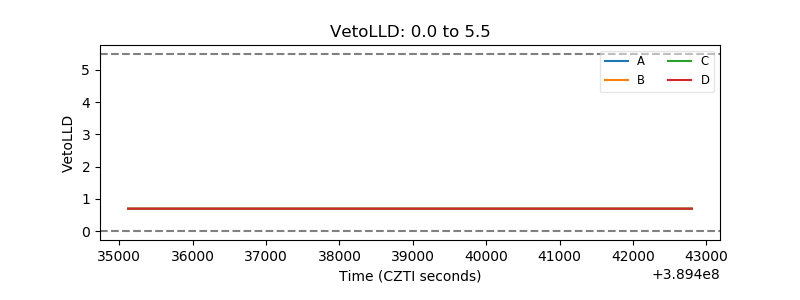 |
| Alpha Counter | 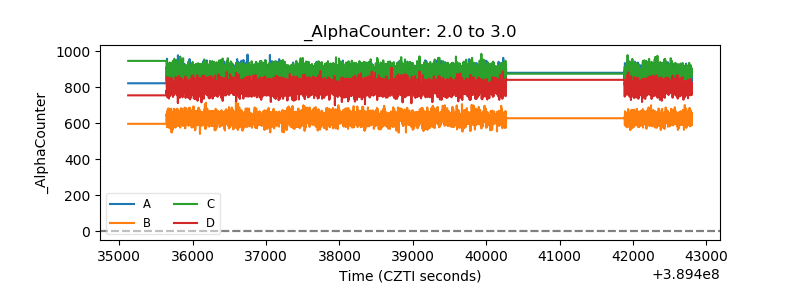 |
| _CPM_Rate | 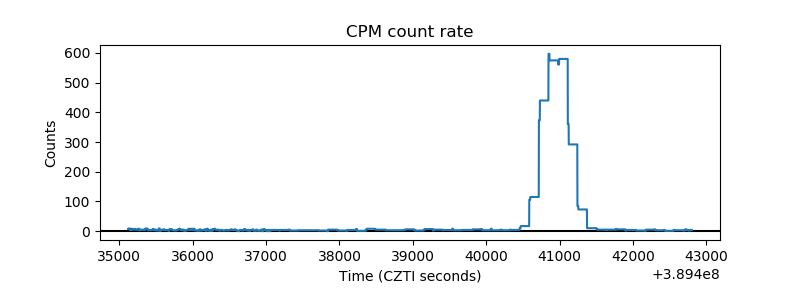 |
| CZT Counter | 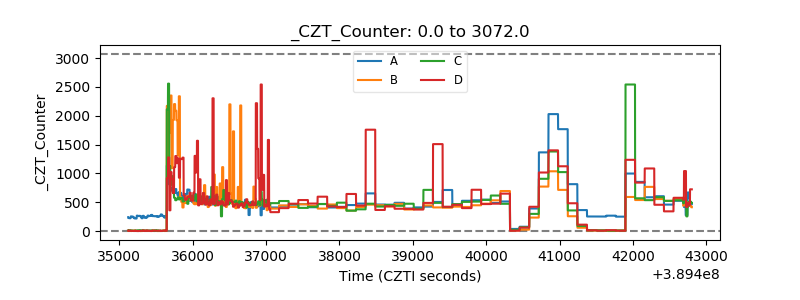 |
| +2.5 Volts monitor | 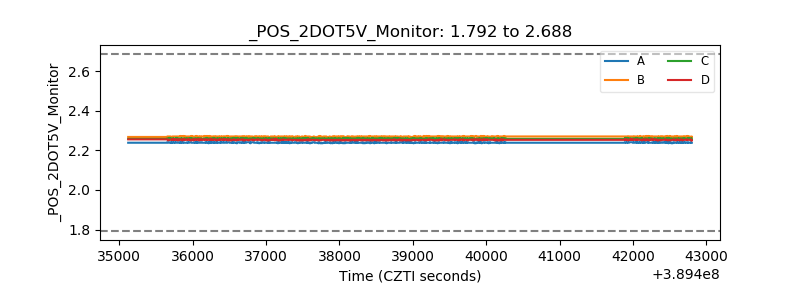 |
| +5 Volts monitor | 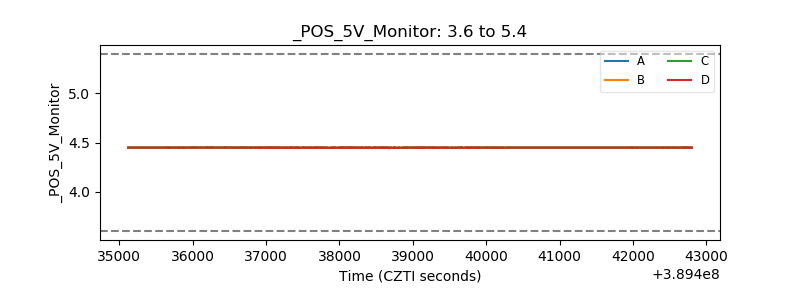 |
| _ROLL_ROT | 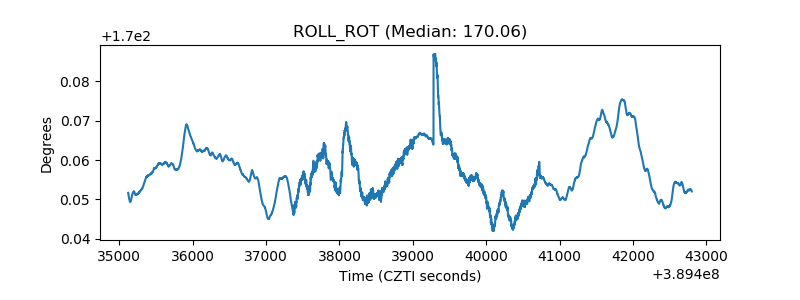 |
| _Roll_DEC | 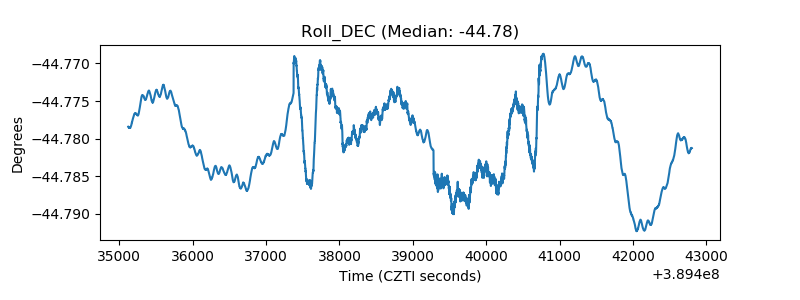 |
| _Roll_RA | 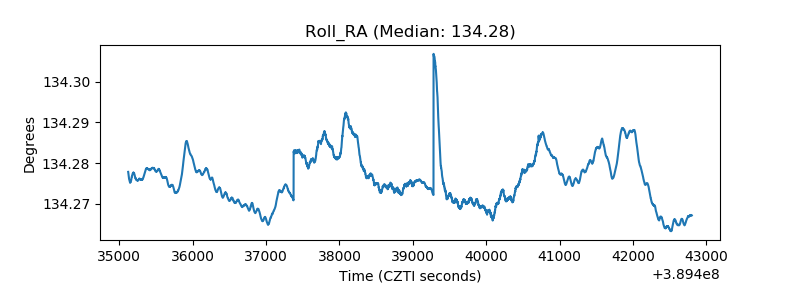 |
| Veto Counter | 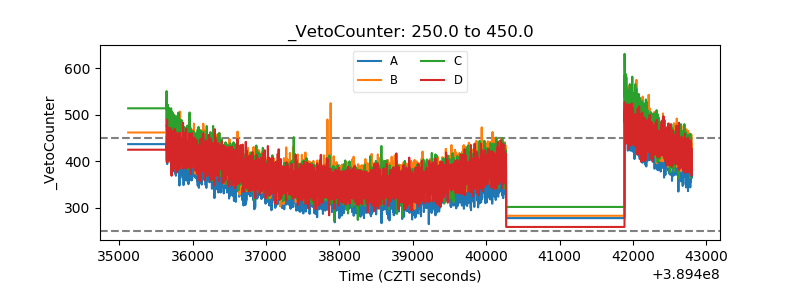 |