| Param | Original file | Final file |
|---|---|---|
| Filename | modeM0/AS1A09_029T04_9000005110_35690cztM0_level2.evt | modeM0/AS1A09_029T04_9000005110_35690cztM0_level2_quad_clean.evt |
| Size (bytes) | 1,182,015,360 | 236,278,080 |
| Size | 1.1 GB | 225.3 MB |
| Events in quadrant A | 7,986,470 | 1,531,037 |
| Events in quadrant B | 9,544,501 | 1,537,613 |
| Events in quadrant C | 7,814,841 | 1,536,163 |
| Events in quadrant D | 9,372,766 | 1,450,426 |
| Mode M9 | |||
|---|---|---|---|
| Quadrant | BADHDUFLAG | Total packets | Discarded packets |
| A | 0 | 54 | 0 |
| B | 0 | 54 | 0 |
| C | 0 | 54 | 0 |
| D | 0 | 54 | 0 |
| Mode SS | |||
|---|---|---|---|
| Quadrant | BADHDUFLAG | Total packets | Discarded packets |
| A | 0 | 333 | 3 |
| B | 0 | 333 | 4 |
| C | 0 | 333 | 5 |
| D | 0 | 333 | 2 |
| Mode M0 | |||
|---|---|---|---|
| Quadrant | BADHDUFLAG | Total packets | Discarded packets |
| A | 0 | 34447 | 564 |
| B | 0 | 39280 | 613 |
| C | 0 | 33259 | 470 |
| D | 0 | 39469 | 732 |
| Quadrant | Total seconds | Saturated seconds | Saturation percentage |
|---|---|---|---|
| A | 15964 | 20 | 0.125282% |
| B | 15956 | 484 | 3.033342% |
| C | 15958 | 46 | 0.288257% |
| D | 15919 | 345 | 2.167222% |
Noise dominated data is calculated using 1-second bins in cleaned event files. If a bin has >2000 counts, and if more than 50% of those come from <1% of pixels, then it is considered to be noise-dominated and hence unusable.
| Quadrant | # 1 sec bins | Bins with >0 counts | Bins with >2000 counts | High rate bins dominated by noise | Noise dominated (total time) | Noise dominated (detector-on time) | Marked lightcurve |
|---|---|---|---|---|---|---|---|
| A | 21752 | 16062 | 0 | 0 | 0.00% | 0.00% |  |
| B | 21752 | 16068 | 348 | 348 | 1.60% | 2.17% | 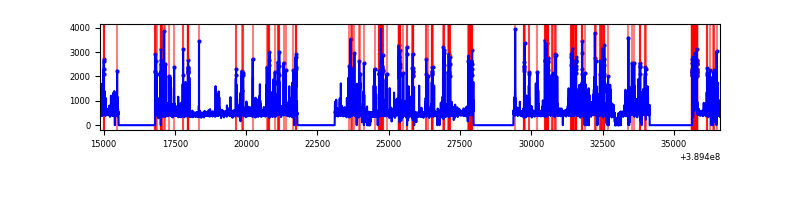 |
| C | 21752 | 16073 | 21 | 21 | 0.10% | 0.13% | 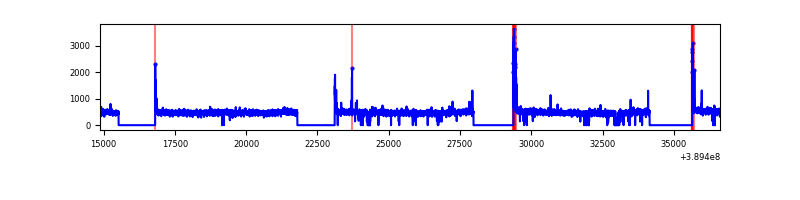 |
| D | 21752 | 16040 | 288 | 288 | 1.32% | 1.80% | 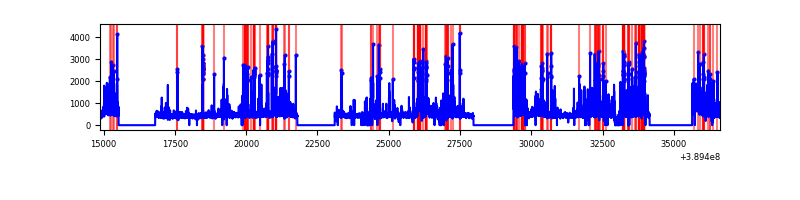 |
Top three noisy pixels from each quadrant. If the there are fewer than three noisy pixels in the level2.evt file, extra rows are filled as -1
| Pixel properties | Quadrant properties | ||||||
|---|---|---|---|---|---|---|---|
| Quadrant | DetID | PixID | Counts | Sigma | Mean | Median | Sigma |
| A | 15 | 169 | 437094 | 1178.5 | 1831 | 1790 | 369.4 |
| A | 10 | 83 | 359236 | 967.71 | 1831 | 1790 | 369.4 |
| A | 15 | 223 | 70216 | 185.25 | 1831 | 1790 | 369.4 |
| B | 5 | 172 | 1227465 | 3550.6 | 1797 | 1749 | 345.2 |
| B | 5 | 255 | 978363 | 2829.01 | 1797 | 1749 | 345.2 |
| B | 3 | 112 | 81074 | 229.78 | 1797 | 1749 | 345.2 |
| C | 15 | 214 | 670425 | 1638.78 | 1770 | 1780 | 408.0 |
| C | 0 | 10 | 182523 | 442.98 | 1770 | 1780 | 408.0 |
| C | 9 | 187 | 28265 | 64.91 | 1770 | 1780 | 408.0 |
| D | 13 | 249 | 788695 | 1816.92 | 1761 | 1710 | 433.1 |
| D | 2 | 249 | 583013 | 1342.06 | 1761 | 1710 | 433.1 |
| D | 2 | 250 | 476508 | 1096.17 | 1761 | 1710 | 433.1 |
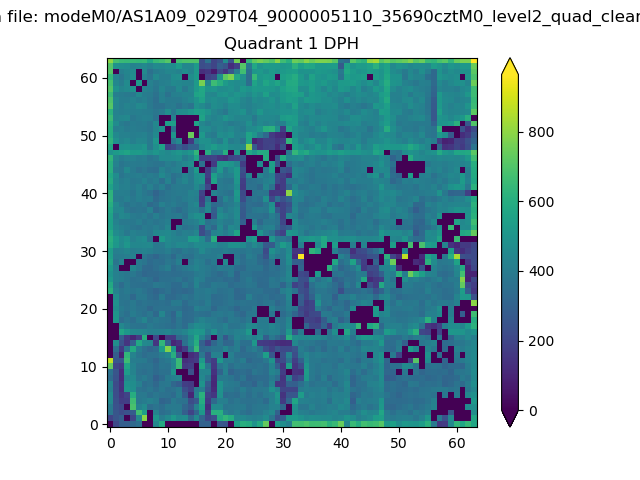
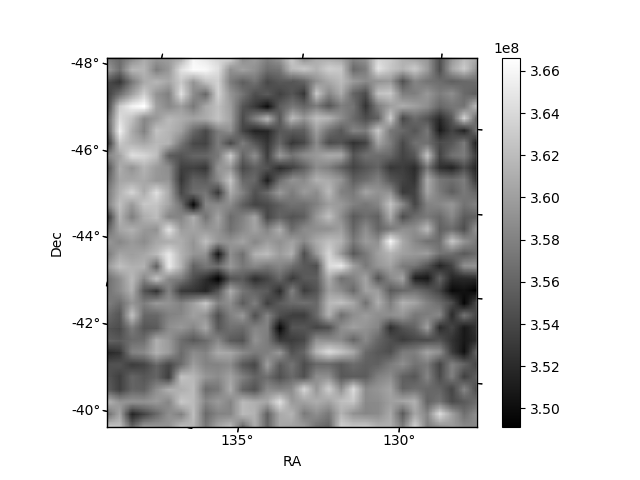
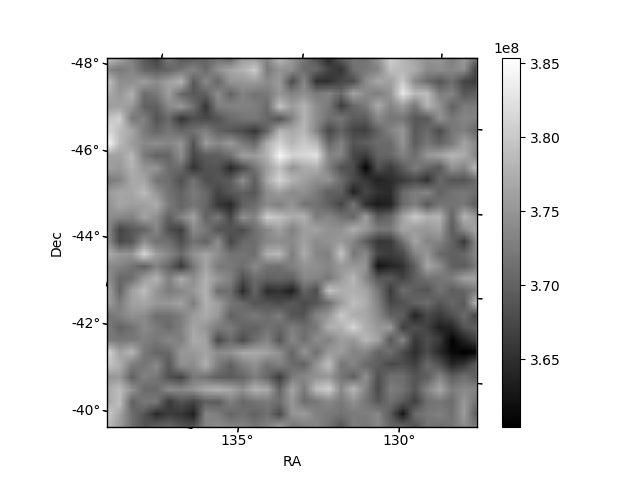
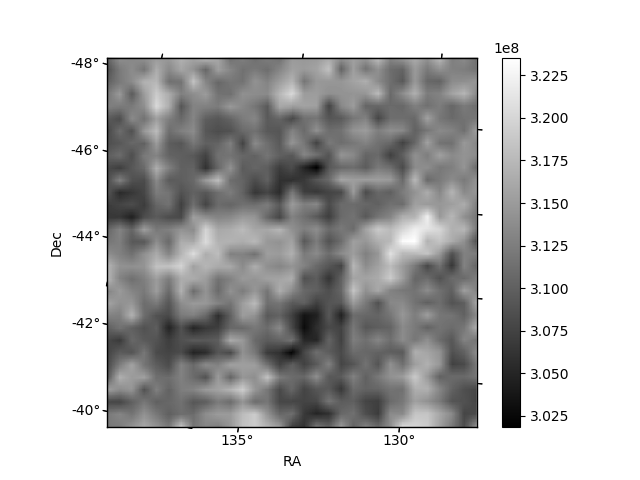
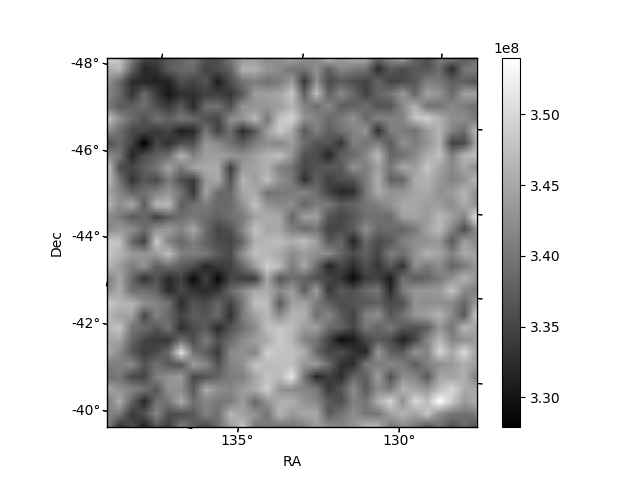
Histogram calculated using DETX and DETY for each event in the final _common_clean file
| Quadrant A | 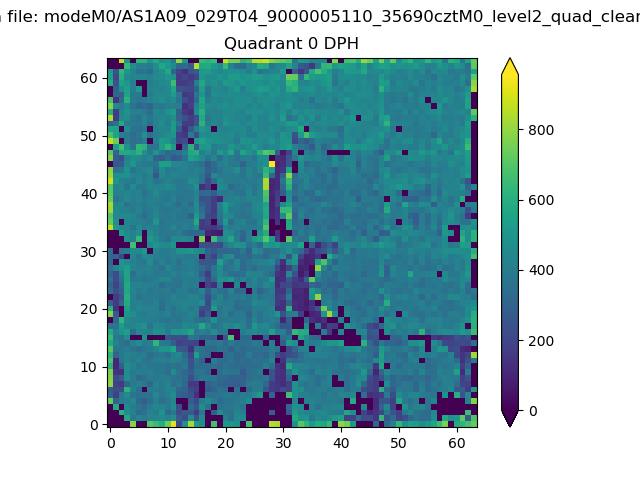 |
 |
Quadrant B |
|---|---|---|---|
| Quadrant D | 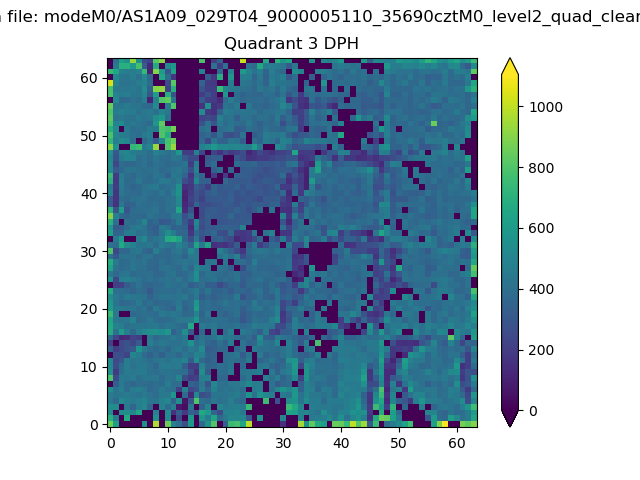 |
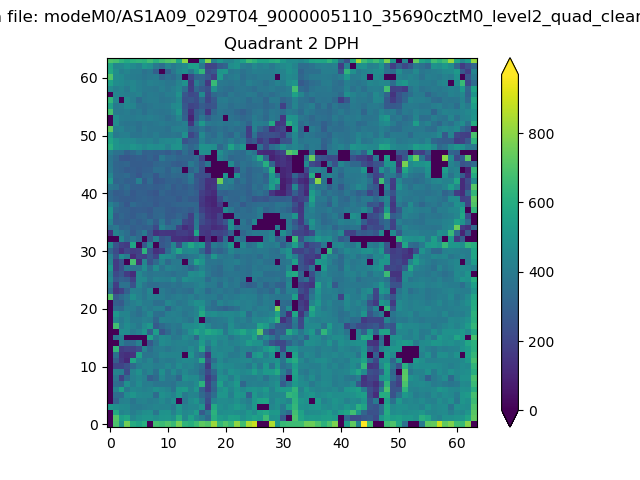 |
Quadrant C |
| Plot type | Count rate plots | Images |
|---|---|---|
| Comparison with Poisson distribution Blue bars denote a histogram of data divided into 1 sec bins. Red curve is a Poisson curve with rate = median count rate of data. |
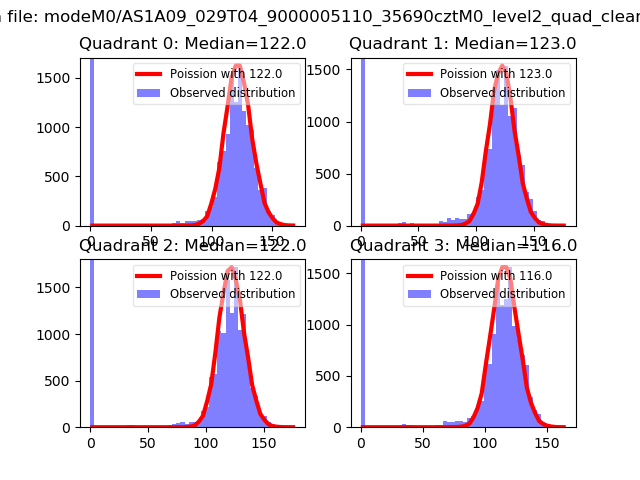 |
 |
| Quadrant-wise count rates Data is divided into 100 sec bins |
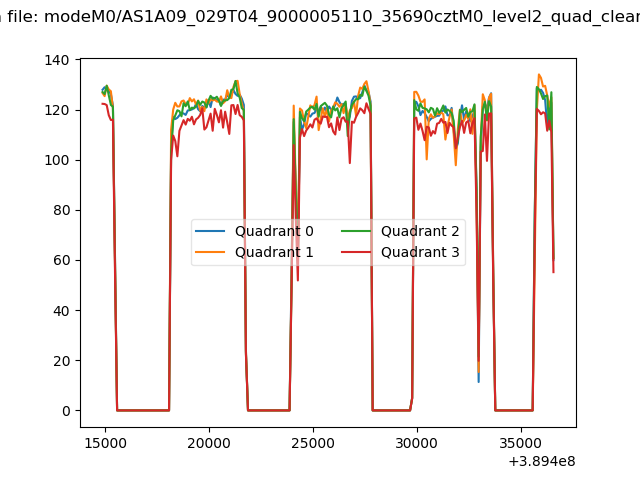 |
|
| Module-wise count rates for Quadrant A Data is divided into 100 sec bins |
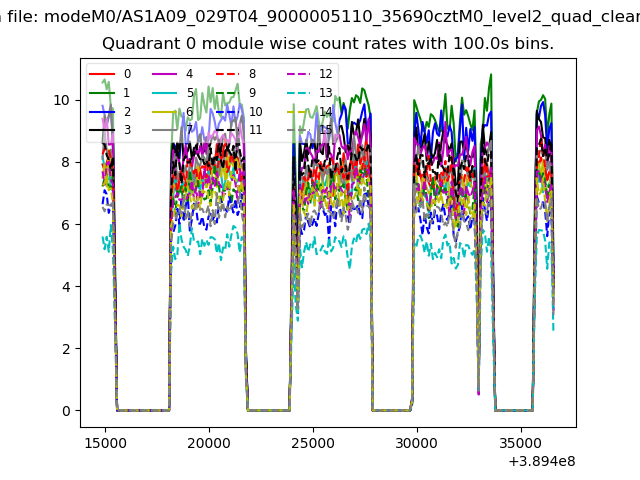 |
 |
| Module-wise count rates for Quadrant B Data is divided into 100 sec bins |
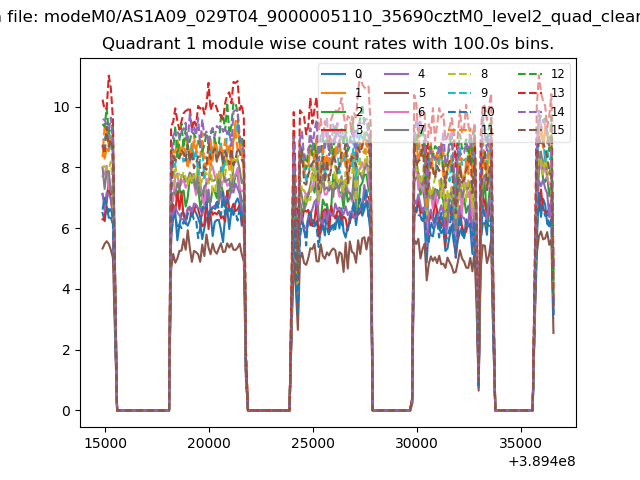 |
 |
| Module-wise count rates for Quadrant C Data is divided into 100 sec bins |
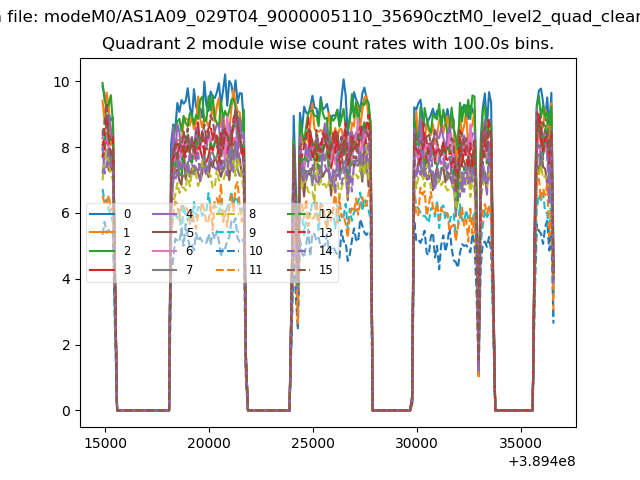 |
 |
| Module-wise count rates for Quadrant D Data is divided into 100 sec bins |
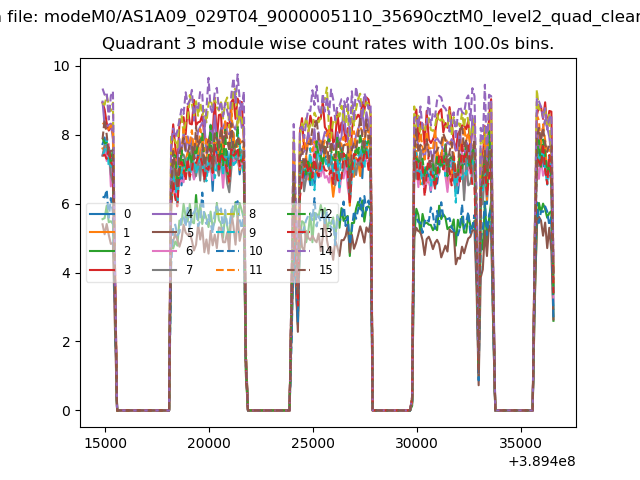 |
 |
| Parameter | Plot |
|---|---|
| CZT HV Monitor |  |
| D_VDD | 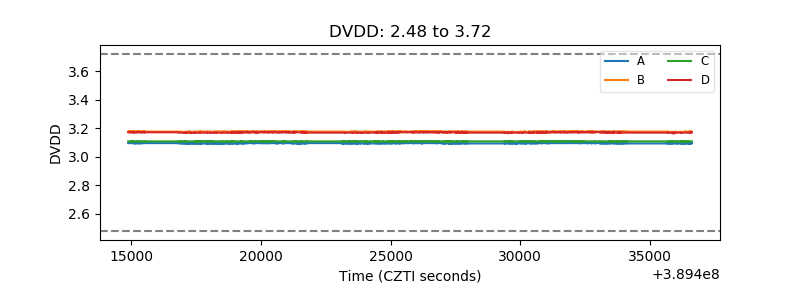 |
| Temperature 1 | 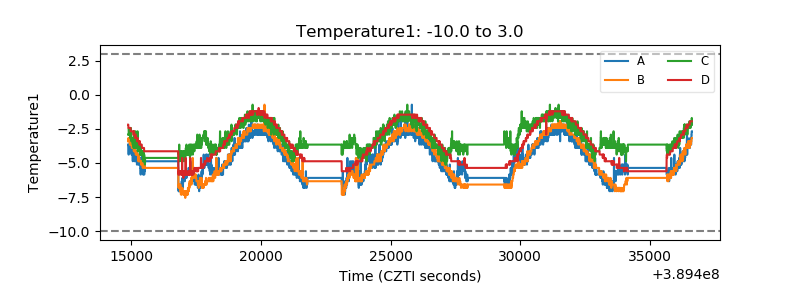 |
| Veto HV Monitor | 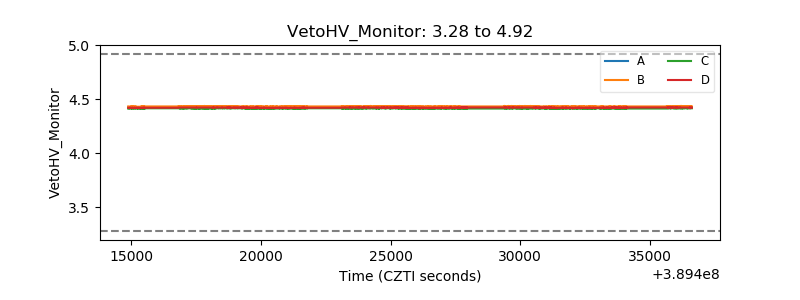 |
| Veto LLD | 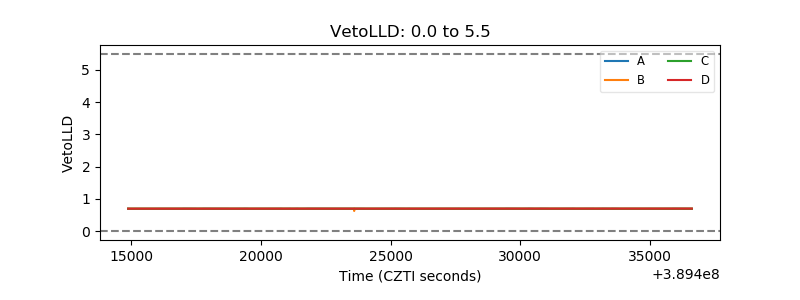 |
| Alpha Counter | 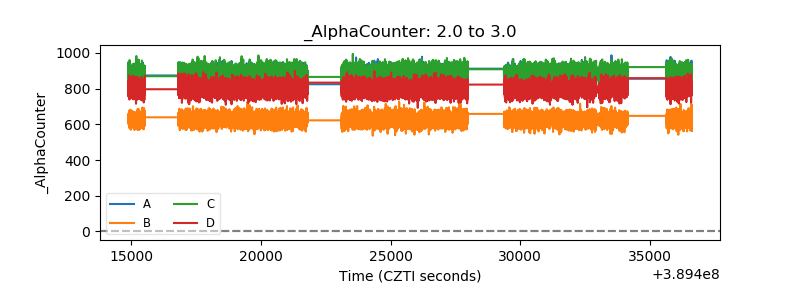 |
| _CPM_Rate | 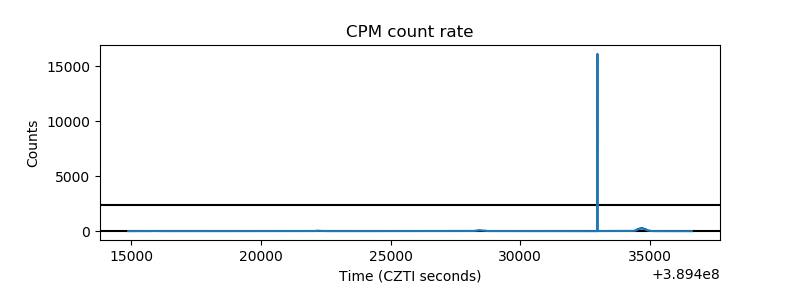 |
| CZT Counter | 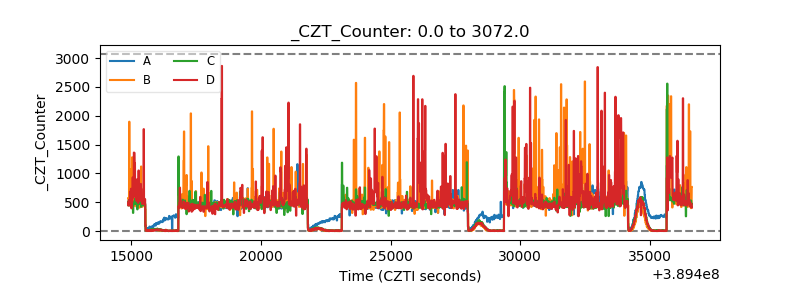 |
| +2.5 Volts monitor | 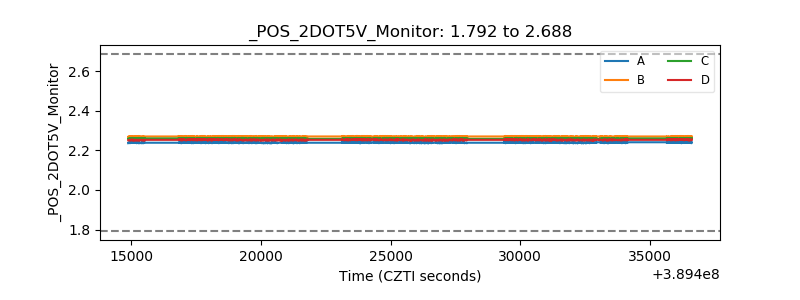 |
| +5 Volts monitor | 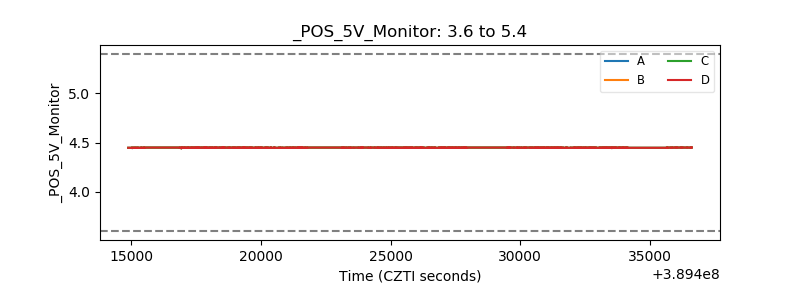 |
| _ROLL_ROT | 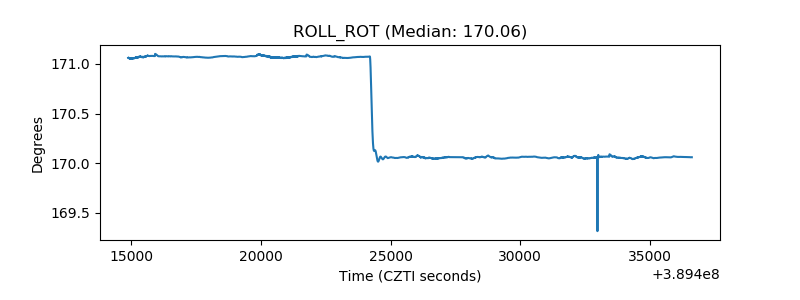 |
| _Roll_DEC | 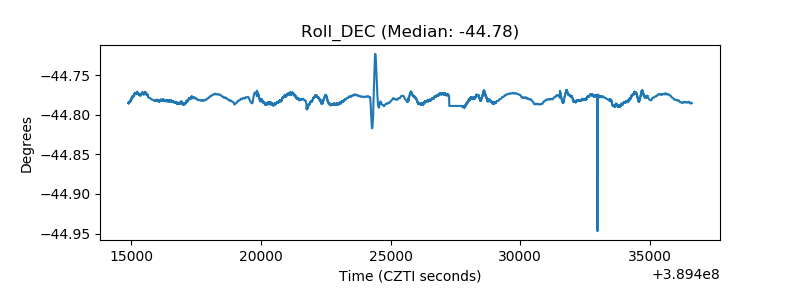 |
| _Roll_RA | 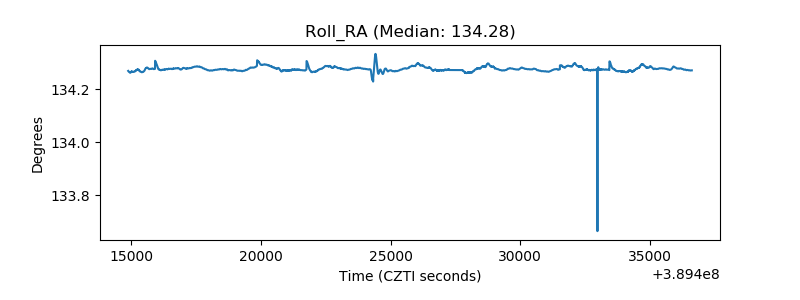 |
| Veto Counter | 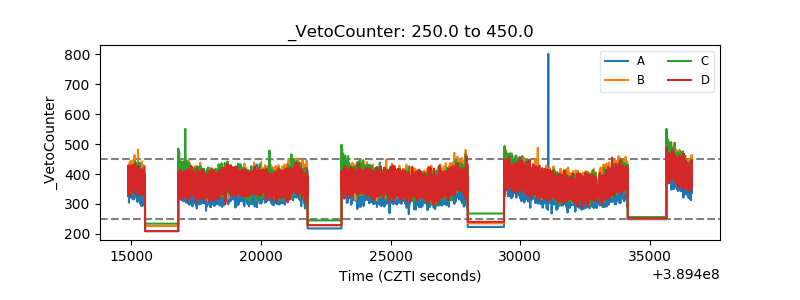 |