| Param | Original file | Final file |
|---|---|---|
| Filename | modeM0/AS1A09_029T04_9000005110_35687cztM0_level2.evt | modeM0/AS1A09_029T04_9000005110_35687cztM0_level2_quad_clean.evt |
| Size (bytes) | 421,096,320 | 65,485,440 |
| Size | 401.6 MB | 62.5 MB |
| Events in quadrant A | 2,876,020 | 397,803 |
| Events in quadrant B | 3,472,239 | 397,950 |
| Events in quadrant C | 2,860,759 | 397,227 |
| Events in quadrant D | 3,139,818 | 374,690 |
| Mode M9 | |||
|---|---|---|---|
| Quadrant | BADHDUFLAG | Total packets | Discarded packets |
| A | 0 | 26 | 0 |
| B | 0 | 26 | 0 |
| C | 0 | 26 | 0 |
| D | 0 | 26 | 0 |
| Mode SS | |||
|---|---|---|---|
| Quadrant | BADHDUFLAG | Total packets | Discarded packets |
| A | 0 | 124 | 0 |
| B | 0 | 124 | 0 |
| C | 0 | 124 | 0 |
| D | 0 | 124 | 0 |
| Mode M0 | |||
|---|---|---|---|
| Quadrant | BADHDUFLAG | Total packets | Discarded packets |
| A | 0 | 12272 | 3 |
| B | 0 | 14229 | 2 |
| C | 0 | 12086 | 2 |
| D | 0 | 13486 | 2 |
| Quadrant | Total seconds | Saturated seconds | Saturation percentage |
|---|---|---|---|
| A | 5930 | 8 | 0.134907% |
| B | 5930 | 167 | 2.816189% |
| C | 5930 | 9 | 0.151771% |
| D | 5930 | 125 | 2.107926% |
Noise dominated data is calculated using 1-second bins in cleaned event files. If a bin has >2000 counts, and if more than 50% of those come from <1% of pixels, then it is considered to be noise-dominated and hence unusable.
| Quadrant | # 1 sec bins | Bins with >0 counts | Bins with >2000 counts | High rate bins dominated by noise | Noise dominated (total time) | Noise dominated (detector-on time) | Marked lightcurve |
|---|---|---|---|---|---|---|---|
| A | 8646 | 5932 | 1 | 1 | 0.01% | 0.02% | 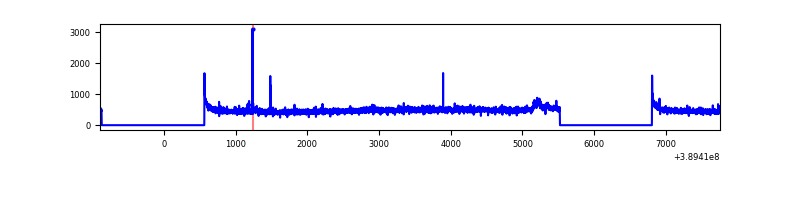 |
| B | 8646 | 5931 | 121 | 121 | 1.40% | 2.04% | 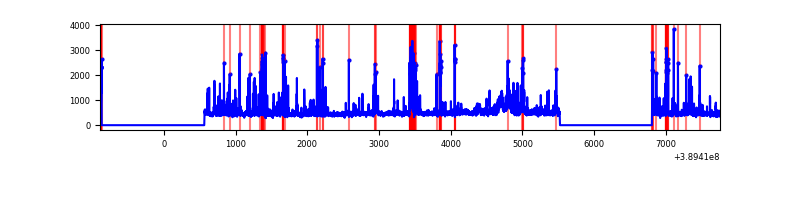 |
| C | 8646 | 5932 | 6 | 6 | 0.07% | 0.10% | 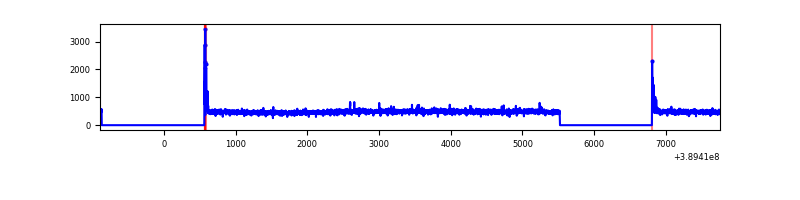 |
| D | 8646 | 5932 | 102 | 102 | 1.18% | 1.72% | 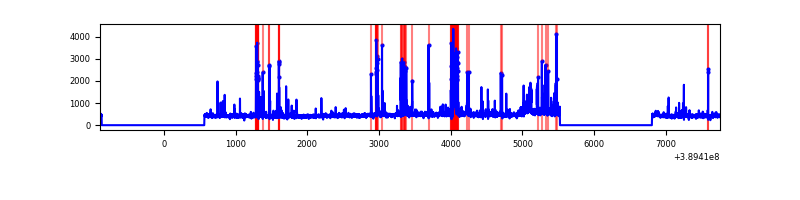 |
Top three noisy pixels from each quadrant. If the there are fewer than three noisy pixels in the level2.evt file, extra rows are filled as -1
| Pixel properties | Quadrant properties | ||||||
|---|---|---|---|---|---|---|---|
| Quadrant | DetID | PixID | Counts | Sigma | Mean | Median | Sigma |
| A | 10 | 83 | 154549 | 1136.05 | 672 | 658 | 135.5 |
| A | 15 | 223 | 115634 | 848.77 | 672 | 658 | 135.5 |
| A | 13 | 6 | 7464 | 50.24 | 672 | 658 | 135.5 |
| B | 5 | 172 | 673185 | 5237.93 | 662 | 644 | 128.4 |
| B | 5 | 255 | 71802 | 554.2 | 662 | 644 | 128.4 |
| B | 0 | 190 | 57690 | 444.29 | 662 | 644 | 128.4 |
| C | 15 | 214 | 251300 | 1649.0 | 651 | 654 | 152.0 |
| C | 0 | 10 | 57193 | 371.97 | 651 | 654 | 152.0 |
| C | 9 | 187 | 7039 | 42.01 | 651 | 654 | 152.0 |
| D | 10 | 118 | 177265 | 1118.52 | 645 | 626 | 157.9 |
| D | 13 | 249 | 173149 | 1092.46 | 645 | 626 | 157.9 |
| D | 2 | 249 | 86733 | 545.25 | 645 | 626 | 157.9 |
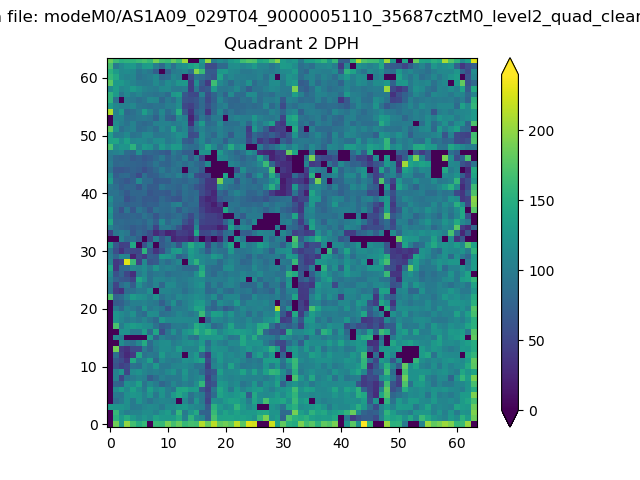
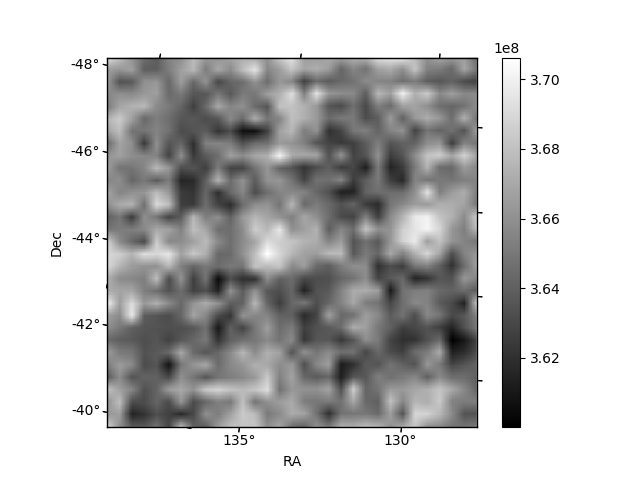
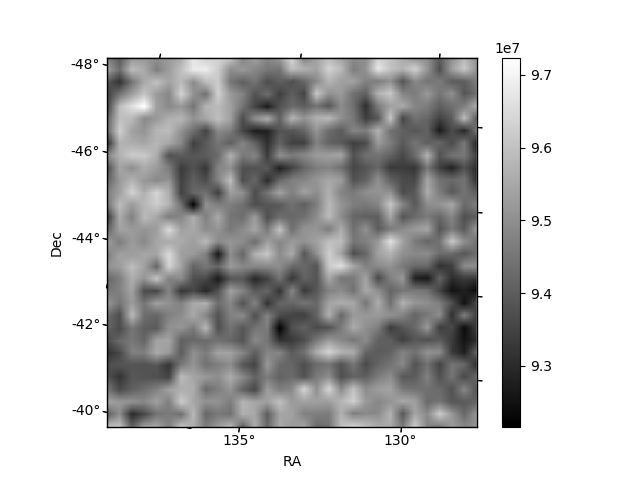
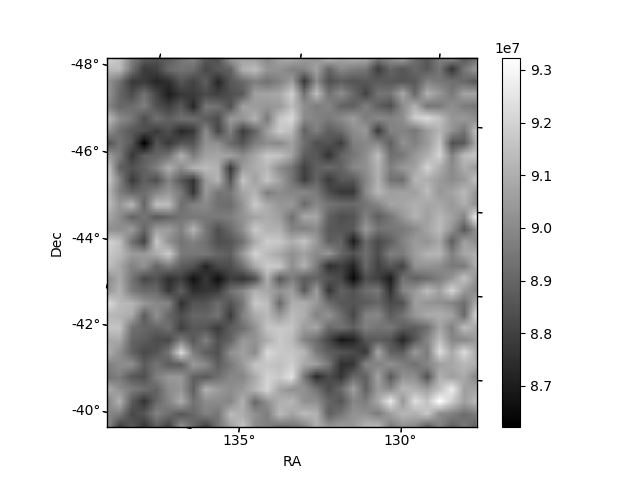
Histogram calculated using DETX and DETY for each event in the final _common_clean file
| Quadrant A | 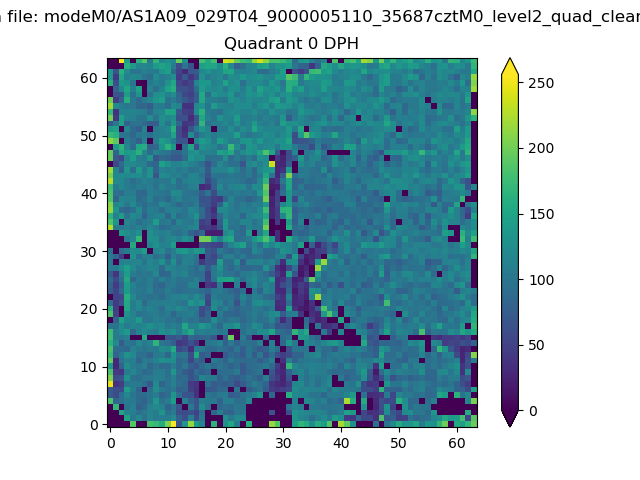 |
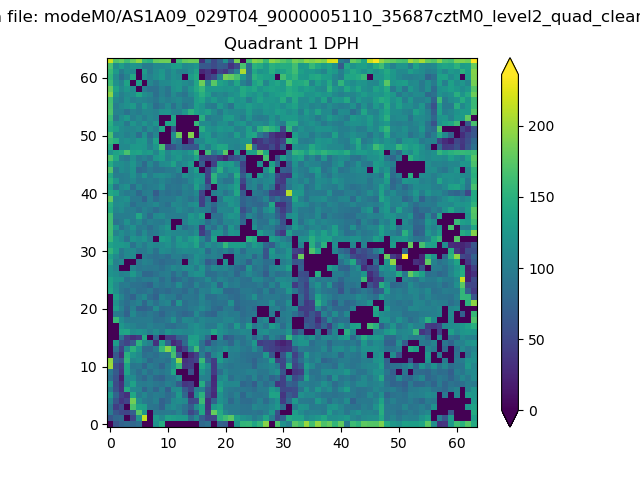 |
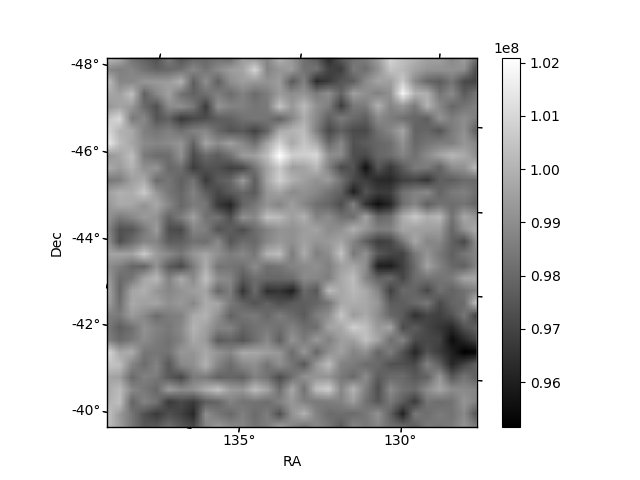
Quadrant B |
|---|---|---|---|
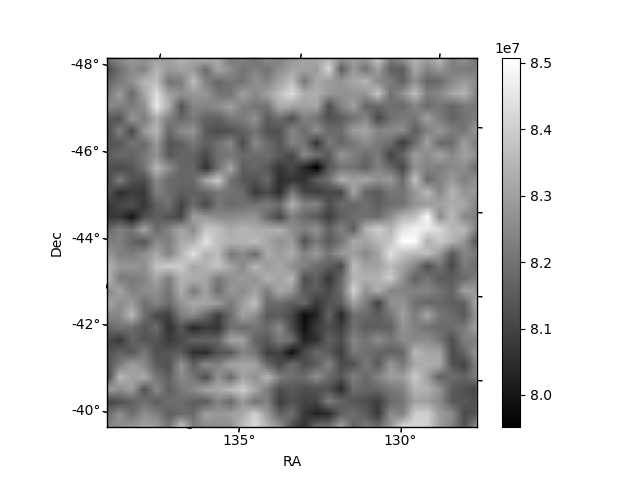
| Quadrant D | 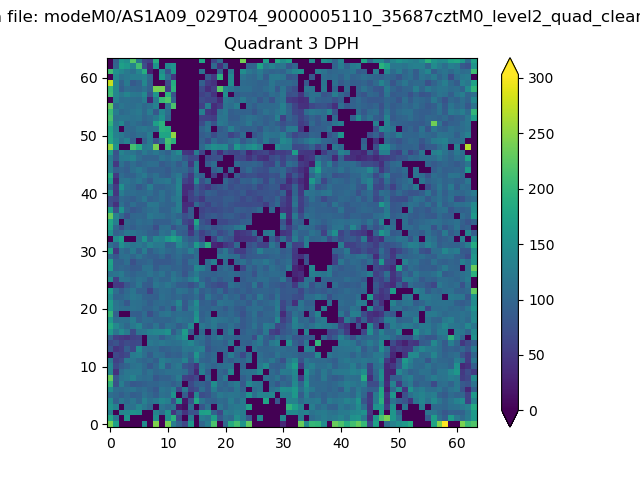 |
 |
Quadrant C |
| Plot type | Count rate plots | Images |
|---|---|---|
| Comparison with Poisson distribution Blue bars denote a histogram of data divided into 1 sec bins. Red curve is a Poisson curve with rate = median count rate of data. |
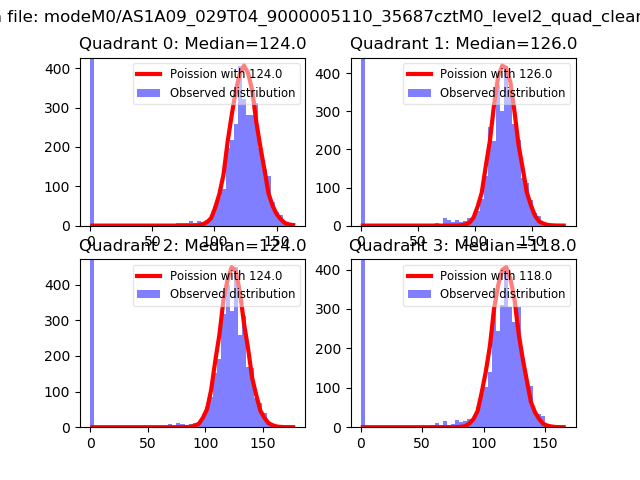 |
 |
| Quadrant-wise count rates Data is divided into 100 sec bins |
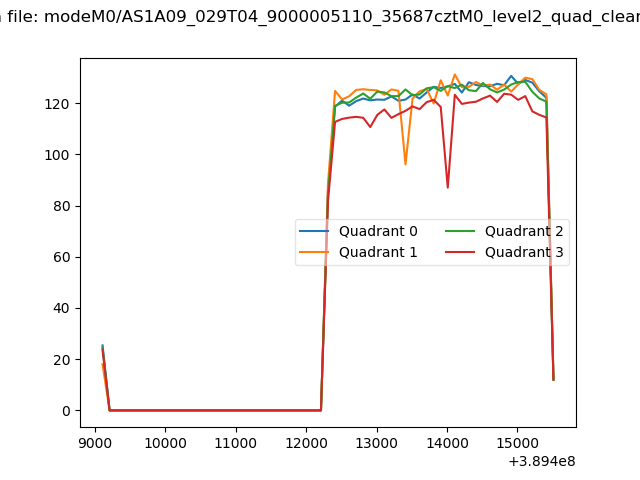 |
|
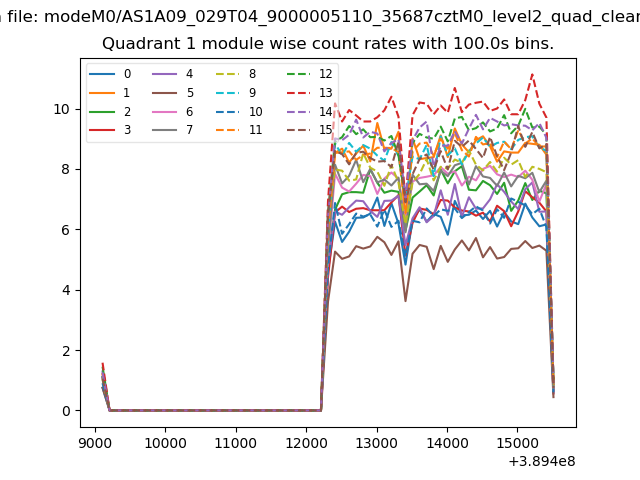
| Module-wise count rates for Quadrant A Data is divided into 100 sec bins |
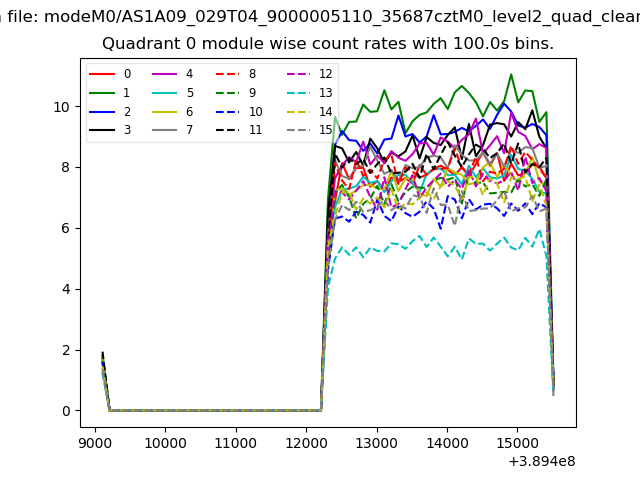 |
 |
| Module-wise count rates for Quadrant B Data is divided into 100 sec bins |
 |
 |
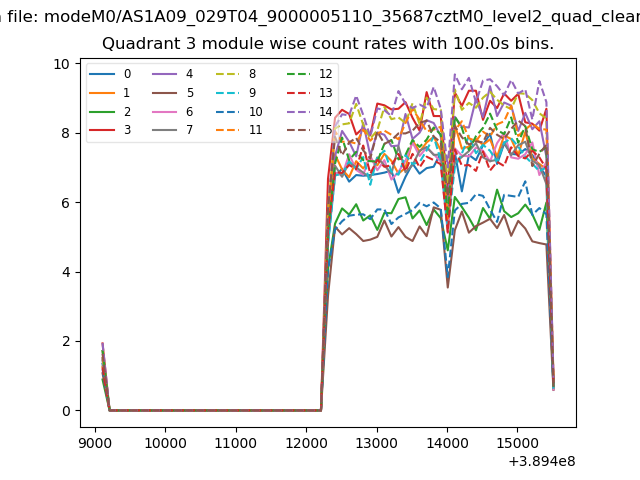
| Module-wise count rates for Quadrant C Data is divided into 100 sec bins |
 |
 |
| Module-wise count rates for Quadrant D Data is divided into 100 sec bins |
 |
 |
| Parameter | Plot |
|---|---|
| CZT HV Monitor | 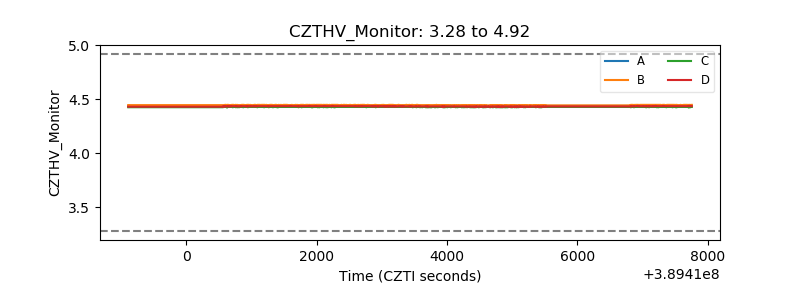 |
| D_VDD | 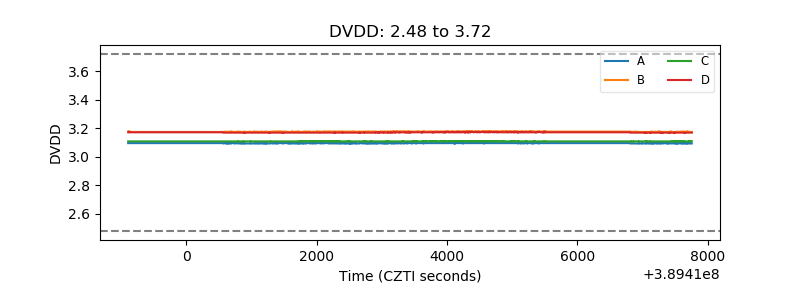 |
| Temperature 1 | 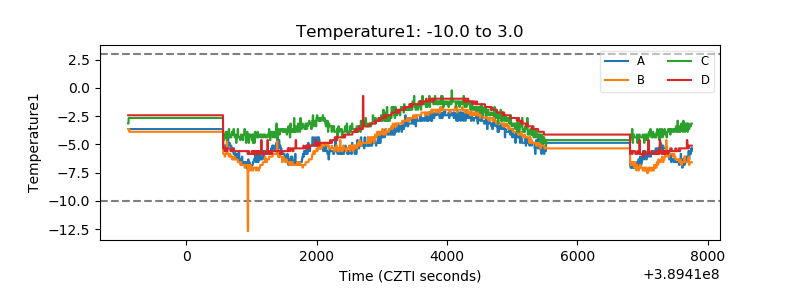 |
| Veto HV Monitor | 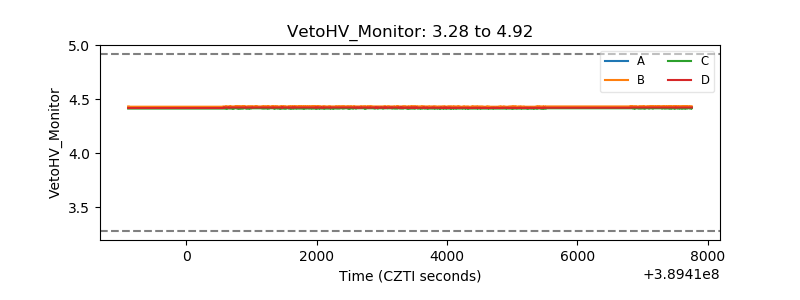 |
| Veto LLD | 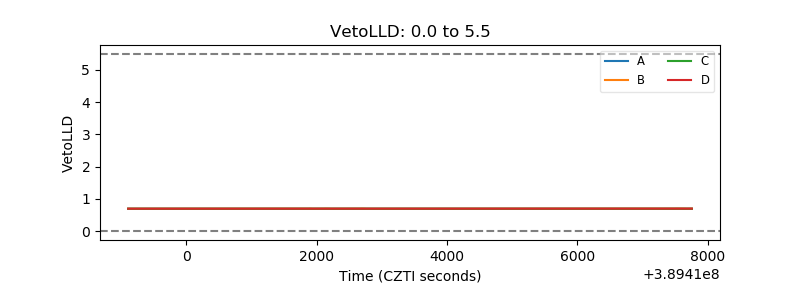 |
| Alpha Counter | 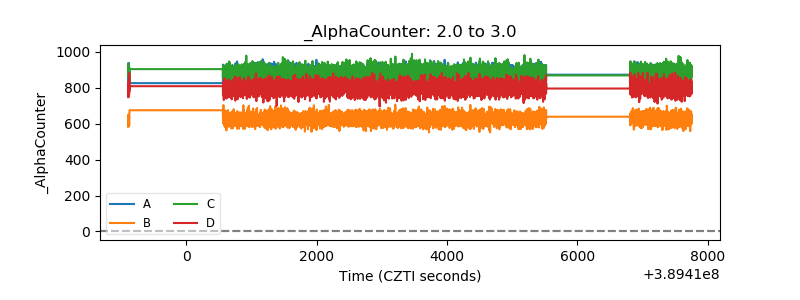 |
| _CPM_Rate | 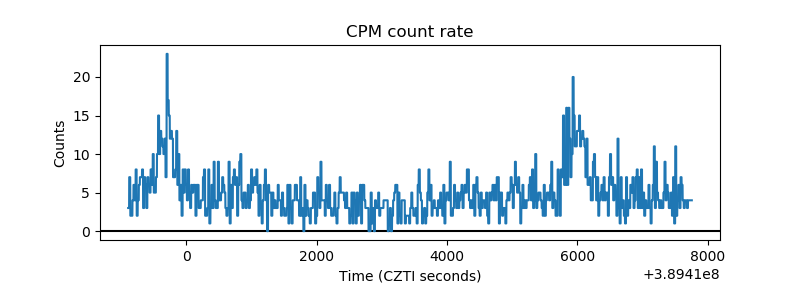 |
| CZT Counter | 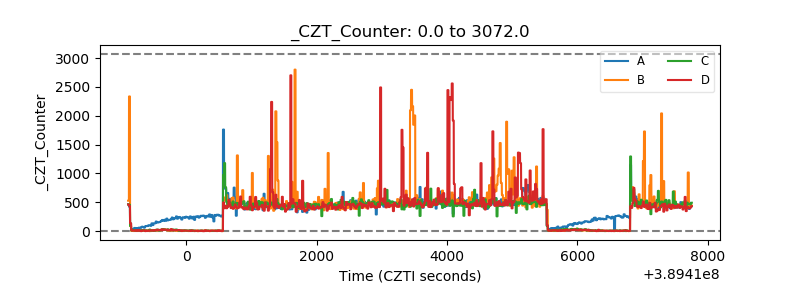 |
| +2.5 Volts monitor | 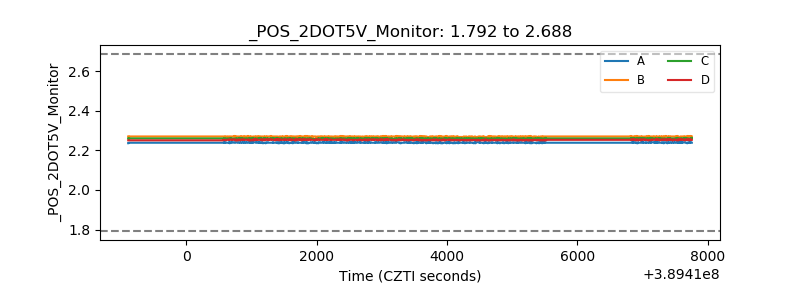 |
| +5 Volts monitor | 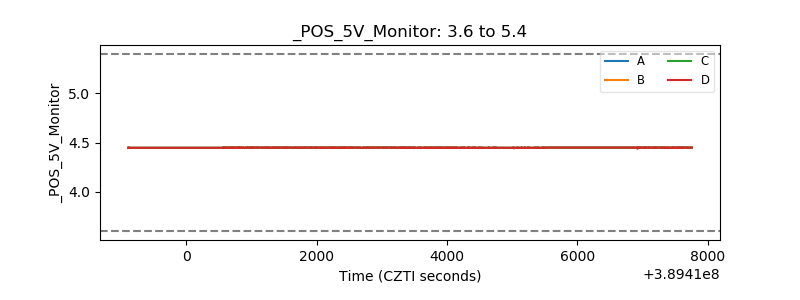 |
| _ROLL_ROT | 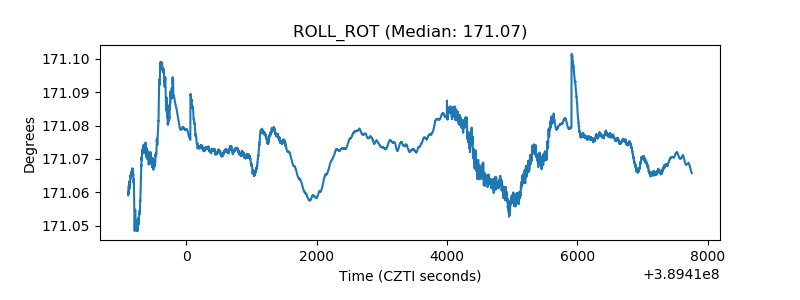 |
| _Roll_DEC | 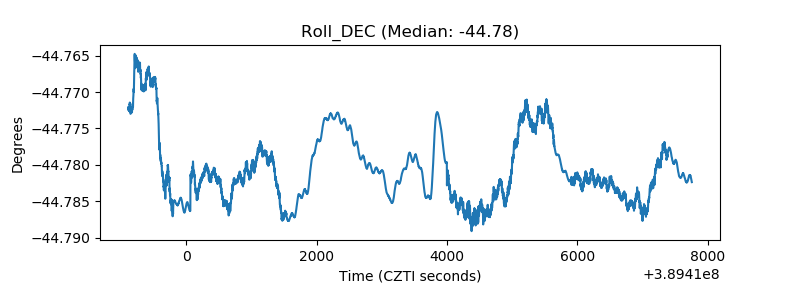 |
| _Roll_RA | 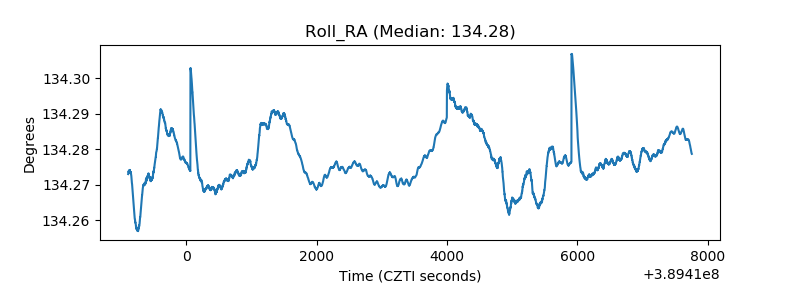 |
| Veto Counter | 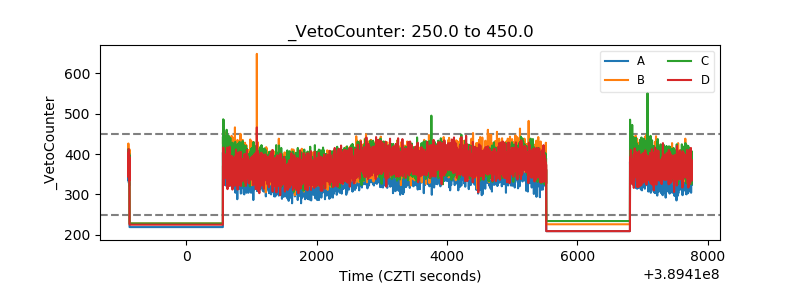 |