| Param | Original file | Final file |
|---|---|---|
| Filename | modeM0/AS1A09_029T04_9000005110_35685cztM0_level2.evt | modeM0/AS1A09_029T04_9000005110_35685cztM0_level2_quad_clean.evt |
| Size (bytes) | 399,513,600 | 57,467,520 |
| Size | 381.0 MB | 54.8 MB |
| Events in quadrant A | 2,496,417 | 346,225 |
| Events in quadrant B | 3,229,887 | 347,837 |
| Events in quadrant C | 2,643,394 | 343,607 |
| Events in quadrant D | 3,366,282 | 328,121 |
| Mode M9 | |||
|---|---|---|---|
| Quadrant | BADHDUFLAG | Total packets | Discarded packets |
| A | 0 | 32 | 0 |
| B | 0 | 32 | 0 |
| C | 0 | 32 | 0 |
| D | 0 | 33 | 0 |
| Mode SS | |||
|---|---|---|---|
| Quadrant | BADHDUFLAG | Total packets | Discarded packets |
| A | 0 | 110 | 0 |
| B | 0 | 110 | 0 |
| C | 0 | 110 | 0 |
| D | 0 | 110 | 0 |
| Mode M0 | |||
|---|---|---|---|
| Quadrant | BADHDUFLAG | Total packets | Discarded packets |
| A | 0 | 10909 | 3 |
| B | 0 | 13086 | 2 |
| C | 0 | 11096 | 2 |
| D | 0 | 13647 | 2 |
| Quadrant | Total seconds | Saturated seconds | Saturation percentage |
|---|---|---|---|
| A | 5336 | 4 | 0.074963% |
| B | 5336 | 204 | 3.823088% |
| C | 5336 | 15 | 0.281109% |
| D | 5336 | 128 | 2.398801% |
Noise dominated data is calculated using 1-second bins in cleaned event files. If a bin has >2000 counts, and if more than 50% of those come from <1% of pixels, then it is considered to be noise-dominated and hence unusable.
| Quadrant | # 1 sec bins | Bins with >0 counts | Bins with >2000 counts | High rate bins dominated by noise | Noise dominated (total time) | Noise dominated (detector-on time) | Marked lightcurve |
|---|---|---|---|---|---|---|---|
| A | 7098 | 5337 | 0 | 0 | 0.00% | 0.00% | 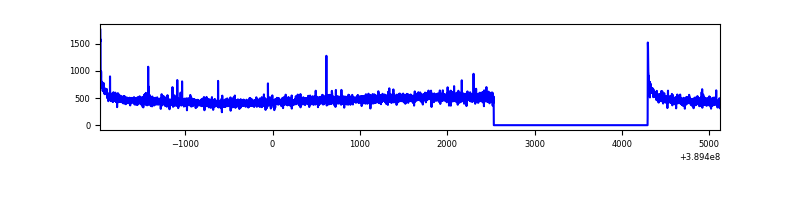 |
| B | 7098 | 5337 | 145 | 145 | 2.04% | 2.72% | 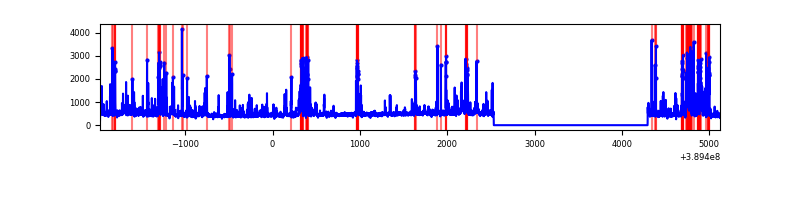 |
| C | 7098 | 5337 | 16 | 16 | 0.23% | 0.30% | 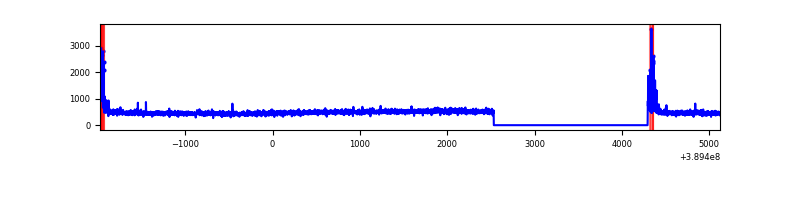 |
| D | 7098 | 5337 | 118 | 118 | 1.66% | 2.21% | 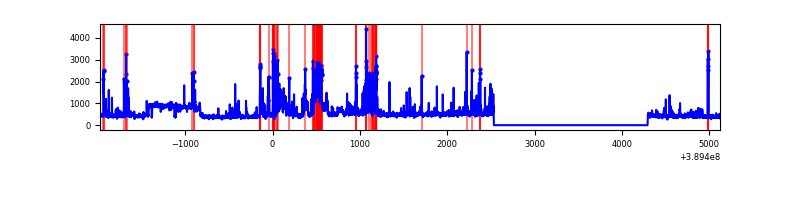 |
Top three noisy pixels from each quadrant. If the there are fewer than three noisy pixels in the level2.evt file, extra rows are filled as -1
| Pixel properties | Quadrant properties | ||||||
|---|---|---|---|---|---|---|---|
| Quadrant | DetID | PixID | Counts | Sigma | Mean | Median | Sigma |
| A | 10 | 83 | 140102 | 1133.91 | 605 | 593 | 123.0 |
| A | 13 | 6 | 14902 | 116.3 | 605 | 593 | 123.0 |
| A | 3 | 137 | 6247 | 45.96 | 605 | 593 | 123.0 |
| B | 5 | 172 | 597174 | 5128.47 | 596 | 581 | 116.3 |
| B | 5 | 255 | 108838 | 930.6 | 596 | 581 | 116.3 |
| B | 0 | 246 | 55211 | 469.61 | 596 | 581 | 116.3 |
| C | 15 | 214 | 226147 | 1631.34 | 588 | 591 | 138.3 |
| C | 0 | 10 | 115259 | 829.34 | 588 | 591 | 138.3 |
| C | 15 | 159 | 6766 | 44.66 | 588 | 591 | 138.3 |
| D | 13 | 249 | 674145 | 4705.72 | 580 | 562 | 143.1 |
| D | 2 | 31 | 277414 | 1934.12 | 580 | 562 | 143.1 |
| D | 10 | 199 | 52200 | 360.75 | 580 | 562 | 143.1 |
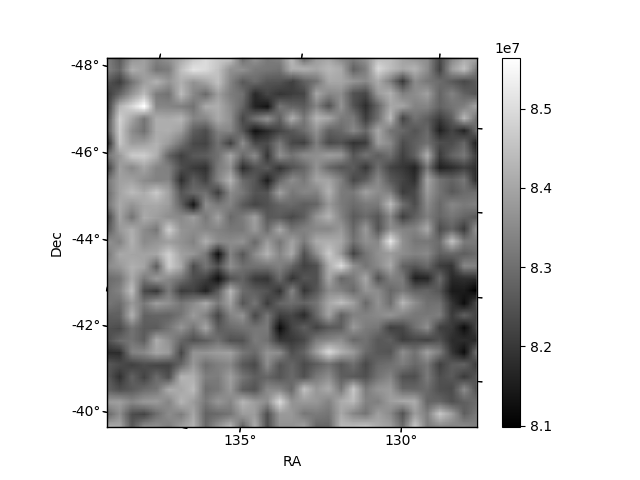
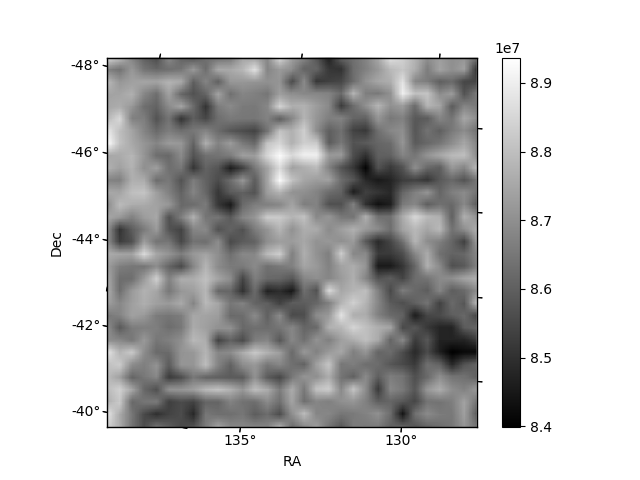
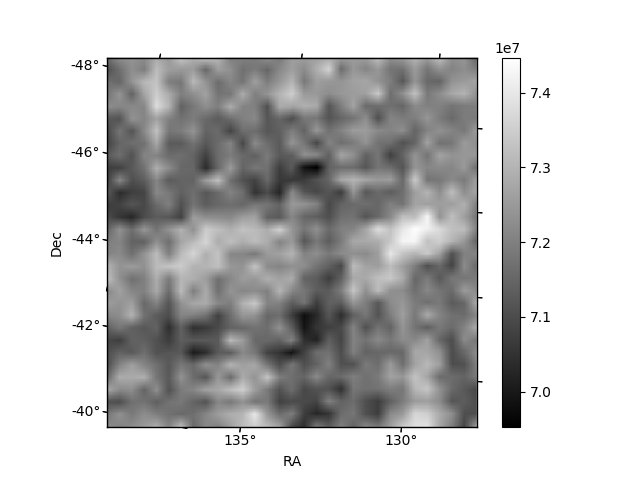
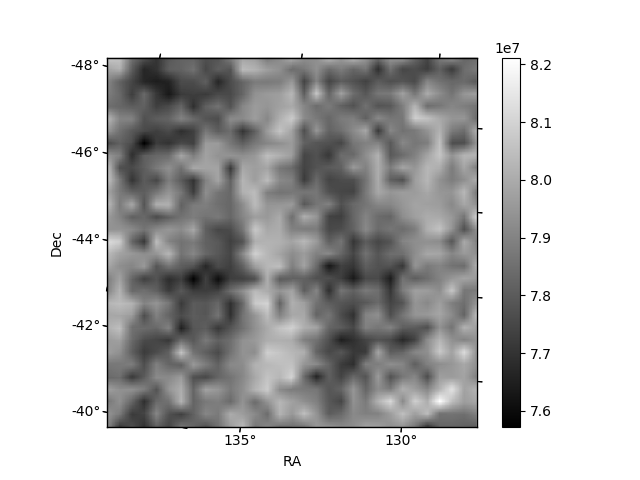
Histogram calculated using DETX and DETY for each event in the final _common_clean file
| Quadrant A | 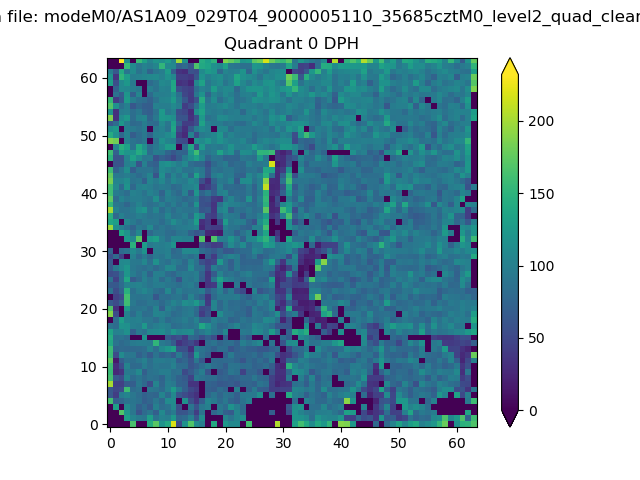 |
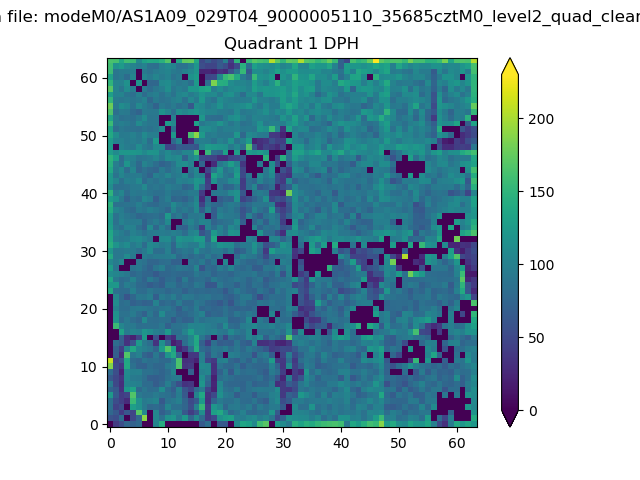 |
Quadrant B |
|---|---|---|---|
| Quadrant D | 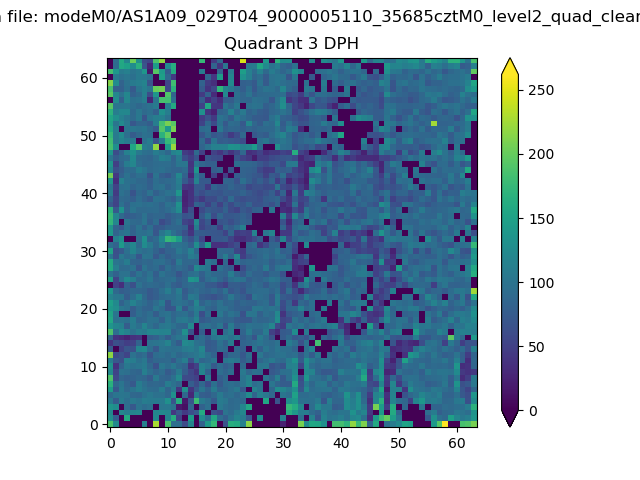 |
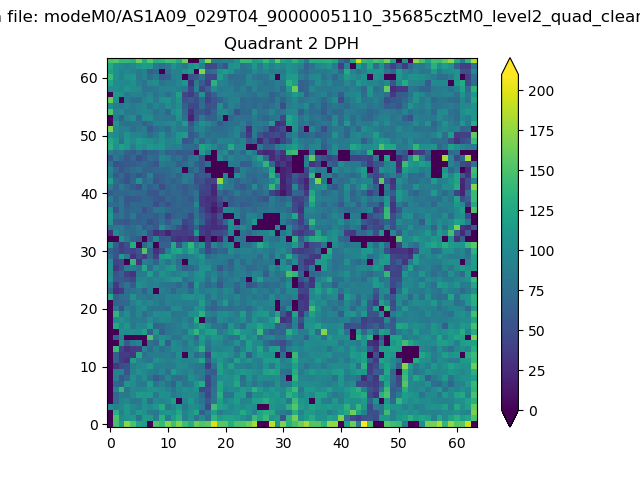 |
Quadrant C |
| Plot type | Count rate plots | Images |
|---|---|---|
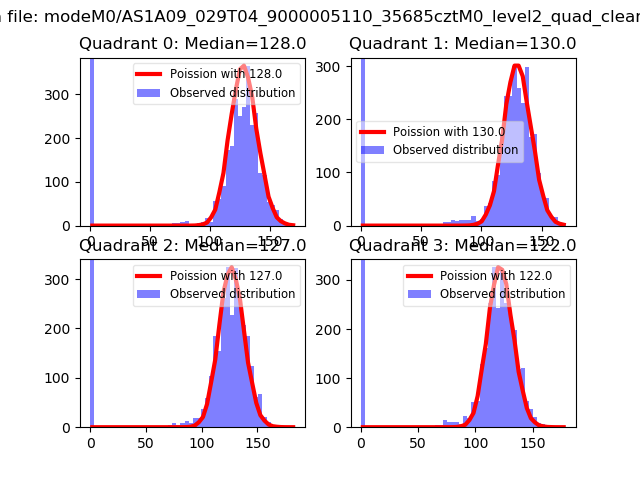
| Comparison with Poisson distribution Blue bars denote a histogram of data divided into 1 sec bins. Red curve is a Poisson curve with rate = median count rate of data. |
 |
 |
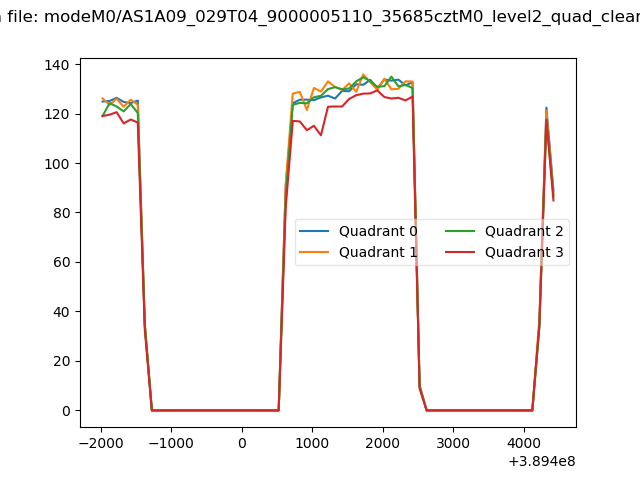
| Quadrant-wise count rates Data is divided into 100 sec bins |
 |
|
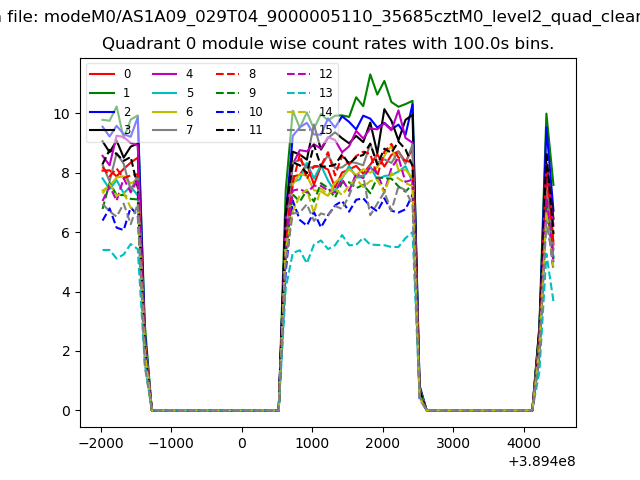
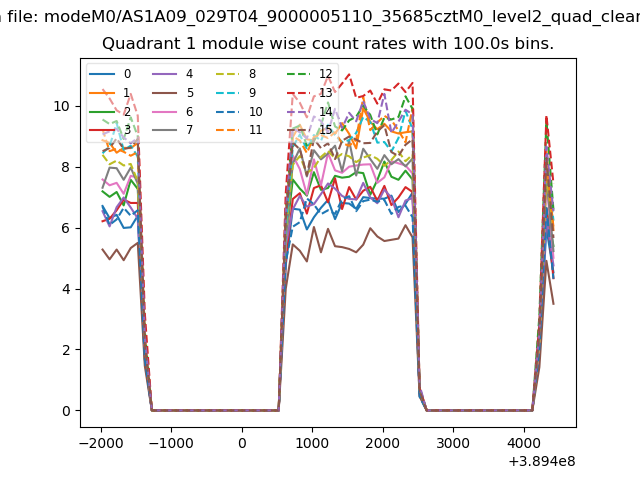
| Module-wise count rates for Quadrant A Data is divided into 100 sec bins |
 |
 |
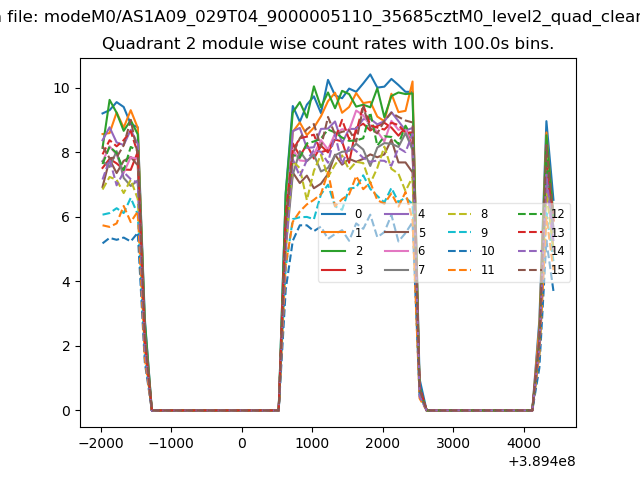
| Module-wise count rates for Quadrant B Data is divided into 100 sec bins |
 |
 |
| Module-wise count rates for Quadrant C Data is divided into 100 sec bins |
 |
 |
| Module-wise count rates for Quadrant D Data is divided into 100 sec bins |
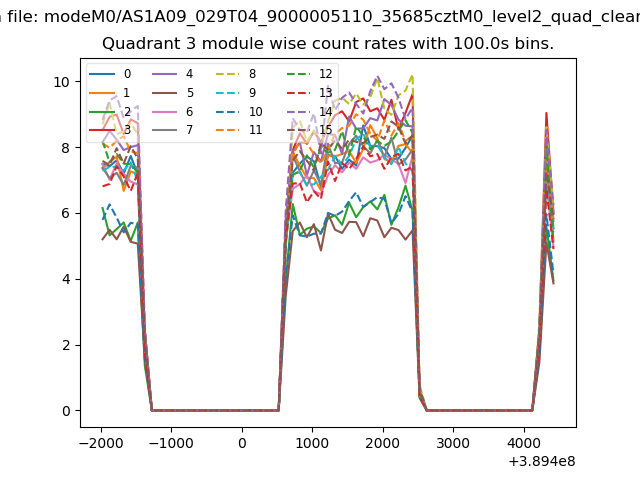 |
 |
| Parameter | Plot |
|---|---|
| CZT HV Monitor | 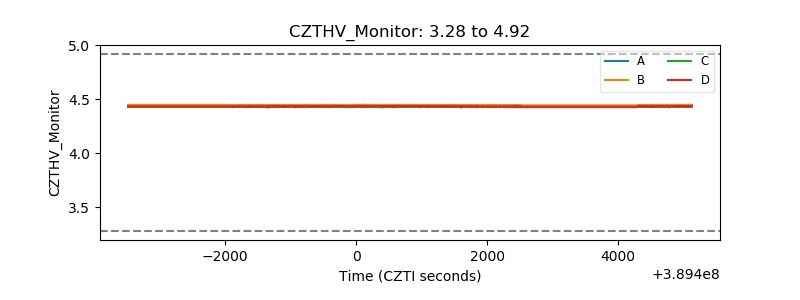 |
| D_VDD |  |
| Temperature 1 | 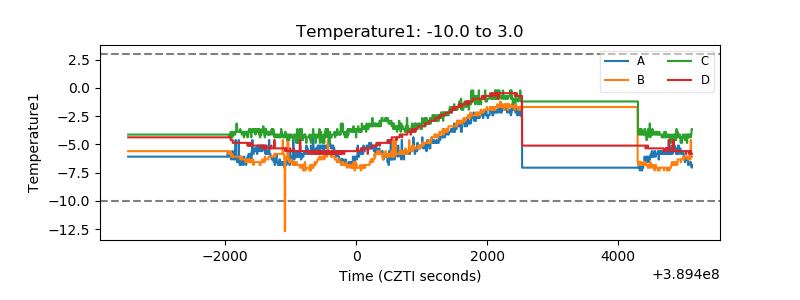 |
| Veto HV Monitor | 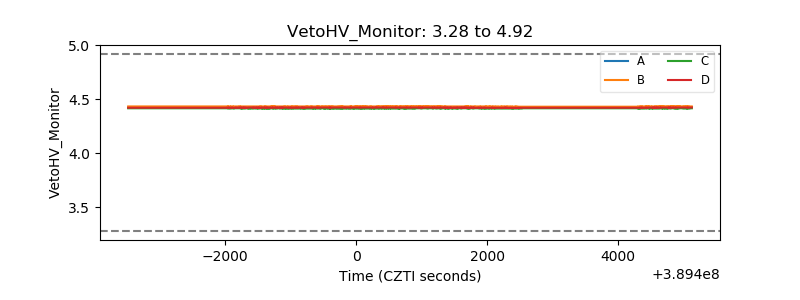 |
| Veto LLD | 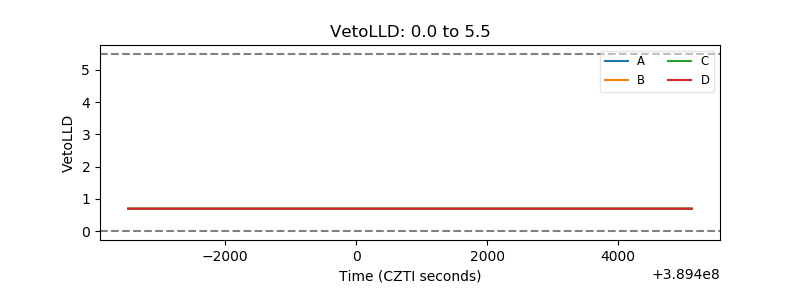 |
| Alpha Counter | 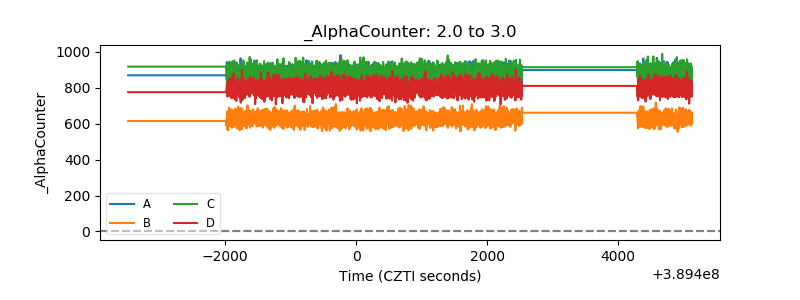 |
| _CPM_Rate | 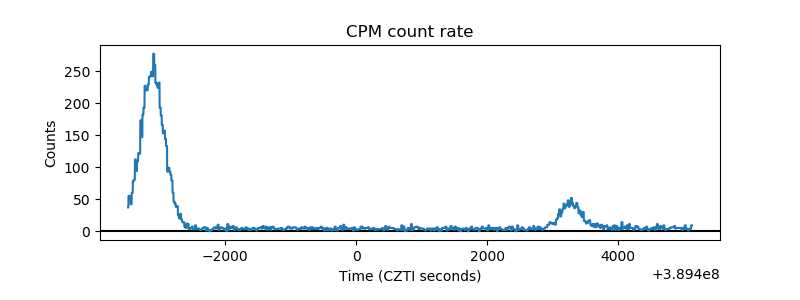 |
| CZT Counter | 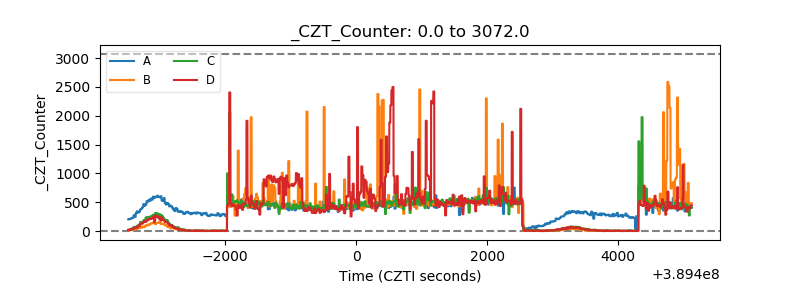 |
| +2.5 Volts monitor | 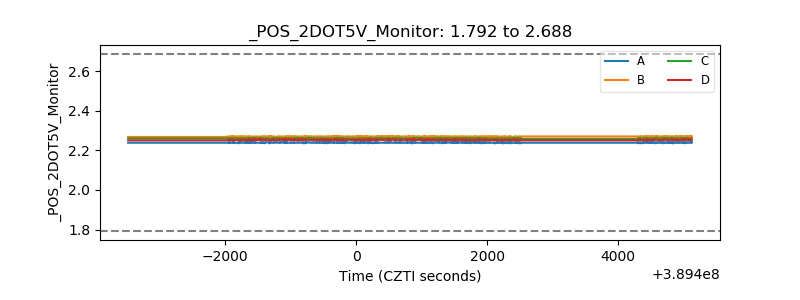 |
| +5 Volts monitor | 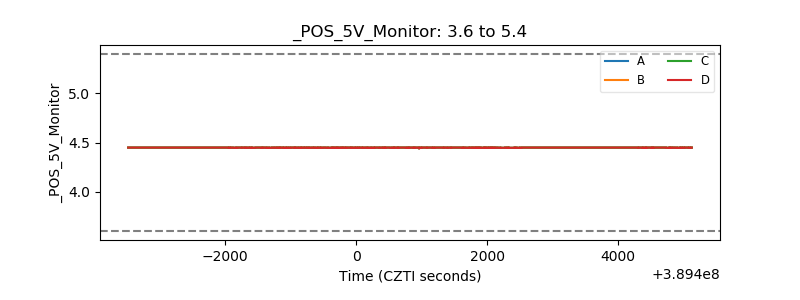 |
| _ROLL_ROT | 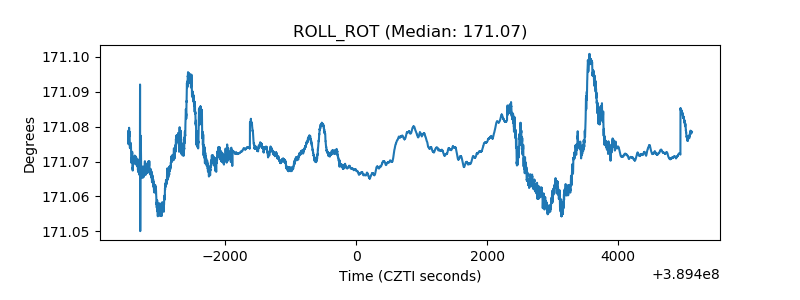 |
| _Roll_DEC | 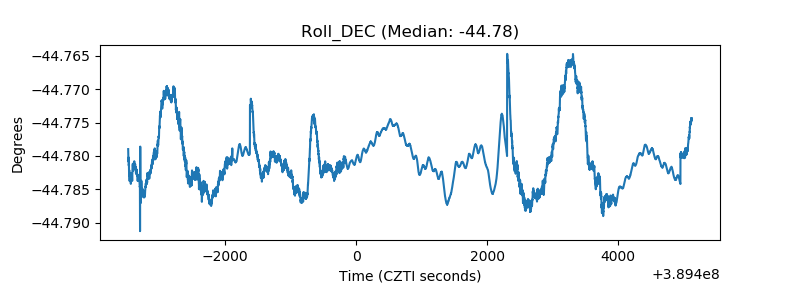 |
| _Roll_RA | 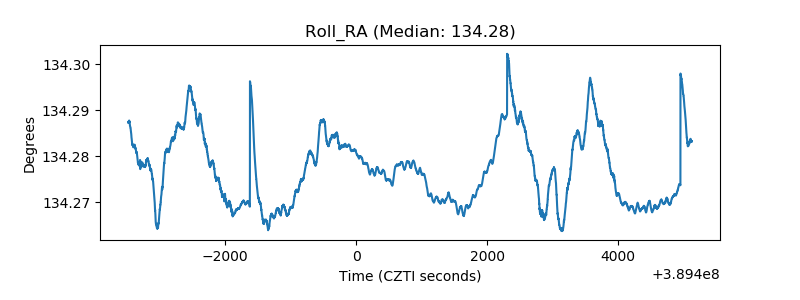 |
| Veto Counter | 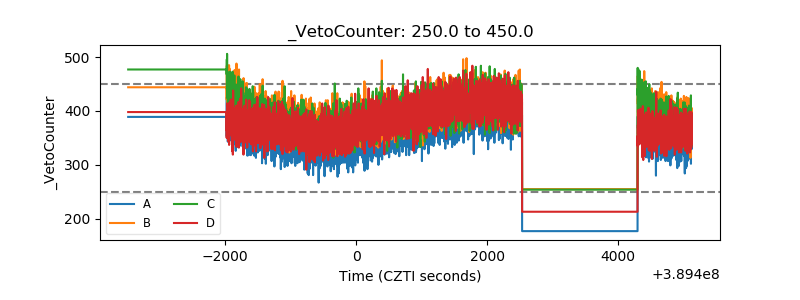 |