| Param | Original file | Final file |
|---|---|---|
| Filename | modeM0/AS1A09_029T04_9000005110cztM0_level2_bc.evt | modeM0/AS1A09_029T04_9000005110cztM0_level2_quad_clean.evt |
| Size (bytes) | 1,549,272,960 | 529,620,480 |
| Size | 1.4 GB | 505.1 MB |
| Events in quadrant A | 9,263,897 | 3,381,471 |
| Events in quadrant B | 12,546,867 | 3,392,874 |
| Events in quadrant C | 9,593,438 | 3,376,791 |
| Events in quadrant D | 12,819,864 | 3,176,715 |
| Mode M9 | |||
|---|---|---|---|
| Quadrant | BADHDUFLAG | Total packets | Discarded packets |
| A | 0 | 144 | 0 |
| B | 0 | 144 | 0 |
| C | 0 | 144 | 0 |
| D | 0 | 144 | 0 |
| Mode SS | |||
|---|---|---|---|
| Quadrant | BADHDUFLAG | Total packets | Discarded packets |
| A | 0 | 810 | 0 |
| B | 0 | 809 | 0 |
| C | 0 | 808 | 0 |
| D | 0 | 811 | 0 |
| Mode M0 | |||
|---|---|---|---|
| Quadrant | BADHDUFLAG | Total packets | Discarded packets |
| A | 0 | 82279 | 0 |
| B | 0 | 98449 | 0 |
| C | 0 | 81695 | 0 |
| D | 0 | 99471 | 0 |
| Quadrant | Total seconds | Saturated seconds | Saturation percentage |
|---|---|---|---|
| A | 39525 | 47 | 0.118912% |
| B | 39522 | 1671 | 4.228025% |
| C | 39520 | 109 | 0.275810% |
| D | 39481 | 1589 | 4.024721% |
Noise dominated data is calculated using 1-second bins in cleaned event files. If a bin has >2000 counts, and if more than 50% of those come from <1% of pixels, then it is considered to be noise-dominated and hence unusable.
| Quadrant | # 1 sec bins | Bins with >0 counts | Bins with >2000 counts | High rate bins dominated by noise | Noise dominated (total time) | Noise dominated (detector-on time) | Marked lightcurve |
|---|---|---|---|---|---|---|---|
| A | 57551 | 39629 | 1 | 1 | 0.00% | 0.00% | 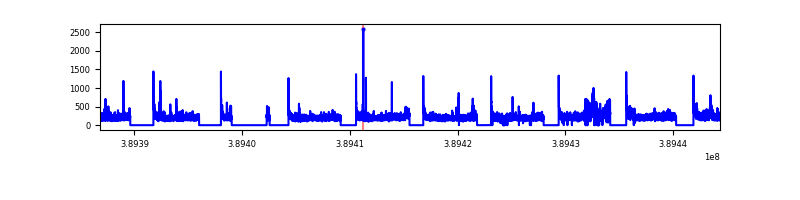 |
| B | 57551 | 39627 | 126 | 126 | 0.22% | 0.32% | 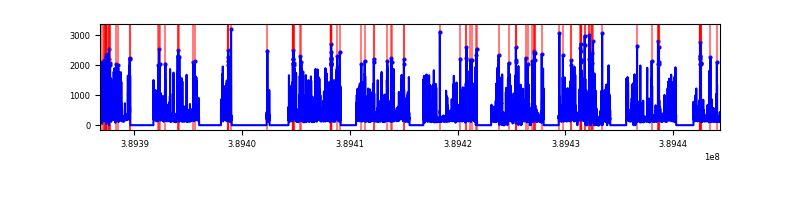 |
| C | 57551 | 39633 | 9 | 9 | 0.02% | 0.02% | 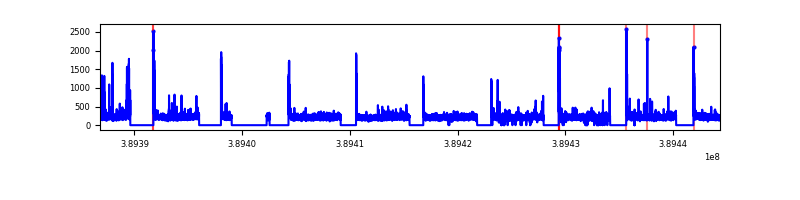 |
| D | 57551 | 39598 | 90 | 90 | 0.16% | 0.23% | 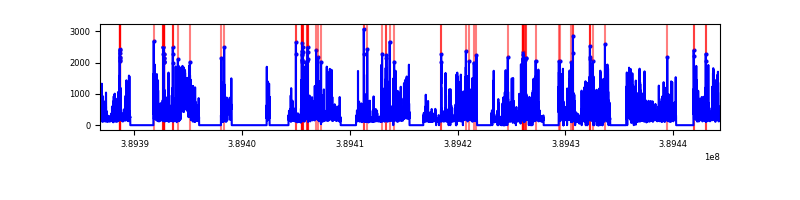 |
Top three noisy pixels from each quadrant. If the there are fewer than three noisy pixels in the level2.evt file, extra rows are filled as -1
| Pixel properties | Quadrant properties | ||||||
|---|---|---|---|---|---|---|---|
| Quadrant | DetID | PixID | Counts | Sigma | Mean | Median | Sigma |
| A | 10 | 83 | 818205 | 1843.05 | 1958 | 1926 | 442.9 |
| A | 15 | 169 | 623972 | 1404.5 | 1958 | 1926 | 442.9 |
| A | 15 | 223 | 124892 | 277.64 | 1958 | 1926 | 442.9 |
| B | 5 | 172 | 3294901 | 8454.36 | 1935 | 1888 | 389.5 |
| B | 5 | 255 | 1197037 | 3068.38 | 1935 | 1888 | 389.5 |
| B | 0 | 190 | 149427 | 378.79 | 1935 | 1888 | 389.5 |
| C | 15 | 214 | 1572174 | 3553.97 | 1901 | 1880 | 441.8 |
| C | 0 | 10 | 371268 | 836.02 | 1901 | 1880 | 441.8 |
| C | 0 | 239 | 103185 | 229.28 | 1901 | 1880 | 441.8 |
| D | 13 | 249 | 2378425 | 5230.05 | 1888 | 1824 | 454.4 |
| D | 2 | 250 | 670802 | 1472.18 | 1888 | 1824 | 454.4 |
| D | 2 | 249 | 636140 | 1395.9 | 1888 | 1824 | 454.4 |
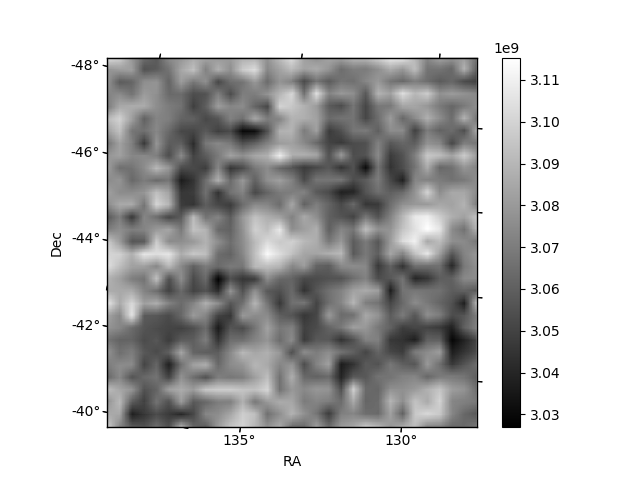
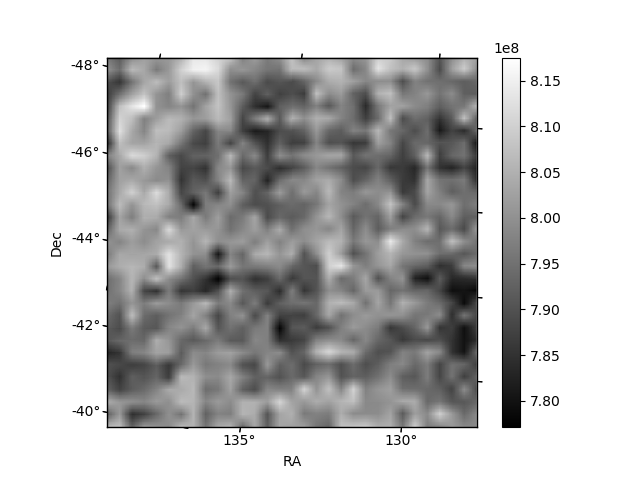
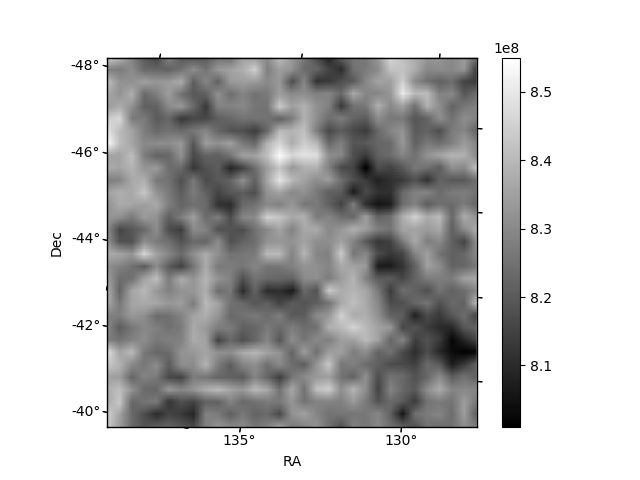
Histogram calculated using DETX and DETY for each event in the final _common_clean file
| Quadrant A | 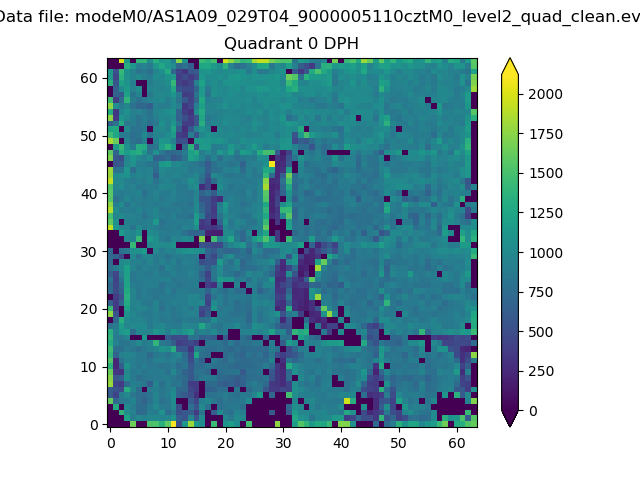 |
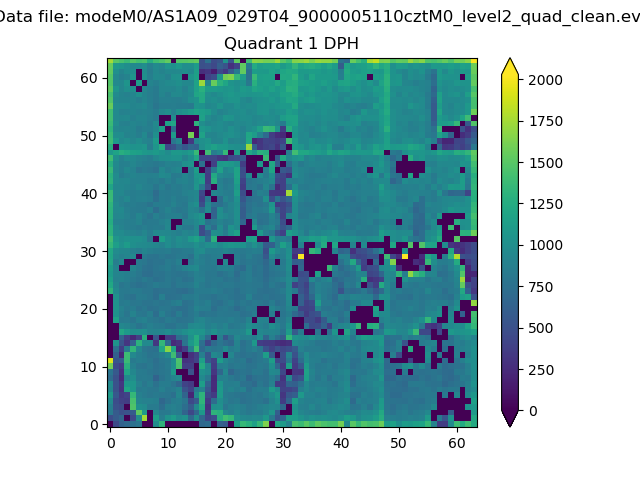 |
Quadrant B |
|---|---|---|---|
| Quadrant D | 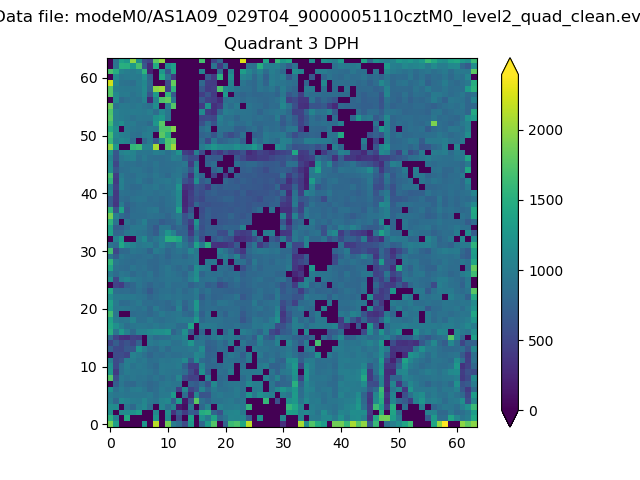 |
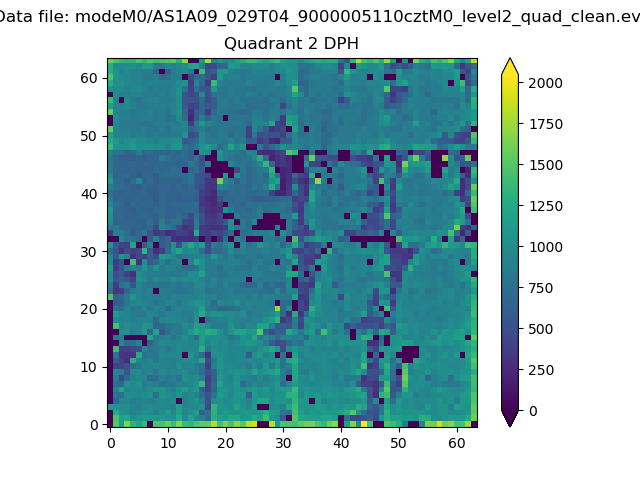 |
Quadrant C |
| Plot type | Count rate plots | Images |
|---|---|---|
| Comparison with Poisson distribution Blue bars denote a histogram of data divided into 1 sec bins. Red curve is a Poisson curve with rate = median count rate of data. |
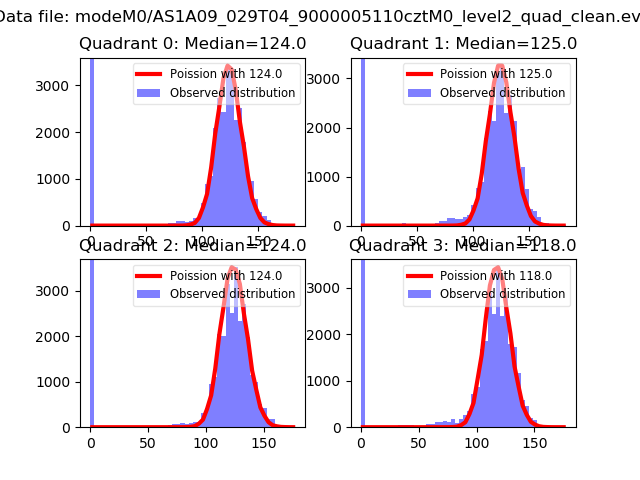 |
 |
| Quadrant-wise count rates Data is divided into 100 sec bins |
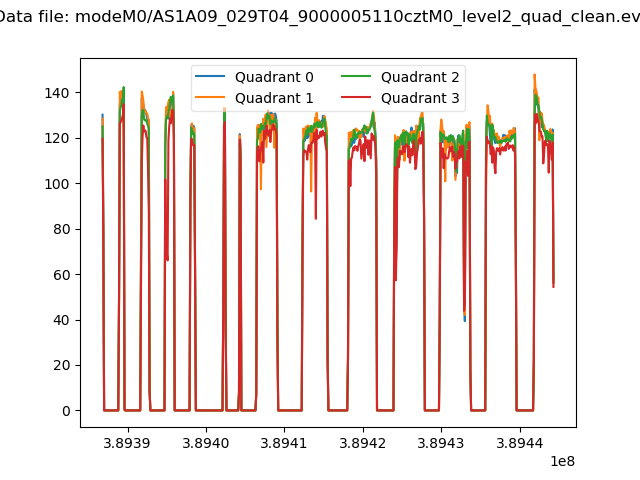 |
|
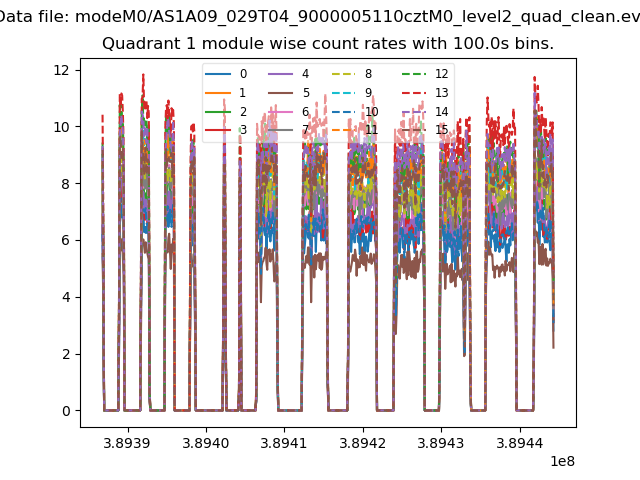
| Module-wise count rates for Quadrant A Data is divided into 100 sec bins |
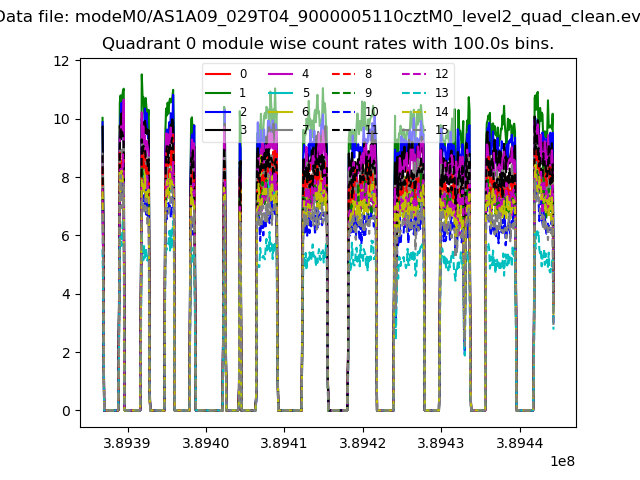 |
 |
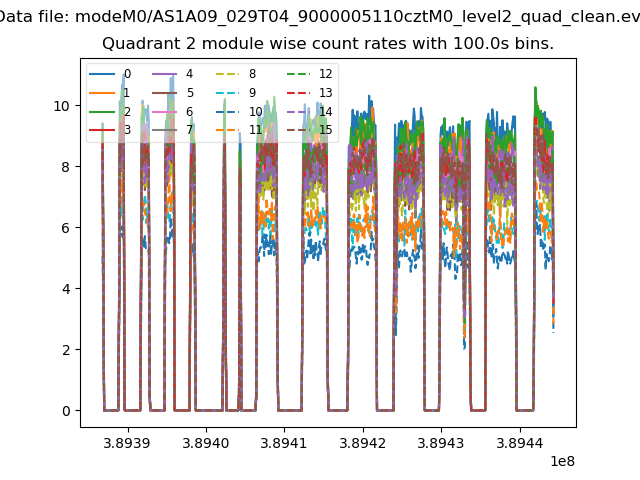
| Module-wise count rates for Quadrant B Data is divided into 100 sec bins |
 |
 |
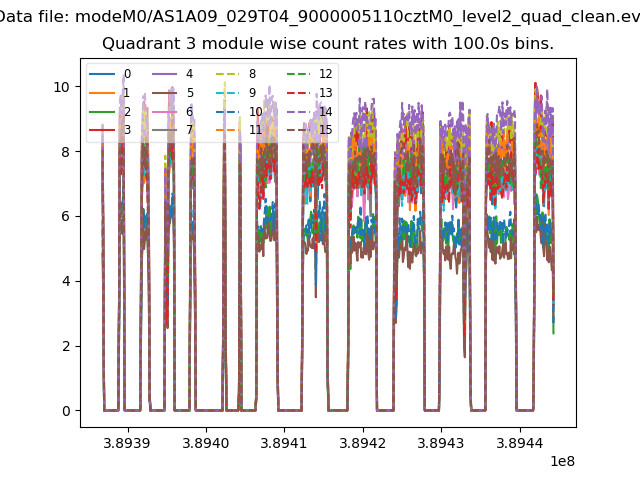
| Module-wise count rates for Quadrant C Data is divided into 100 sec bins |
 |
 |
| Module-wise count rates for Quadrant D Data is divided into 100 sec bins |
 |
 |
| Parameter | Plot |
|---|---|
| CZT HV Monitor | 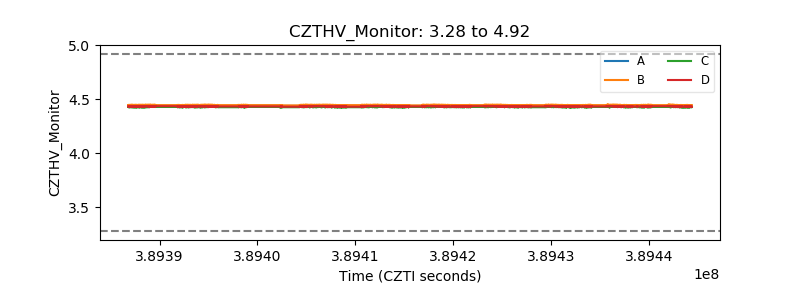 |
| D_VDD | 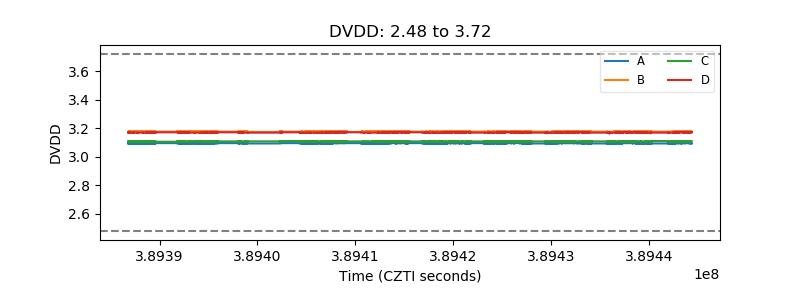 |
| Temperature 1 | 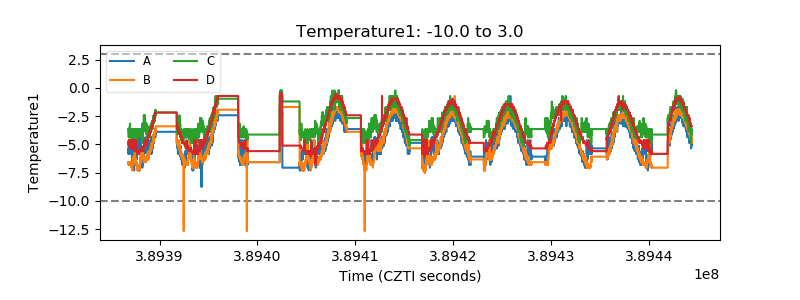 |
| Veto HV Monitor | 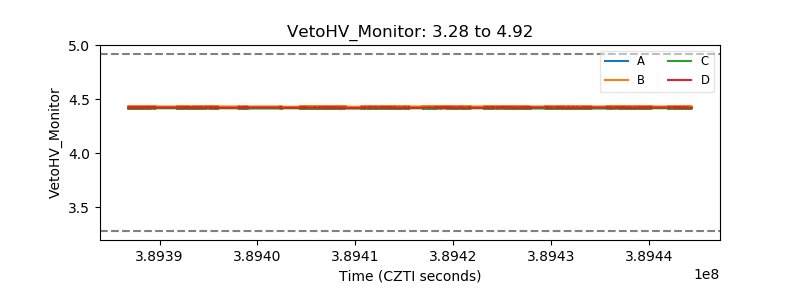 |
| Veto LLD | 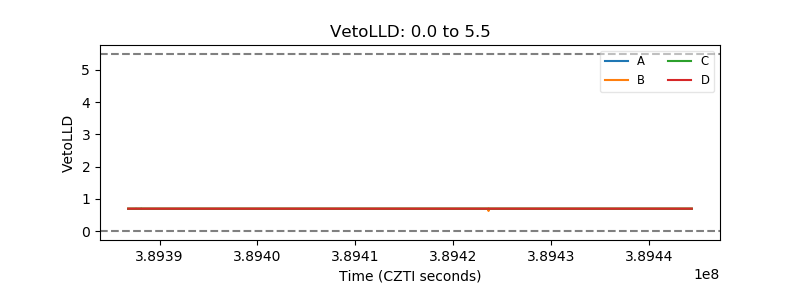 |
| Alpha Counter | 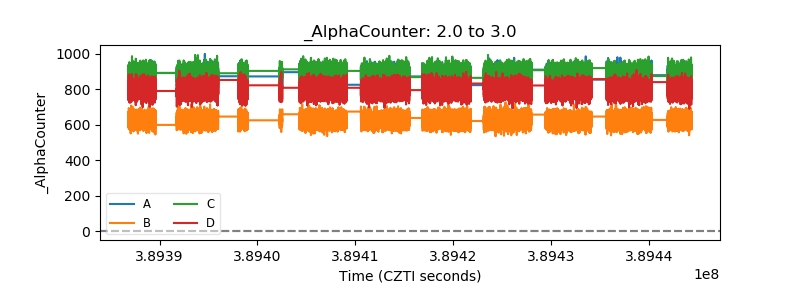 |
| _CPM_Rate | 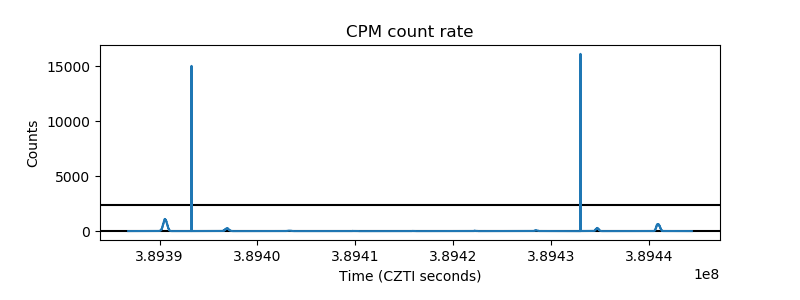 |
| CZT Counter | 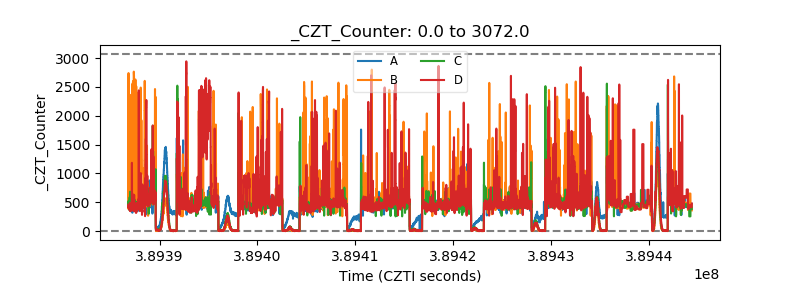 |
| +2.5 Volts monitor | 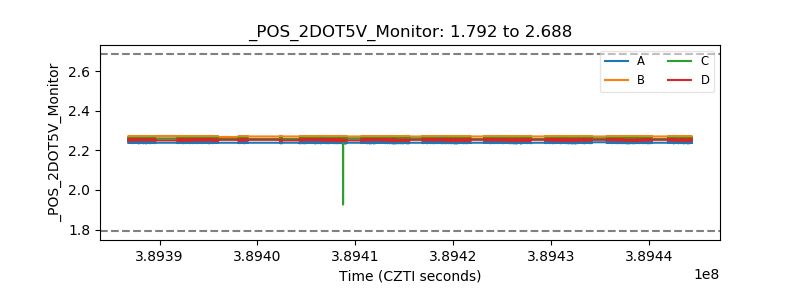 |
| +5 Volts monitor | 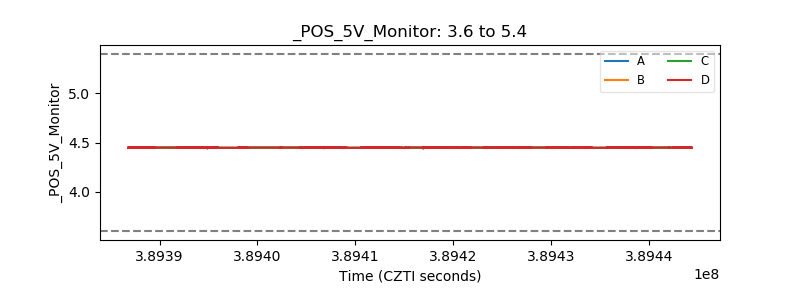 |
| _ROLL_ROT | 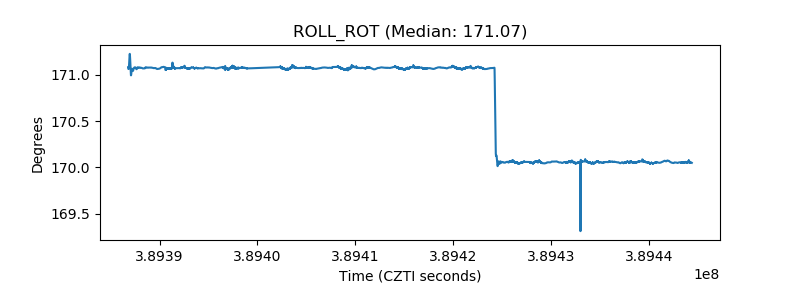 |
| _Roll_DEC | 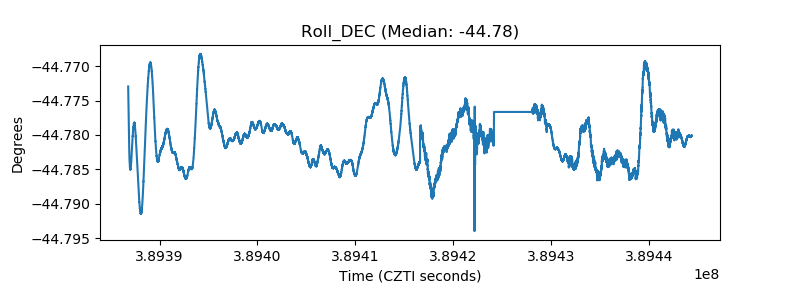 |
| _Roll_RA | 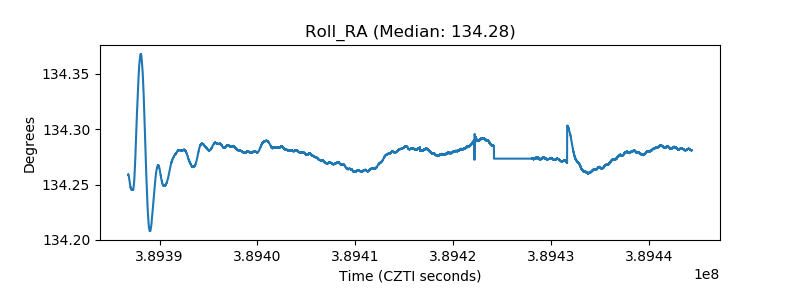 |
| Veto Counter | 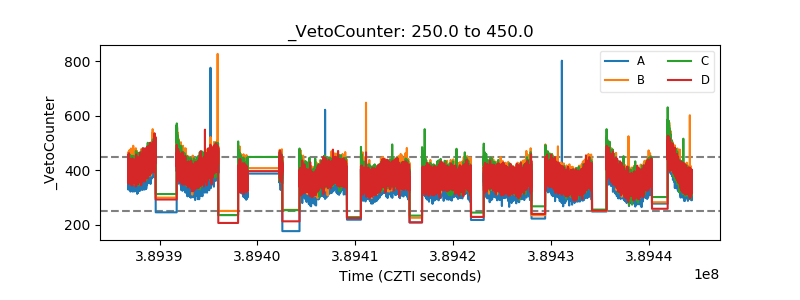 |